Research Article - Imaging in Medicine (2020) Volume 12, Issue 5
In-Silico Virtual Biopsy Platform To Personalize Breast Cancer Treatment
- Corresponding Author:
- Arjun Moorthy
Arizona Center for Cancer Care
Peoria, Arizona, USA
E-mail: arjun.kumar.moorthy@gmail.com
Abstract
Background: Recent studies exhibit preliminary data on the relationship of MRI based imaging phenotypes of breast tumors to breast cancer molecular and genomic characteristics. This study serves to explore relationships between MRI imaging and clinically relevant breast cancer characteristics with acceptable accuracies.
Methods: We analyzed 87 patients from the TCIA/TCGA (The Cancer Imaging Atlas/The Cancer Genome Atlas) open source dataset with invasive breast cancer and pre-operative MRI. LifeX open source software was used to extract radiomic features from MRI images. Machine learning based models based on the radiomic and imaging features were used to predict molecular subtype, recurrence score, novel miRNA correlations and biological pathways from the Hallmark GSEA dataset.
Results: Our models were able to use the radiomic analysis upon MRI images to predict the molecular subtype, risk of recurrence, miRNA expression, and genetic pathway expression. However, of these correlations the most accurate was the prediction of triple negative vs. non-triple negative cancers. The accuracy of the aforementioned correlations was around 92% (p-value = 0.02, 95% CI), while the other remaining correlations were around 69-73% accurate (95% CI), not high enough to be used in clinical practice, but a promising result that can be aided by larger datasets. Risk of recurrence was predicted with a 69-73% accuracy, and an imaging surrogate for miRNA 940 was identified.
Keywords
Breast cancer ■Radiogenomics ■TCGA dataset
Introduction
Breast cancer diagnosis currently is determined from pathology of tissue obtained from an invasive needle biopsy [1]. Following the biopsy, breast cancers can be categorized based on different immunohistochemistry (IHC) patterns of the biomarkers Estrogen Receptor (ER), Progesterone Receptor (PR), Human Epidermal Growth Factor Receptor 2 (HER2), and Ki- 67 [1,2]. The different expression patterns of these biomarkers define the molecular subtypes of breast cancer, and provide information on aggressiveness, response to treatments, and prognosis [1,3,4]. Therefore, clinicians use IHC surrogate markers to extrapolate the molecular subtype.
There are four breast cancer subtypes and by prevalence can be described as luminal A (ER positive/PR positive/HER2 negative), basal (ER negative/PR negative/HER2 negative), luminal B (ER positive/PR positive /HER2 negative or positive), HER2 enriched (ER negative/PR negative/HER2 positive). Chemotherapy is the standard treatment regimen for aggressive invasive cancers (HER2 positive, basal and some luminal B cancers)[2]. Chemotherapy treatment regimens are not personalized, and outcomes vary widely, primarily due to resistance [5,6].
For less aggressive invasive cancers (luminal A & some luminal B), genomic testing (e.g. Oncotype DX) is used to determine a systemic therapy7. Oncotype DX Test is a 21 Gene (16 Cancer & 5 reference) Recurrence Score Assay (1 -100 scale) that is considered to be an independent prognostic factor in node negative, ER+ breast cancer measuring the risk of distant relapse at 10 years7. The Tailor X study redefined the scores as low (<=25: no Chemo treatment) and high (>25: treated with Chemo) in patients >50 years of age [7]. Although Oncotype DX helps determine treatment options, it is expensive and does not provide genetic biomarkers (e.g. miRNA, Genetic Pathways) that can be used for personalizing treatment, the goal of which is to provide the right drug to the right patient at the right time. Identification of biomarkers reflecting the biological differences of cancers is the key to personalize treatments and better outcomes.
One of the obstacles to breast cancer treatment is chemoresistance [6]. miRNA (microRNA) is a class of post-transcriptional gene regulators with critical functions in normal cellular processes as well as disease processes. Accumulating evidence suggests that chemo resistance and miRNAs are closely related as these miRNAs can target and modulate the key genes involved in breast cancer therapy resistance [8].
TABLE 1 describes miRNA’s that have been associated with specific therapies and their role in predicting sensitivity or resistance to specific conventional therapies. In this regard, miRNAs could be potential biomarkers for predicting a response to systemic therapy and prognosis in clinical settings. For instance, targeting specific miRNAs of the drug resistant network is promising in overcoming drug resistance in breast cancer [9].
| Therapy | Generic Name | miRNA | Role in Response | Evidence |
|---|---|---|---|---|
| Hormone therapy | ||||
| SERM | Tamoxifen | miR-375 | Sensitivity | Preclinical/Clinical |
| miR-342 | Sensitivity | Preclinical | ||
| miR-221/222 | Resistance | Preclinical | ||
| SERD | Fulvestrant | miR-221/222 | Resistance | Preclinical |
| AI | Letrozole | let-7f | Sensitivity | Preclinical/Clinical |
| Target therapy | ||||
| Monoclonal AB | Trastuzumab | miR-210 | Resistance | Preclinical/Clinical |
| Chemotherapy | ||||
| FEC | miR-1256 | Resistance | Preclinical/Clinical | |
| Resistance | Preclinical | |||
| Resistance | Clinical | |||
| Taxol/doxo | miR-30c | Sensitivity | Preclinical | |
| Taxol | miR-21 | Resistance | Preclinical | |
| Radiotherapy | ||||
| Radiotherapy | miR-34a | Sensitivity | Preclinical | |
Table 1. Selected miRNA and therapy correlations [9].
There are multiple pathways that are involved within each of these categories [10-12]. The hallmarks of cancer include sustaining proliferative signaling, evading growth suppressors, activating invasion/metastasis, enabling replicative immortality, inducing angiogenesis, resisting cell death Tumor cells evolve a variety of strategies to limit or circumvent apoptosis. Most common is the loss of TP53 (gene making p53) tumor suppressor function, which eliminates this critical damage sensor from the apoptosis-inducing circuitry. Drugs that interfere with each of the acquired capabilities necessary for tumor growth and progression have been developed and are in pre-clinical / clinical trials or in some cases approved for clinical use in treating certain forms of human cancer [13]. Additionally, the investigational drugs are being developed to target each of the enabling characteristics and emerging hallmarks, which also hold promise as cancer therapeutics. The pathways and drugs listed in TABLE 2 are illustrative examples; there is a deep pipeline of candidate drugs with different molecular targets and modes of action in development for many pathways [13-15].
| Pathway | Drugs | Genes Targeted |
|---|---|---|
| p53 | PRIMA1 (phase I/II) | Mutated p53 |
| Angio genesis | Bevacizumab (phase III) | VEGFR1-3 |
| PI13K ATK MTOR | Pictillsib (phase II) | PI13K |
Table 2. Table shows selected pathways and targeted drugs that are under investigation.
Radiogenomics is a new field amongst radiologists that aims to correlate imaging characteristics with genes, mutations and expression patterns. The underlying principle is that biomedical images are the product of processes occurring at the genetic and molecular level [10]. An impactful way to use radiomics / radio-genomics is to look for imaging biomarkers of types of pathways up or down regulated in a cancer [11].
The objective of this study is to create an in-silico radiomics platform to predict cancer subtype, recurrence, & genomic profile of patients from ‘Virtual Biopsy’ of Magnetic Resonance Imaging (MRI) that can be used as an adjunct to clinical practice to expedite, simplify the process to getting this information. Moreover, the added utility is to use MRI imaging to understand if imaging biomarkers can be elucidated to guide treatment.
Methods
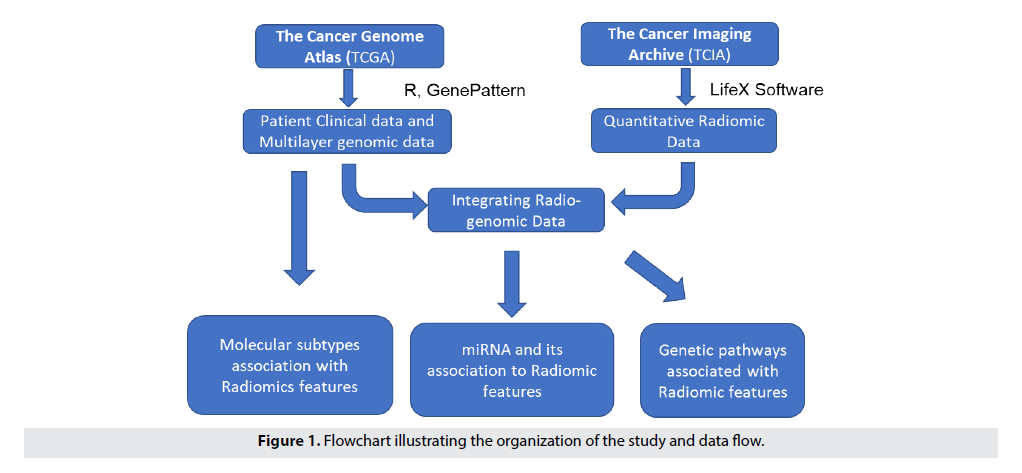
The platform has three major components: Data acquisition & radiomics feature extraction, feature selection & building Radiomics model, and prediction using radiomic model. The generic Radiomics model is created by integrating clinical, imaging and genomic datasets; therefore, Radiomics looks at "images as data" and provides high throughput conversion of images to mineable radiomic features, which are taken as input to the prediction framework that predicts and prioritizes top Radiomic features. Consequently, the proposed framework predicts molecular subtype, recurrence, and miRNA, and biological pathways.
Our research follows a systemic approach that are detailed in the subsequent Sections. FIGURE 1 provides an overview of the process used in the study [11].
■ROI Marking & Feature Extraction
Institutional Review Board Waiver was done since this study utilizes a de- identified public dataset. In this study, we acquire the MRI images of from BRCA dataset of The Cancer Imaging Archive (TCIA) [16]. The dataset includes 87 patients out of which 53 with Luminal A, 13 with Luminal B, 8 with HER2+, and 13 with Basal (13) from 3 institutions with patients age range of 29-82.
LifeX Open Source Software, was used for marking Region of Interest (ROI) & generating Radiomic features [17]. The post-contrast sequence MRI was selected for the study, and to ensure consistent marking across images, radiologist annotated ROI (Axial, Coronal, Sagittal) for Tumor (C1), and Non-Tumor Breast tissue (C2 – as control) using 3D free draw tool in LifeX. The ROI extraction parameters (Spatial Sampling (automated), Intensity discretization (Grey level = 128), Intensity rescaling (1-4000)) was set before generating Radiomic features.
■Feature Selection
LifeX (version 4) produces 62 features for each ROI. These features can be categorized into three categories:
▯ Shape Features: Describe the morphological and geometric characters of a tumor (Volume, Solidity, Eccentricity, Equivalent diameter, Extent, Surface area, Sphericity, and Compacity). These features are typically used by radiologists in their diagnosis.
▯ Histogram Features: Reflect the distribution of intensities of individual voxels in ROIs (Min value, Max value, Mean value, SD value, Skewness, Kurtosis, Entropy (log10), Entropy (log2), and Energy (gray level discretization)
▯ Texture Features: Measure the spatial complexity of the voxel values in ROIs, describing the degree of heterogeneity (Gray-level cooccurrence matrix (GLCM), Neighborhood gray-level different matrix NGLDM). Graylevel run-length matrix (GLRLM), Gray-level zone length matrix (GLZLM).
This step involves selecting features that are best to machine learning (ML) models used in this study which are Support Vector Machine (SVM), Random Forrest (RF), K-Nearest Neighbors (KNN), Linear Discriminate Analysis (LDA), Classification, and Regression Trees (CART). The data were mean centered and normalized to eliminate batch effect (for different institutions) and then unique features which did not correlate with one another (Pearson correlation R2 > 0.4) were selected for use in the ML models. Additionally, features that have shown relevance predictive value in other studies were also included. We used the first-order statistics (shape, histogram, min, mean, max, peak), and Texture matrices (GLCM, GLRM, NGLDM, GLZLM).
■Molecular Subtype Prediction
This step involves building machine learning models using R Packages to correlate selected Radiomics features and cancer subtype data available from the selected benchmark dataset11. Our objective is to identify the role of Virtual Biopsy with Radiomics features to predict Molecular Subtype. We combine the Radiomics Feature Patient File and Molecular Subtype File (Perou Dataset) [18]. The full dataset was randomly partitioned 100 times into a training set (comprising 80% of data and used in parameter learning) and a test set (comprising 20% of data and used for model evaluation). Next, we learn and compare ML Models and pick the best models based on accuracy, which was LDA in our case (mean accuracy = 75%, with a 0.95CI of +/- 10%).
■Recurrence Risk Prediction
This step involves building machine learning models (RF, KNN, CART, SVM, LDA) to correlate select radiomic features and Oncotype DX data available from TCIA’s Multi Gene Assay Perou dataset18. The goal of this step is to build a Radiomics Score (low / high) that is analogous in function to the Oncotype DX Score (Low: <=30 and High: >31) but computed from the radiometric features. To this end, ML models were built and tested using the same approach as 1.3 (above), selecting models by their accuracy in classifying patients into Oncotype DX high or low groups. We then apply the Radiomics Recurrence Score Model to obtain predictions. Here, a support vector machine (SVM) classification was best able to predict the Oncotype DX Score status (high/ low) (mean accuracy = 78% with a 0.95CI of +/- 3%)
■miRNA Correlations
This step involves extracting miRNA tumor expression data from The Cancer Genome Atlas (TCGA) database corresponding to the patients for whom we had radiometric data and correlating individual radiomics features to the miRNA with known clinical implications in cancer treatment. We next, correlated TCGA Genomic Data (miRNA) to individual patient Radiomic features and generated a heatmap to visualize the radiomic features with the best miRNA correlations. These results show the correlation of radiomic features that were highly predictive of miRNA.
■Biological Pathway Correlations
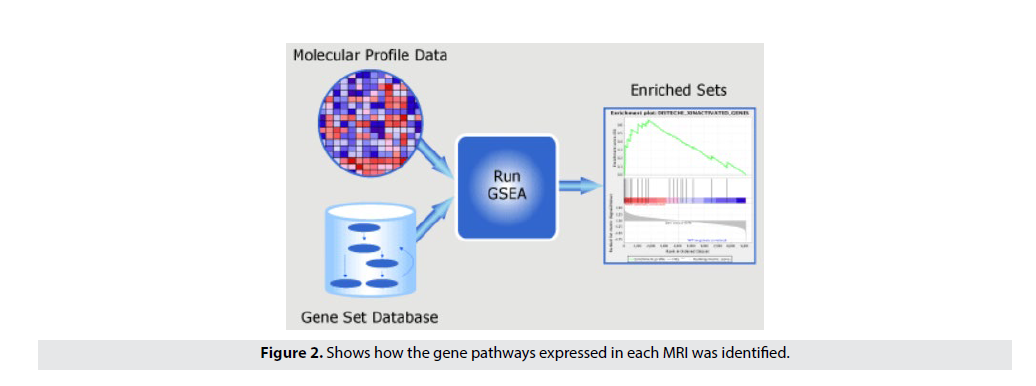
The objective of this step is to identify the role of Radiomics in predicting Biological Pathway associations. Using the TCGA RNA-seq gene expression dataset, this step identifies disease pathways that are significantly associated with radiometric features of individual patients. Using the Hallmark gene set (MsigDB, Broad Institute) we performed single sample gene set enrichment analysis (ssGSEA) to compute the enrichment of Hallmark gene signatures in each patient [19,20]. The normalized enrichment scores of the pathways are then correlated to radiomic features using to identify significant relationships between radiomic features and gene pathways. FIGURE 2 shows how the gene pathways expressed in each MRI was identified. First, we took the miRNA data from the previous workflow and correlated the miRNA to the radiomic features. Then, by taking the highly correlating miRNA, we were able identify the highly expressive biological pathways through the ssGSEA pathway correlation software.
Figure 2. Shows how the gene pathways expressed in each MRI was identified.
■Statistical Analysis
All statistical analyses were carried out in the R statistical computing environment (v3.6.3). Machine learning models were built, tested and visualized using the R package CARET (v6.0- 85). Heatmaps were generated using heatmap3 (v1.1.6) and corrgram (v 1.13). TCGA mRNA data were normalized using the DESeq2 package (v 1.24.0) with default parameters. SsGSEA was performed using the gene pattern cloud provided by the Broad Institute and normalized enrichment scores were used for all downstream analyses. Level of statistical significance, strength of correlations and accuracy of ML models were determined separately for each analysis and are reported in situ.
Results
■Feature Selection Results
LifeX Software generates 62 distinct radiomic features. This section describes the process of narrowing down the features to distinct and relevant features.
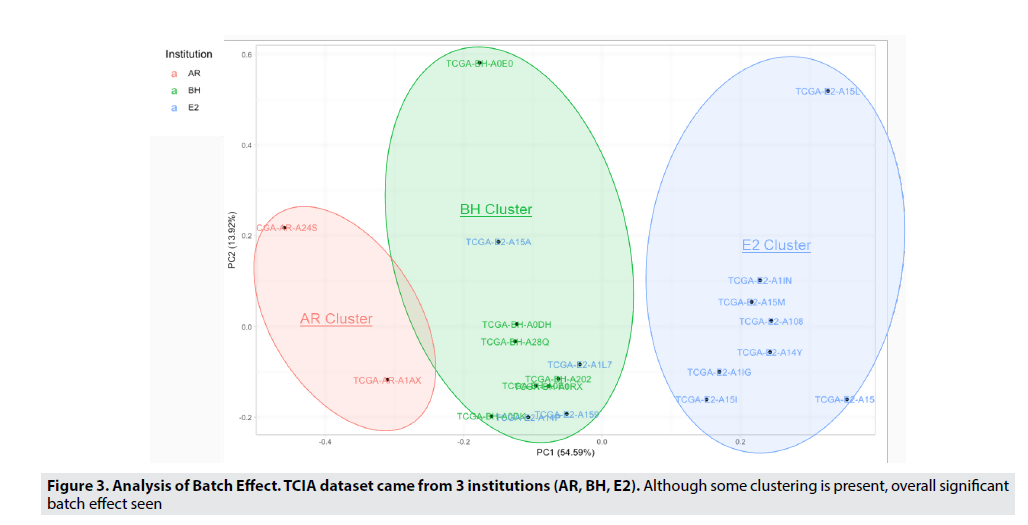
The TCIA breast cancer MRI images are from 3 different institutions (AR, BH, E2), which can lead to differences in image texture that can cause variable results. Through principle component analysis, we were able to identify that this batch effect was due to the institution where the MRI was taken. This hypothesis can be validated as PC1(shown on the X-axis) contained the majority (54.59%) of the variability (or variance) in the dataset, and since the patient vectors (represented by the individual points) are vertically separated by the institution which they came from. Thus, we can determine that this match effect must be due to the institution or hospital where the MRI was taken. FIGURE 3 allows us to visualize and confirm this significant batch effect, and in order to reduce and eliminate the batch effect, harmonization and normalization were used. Normalization and mean value scaling (all vectors set to one plane) were techniques used to remove imaging differences in the MRI images.
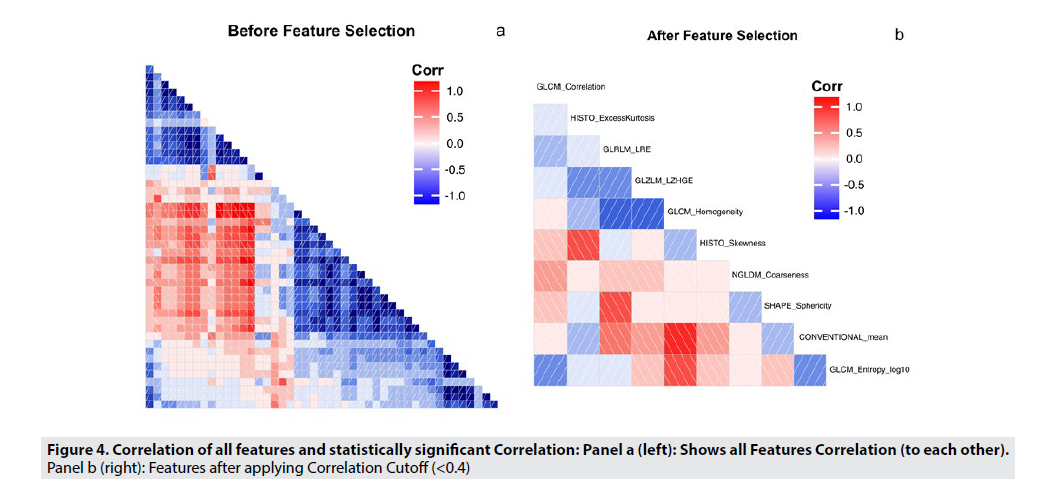
FIGURE 4 shows the pairwise correlation coefficients among all the radiomic features, ranging from -1 to 1, to illustrate the strength of the correlation. A dark red box indicates a strong negative correlation, while a dark blue box indicates a strong positive correlation. FIGURE 4A illustrates all radiomic features and their correlations to each other. In order to reduce the feature space, highly correlated features were selectively excluded from further analysis, because these features would not add to the performance of the model. Including these features could lead to overfitting, especially in a smaller dataset. Using a correlation cutoff of 0.4, and with further analysis, we only included features with a maximum correlation coefficient of 0.4, or were features identified as highly informative in the LifeX Software. The new, reduced set of features are shown in FIGURE 4B. This feature set is detailed in TABLE 3.
| Radiomic Features | Category | Description | Recommended Radiomic Features |
Category | Description |
|---|---|---|---|---|---|
| Sphericity | Shape | Measure of sphericity | GLCM Entropy_Log10 | Textural | Randomness of grey level voxels |
| Excess Kurtosis | Histogram | Outliers of grey level distribution | GLCM Homogeneity | Textural | Homogeneity of grey level Voxel |
| Skewness | Histogram | Asymmetry of grey level distribution | GLRLM LRE | Textural | Distribution of homogenous runs |
| Conventional Mean | Histogram | Standard uptake value in ROI | NGLDM Coarseness | Textural | Spatial rate of change in intensity |
| GLCM Correlation | Textural | Linear dependency of grey level | GLZLM LZHGE | Textural | Distribution of long homogeneous zones with high grey level |
Table 3. Selected radiomic features + LifeX recommended features.
In TABLE 3, highly correlated features are removed due to their non-uniqueness, and that the presence of these features may hamper the predictive ability of any model trained in another setting. From this table, we can conclude that sphericity, the measure of how spherical a Volume of interest is, along with Excess Kurtosis (the measure of the outliers of grey level distribution), Skewness(Asymmetry of grey level distribution), Conventional Mean(Standard uptake value in ROI), and GLCM Correlation(Linear dependency of grey level) were the features that had a correlation coefficient < 0.4. The other five features were manually selected by the LifeX Software, which selects features based on their previous highly correlated features.
■Molecular Subtype Prediction Results
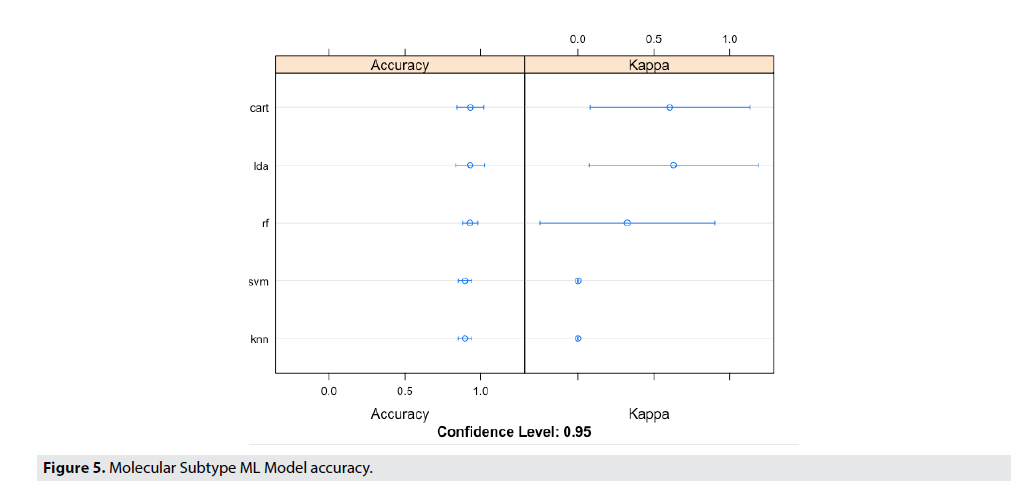
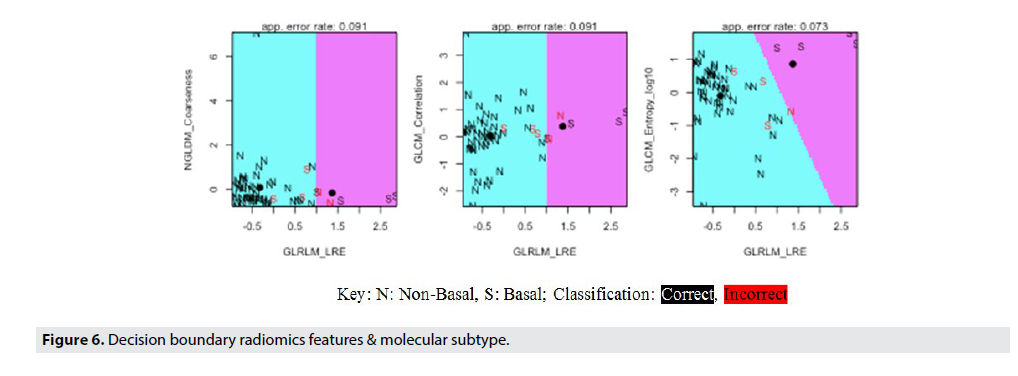
FIGURE 5 shows the Molecular Subtype ML Model accuracy, while FIGURE 6 shows the Decision Boundaries of Radiomics Features & Molecular Subtype.
Figure 5. Molecular Subtype ML Model accuracy.
Looking at early visualizations to understand the accuracy of the model, it was shown that the model’s accuracy would be higher if trained with a basal vs. non-basal classification. This was opposed to the classification to be based on subtype, which is showed in the supplement. The radiomic dataset was partitioned into 70% training data, and 30% validation data. Each model was trained on the training data, and accuracy was determined based on performance in the validation data. This process was iterated 100 times, and therefore providing a range of accuracies. FIGURE 5 illustrates the performance of these various machine learning models in predicting the radiomic features present from the MRI features. Although the variance seems high in the multiple iterations of the validation for kappa values, the mean value outputted for the kappa values was 0.75, thus showing a much more statistically significant kappa value than the previous 0.36 kappa value. Even though, the variance in accuracy of the models are high, the random forest (RF) model predicted with the highest accuracy, and the lowest variance.
The results from the test set are shown. From our analysis, the task of distinguishing between subtypes from each other had an accuracy level of 75%. The signatures of each molecular subtype could be predicted sphericity, excess kurtosis and skewness for luminal A vs B. GLCM correlation predictive of Her2 status and Basal Conventional Mean, Sphericity, GLCM_Correlation.
FIGURE 6 details the specifics of the model accuracy and labels the classification of each individual data point in the test set. By using a decision boundary model, visualizing the precise accuracy of the model in each individual data point becomes possible. From these decision boundaries, the lack of variation in this dataset is apparent. The boundaries contain only two possible classifications for only three of the eight graphs. This fact demonstrates the difficulty of creating a highly accurate model with low variance, as the Luminal A and Luminal B subtypes dominated the dataset, thereby making it difficult for the model to classify HER2 and Basal breast cancers. However, in order to increase the accuracy of this model and produce clinically viable results, the data was segmented into basal and non-basal cancers. This classification was possible due to the similarities between the three non-basal subtypes, (Luminal A, Luminal B, and HER2) and their difference from the basal or triple negative cancers. Thus, by further classifying these cancer subtypes we were able to achieve much higher accuracies and statistical significance (92% accuracy, 95% CI). The Decision Boundary Model is once again extremely important as we can visualize the specific classifications of the data based on the radiomic features of interest identified earlier.
■Recurrence Risk Prediction Results
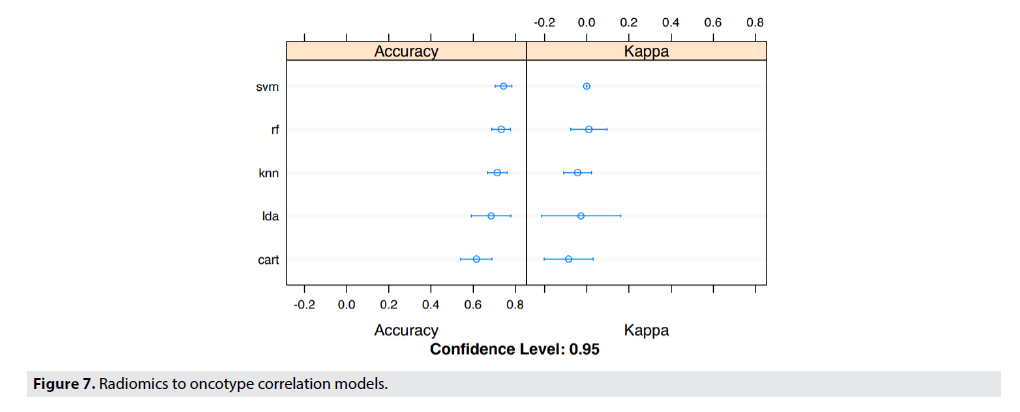
FIGURE 7 details the specifics of the model accuracy in predicting the Recurrence Risk Scores by correlating radiomic features and Oncotype DX. The dataset was partitioned exactly the same as it was in FIGURE 5, and thus lead to large variances in the accuracy of the models. Even though, the variance in accuracy of the models are high, the Linear SVM model predicted with the highest accuracy, and the lowest variance.
Similarly, TABLE 4 shows the predictive features of radiomics recurrence risk predictor. The accuracy of prediction was 69-73% on the best model which was K Nearest Neighbors (KNN) with a confidence level of 95%. The table shows that the Radiomics Recurrence Predictor correlated to OncotypeDx. The tumor entropy (measure of heterogeneity) and GLRLM_LRE (measure of homogeneity) were highly predictive of recurrence score.
| Radiomics Recurrence Predictor | Predictive Features |
|---|---|
| Low | GLRLM_LRE |
| High | GLRLM_LRE; GLCM_Entropy (Log10); GLZLM_LZHGE |
Table 4. Radiomics recurrence risk predictor.
■miRNA Correlations Results
Through GSEA (Gene-Set Enrichment analysis) and linear regression analysis, we performed a study to associate genomic features, including miRNA expressions, and genetic pathways in the Hallmark database with three categories of radiomic phenotypes including 1st order histogram features, shape features, and textural features.
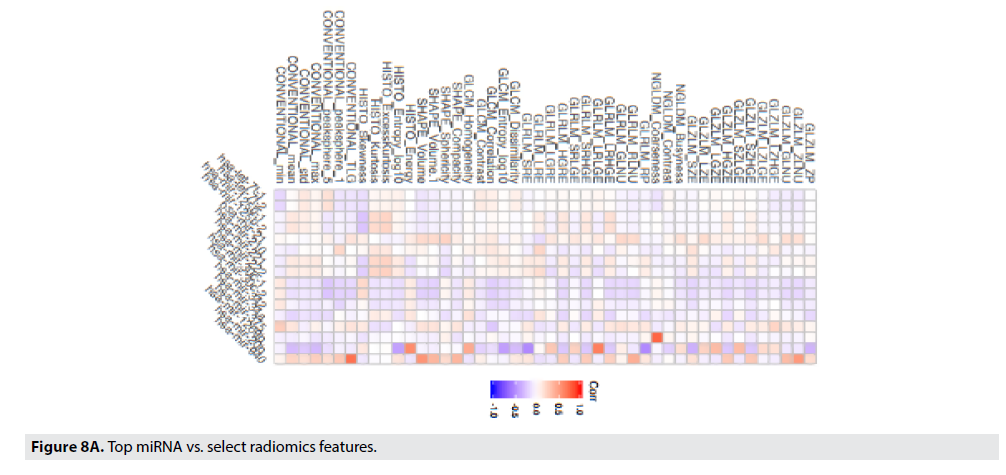
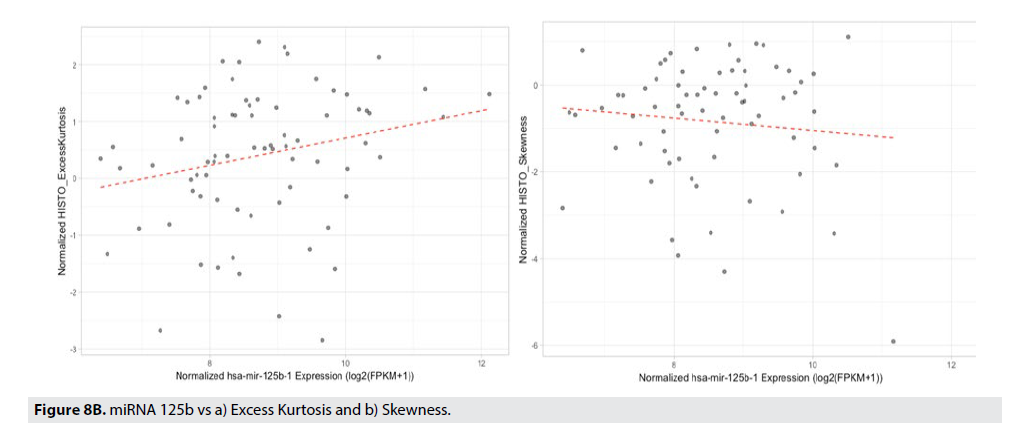
FIGURE 8A displays the strength of the correlation of the radiomic feature to the particular miRNA using a Pearson’s correlation. The correlation coefficient is illustrated in the color of the box (blue boxes indicate negative correlations, the red boxes indicate positive correlations, and the darker the box, the stronger that correlation). Gray-Level Zone Length Matrix Gray-Level Non-Uniformity (GLZLM_GLNU), Kurtosis, Entropy, and Neighborhood Grey-Level Different Matrix Coarseness (NGLDM_Coarseness), are features that best correlate to miR-125b, miR- 940, miR-20b, and respectively. FIGURE 8B illustrates the best correlating radiomic feature, Conventional_TLG with the best correlating miRNA, miR-940.
■Biological Pathway & Radiomic Correlations
The associations between the transcriptional activities of the Hallmark pathways and the radiomic phenotypes were studied using GSEA14–15. A total of 1,103 statistically significant (adjusted p-values ≤0.05) associations have been identified.
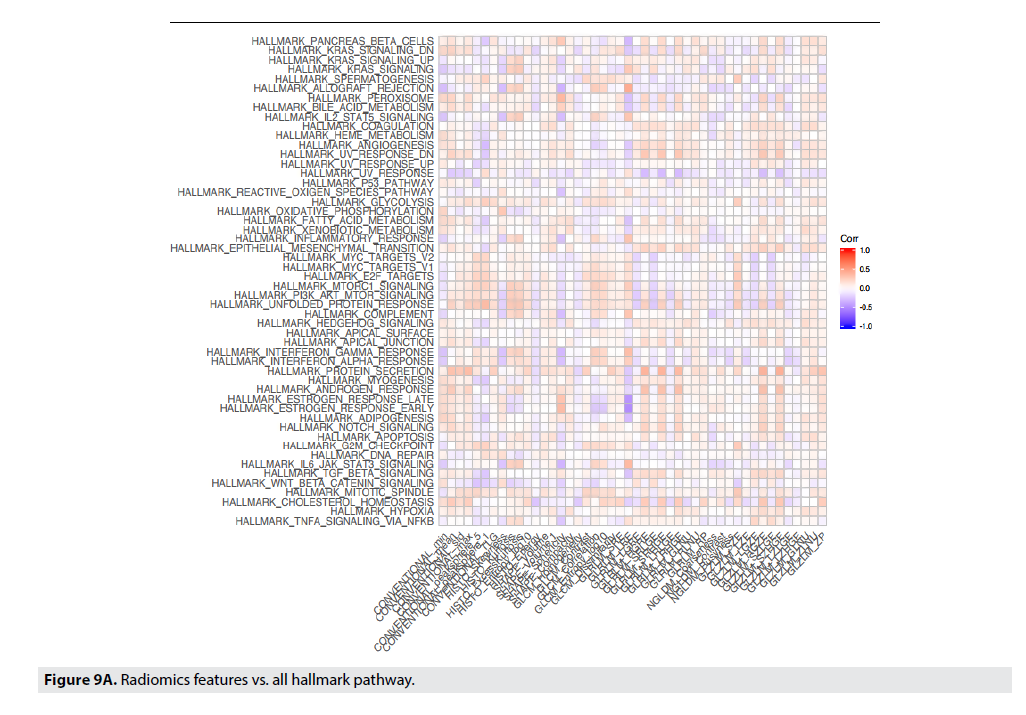
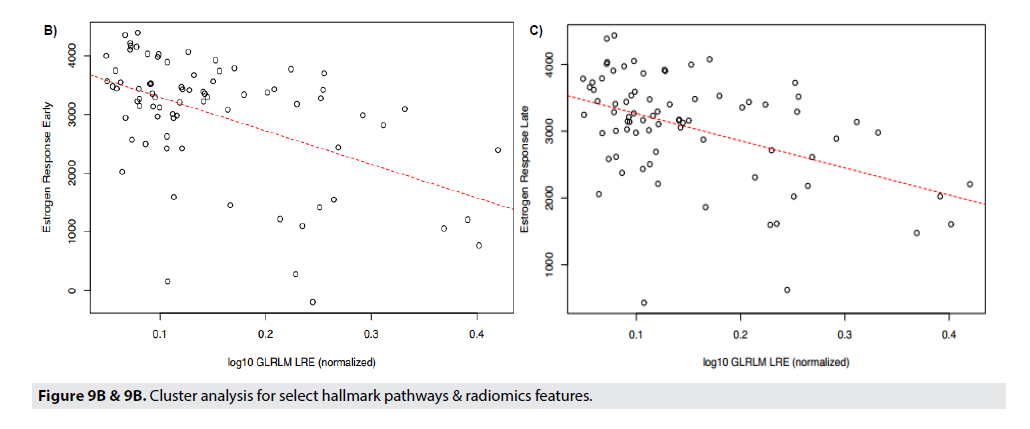
FIGURE 9A shows correlations between radiomic features to the genetic pathways. In Panel 10a all correlations are displayed and the strongest pathway correlations occurred between the p53 tumor suppressor pathway and Gray- Level Co-Occurrence Matrix(GLCM) Entropy, GLZLM_GLNU, PI3 Kinase-AKT-MTOR signaling pathway (P13K_AKT_MTOR) and Skewness, Kurtosis, GLCM_Contrast, and GLCM_Correlation, and Angiogenesis and GLZLM_Short-Zone High Gray-level Emphasis (SZHGE) and GLZLM_High Graylevel Zone Emphasis (HGZE). Panel 9b and 9c illustrate the two strongest correlations between the radiomic features and the genetic pathways. Panel 9b and 9c displays the correlation between Gray-Level Run Length Matrix Long- Run Emphasis (GLRLM_LRE) to Estrogen Response Early, and Estrogen Response Late, respectively. Each of these graphs indicate a moderately strong positive correlation between the genetic pathway, and the radiomic feature (FIGURE 9B & 9C).
The strongest radiomic predictor was estrogen response early and late. Late response can predict later recurrence in ER+/Her2 negative patients and predict a longer course of treatment.
Discussion
The work up until today in the field of breast radiogenomics has been emerging with promising results. The literature supports that there is some association between the genomics of breast cancer and the MRI imaging characteristics [10,11]. Numerous radiomic studies exist with regards to breast cancer and mammography and breast MRI. Radiomics has recently been used to look at female breast cancer status and predict axillary node status with a confidence interval of 90% using deep learning radiomics of US and shear wave elastography in early stage breast cancer [21-28]. Looking at Computer extracted textural features (Radiomics) has been used in predicting BRCA1/2 probability from textural parenchymal differences not visible to the naked eye [29]. There are numerous studies looking at radiogenomics of MRI imaging features to predict molecular subtypes, luminal A(p=0.004), Her2 enriched (p=0.00277) and basal like (p=0.0117)30, and imaging biomarkers predicting pathways associated with survival.
Machine learning models capable of discerning luminal A molecular subtype (AUC=0.697), triple-negative breast cancer (AUC = 0.654), ER status (AUC=0.649), and PR status (AUC = 0.622) were reported [23].
In this study, we conducted an analysis of radiomics features to predict molecular subtype of breast cancer. Our accuracy for individual molecular subtypes was in line with literature. Our accuracy was similar to prior reports if we look at molecular subtype individually. However, by classifying luminal A, and B cancers together, we can predict luminal type cancers, HER2 positive cancers and basal type cancers with a higher confidence This may be clinically more relevant as basal and HER2 positive tumors generally require neoadjuvant chemotherapy. The added clinical value is that the core needle biopsy has an accuracy of 87% in identifying the state of HER2 [24]. Predicting HER2 with a higher confidence interval can be an additional tool to correctly identify HER2- positive cancers by providing these patients with the same benefits as HER2-based therapy’.
Having the ability to predict which miRNA may be influencing a tumor’s behavior may allow treatment modifications. Many studies have shown miRNA 125b to have tumor suppressor functions. 26 Specifically, our model suggests miRNA 125b can be predicted by radiomic features kurtosis and skewness. Studies show that miRNA 125b is downregulated in breast cancer cell lines [26]. Furthermore, it has been shown that miRNA125b absence confers resistance to doxorubicin (chemotherapy drug commonly used in breast cancer). Having the ability to predict the presence or absence of miRNA125b may aid in understanding the resistance or sensitivity chemotherapeutic agents. TABLES 5-8 exhibits imaging biomarkers for specific biological pathways such as the p53 pathway. Having knowledge of an impaired p53 pathway can help customize therapy to use drugs like Prima-1 [27].
TABLE 5 summarizes predictive radiomic features. The overall accuracy of prediction was 63-72% based on the best model which was the Random Forest-confidence level 95%. The table shows that luminal A and luminal B do not have clear radiomic classifiers among them, but they can be well classified against HER2 and basal subtypes.
| Subtype | Predictive Radiomic Features |
|---|---|
| Luminal A | Sphericity, Excess Kurtosis, Skewness |
| Luminal B | Sphericity, Excess Kurtosis |
| HER2 | GLCM_Correlation |
| Basal | Conventional Mean, Sphericity, GLCM_Correlation |
Table 5. Molecular subtype prediction.
Similarly, TABLE 6 shows the predictive features of radiomics recurrence risk predictor. The accuracy of prediction was 69-73% on the best model which was K Nearest Neighbors (KNN) with a confidence level of 95%. The table shows that the Radiomics Recurrence Predictor correlated to OncotypeDx. The tumor entropy (measure of heterogeneity) and GLRLM_LRE (measure of homogeneity) were highly predictive of recurrence score. Imaging biomarkers can be used to predict recurrence score, consistent with prior studies. Currently, recurrence score (high vs low) is not available rapidly and can take up to 2 weeks to get a result.
| Radiomics Recurrence Predictor | Predictive Features |
|---|---|
| Low | GLRLM_LRE |
| High | GLRLM_LRE; GLCM_Entropy (Log10); GLZLM_LZHGE |
Table 6. Radiomics recurrence risk predictor.
Our study adds to the body of existing literature, in really evaluating imaging biomarkers that can help understand associations between genotypes and imaging phenotypes.
TABLE 7 shows select miRNA prediction features. The miR-940 had the strongest radiomic correlation to GLZLM_ZLNU. miR- 125b, miR-21, and miR-221 also have radiomic correlations. They are known to predict drug resistance and lymph node metastasis (miR- 940). However, the up/downregulation is not currently captured in radiomic correlations of this study.
| miRNA | Radiomic Features |
|---|---|
| miR-940 | GLZLM_ZLNU (+) |
| MiR-20b | Entropy, GLRLM_LRLGE, GLRLM_RP,GLRLM_SRE |
| miR-125b | Kurtosis, Skewness |
| miR-21 | Sphericity, GLRLM_RLNU, GLNU |
| miR-221 | Kurtosis |
Table 7. Selected miRNA prediction.
Table 7 shows several possible imaging biomarkers for miRNA. The loss of several tumor suppressor miRNA (i.e. miRNA 125b) has been observed in breast cancers. Having the ability to predict which miRNA may be influencing a tumor’s behavior may allow treatment modifications. Many studies have shown miRNA125b to have tumor suppressor functions specifically, our model suggests miRNA 125b can be predicted by radiomic features kurtosis and skewness. Studies show that miRNA125b is downregulated in breast cancer cell lines [26]. Furthermore, it has been shown that miRNA125b absence confers resistance to doxorubicin (chemotherapy drug commonly used in breast cancer). Having the ability to predict the presence or absence of miRNA125 may aid in understanding the chemo sensitive or resistant nature to common chemotherapeutic agents. TABLE 8 exhibits imaging biomarkers for specific biological pathways such as the p53 pathway. Having knowledge of an impaired p53 pathway can help customize therapy to use drugs like Prima-1 [27,30].
| Hallmark Pathway | Radiomic Features |
|---|---|
| P53 pathway | GLCM Entropy (+), GLZLM_GLNU (-) |
| P13K_AKT_MTOR | Skewness (+); kurtosis (-), GLCM_Contrast (+); GLCM_Correlation (-) |
| Angiogenesis | GLZLM_SZHGE,(-) GLZLM_HGZE (-) |
Table 8. Biological Pathway Prediction (select).
Biological Pathway Prediction features shown in TABLE 8 indicates a strong correlation between radiomic features of heterogeneity (GLCMEntropy, Contrast) and pathway associated with proliferation.
Implications
The platform offers several major improvements over existing experimental and computation methods. The proposed framework is an end-2-end computational framework that allows the entire radiomic pipeline in one platform - from MRI analysis to generating clinically relevant information to guiding treatment. The framework can enhance clinical medicine. The platform leverages computation methods, research, and associations between pre-determined biological features and gene expression to provide clinically relevant information. As a data platform, it can be continually enhanced to improve accuracy. With minimal modification to the current diagnosistreatment, the framework is inexpensive and can be used on a larger patient population. Moreover, the platform like this can be used to reduce the time for drug discovery by modeling the process in-silico.
There are certainly limitations to our study as this study is based on retrospective datasets, e.g. TCGA, TCIA. These datasets were useful for the first publications on this topic; however, to advance in this field, new databases with larger sample sizes with uniformity of imaging data are needed’.
Conclusion
This study provides an approach for building a data-driven approach to generate molecular subtype, predict recurrence, predict genetic pathways, and miRNA profile using Radiomics. Although current accuracy level is not good enough for clinical practice, it can be used to augment clinical medicine. The platform suggests a Virtual Biopsy approach can potentially eliminate the need for an invasive biopsy by using MRI and obtaining information that can aid clinicians to personalize treatment. The Radiomic features of MRI show promise as a means of high-throughput image-based detection and treatment and can potentially predict molecular subtypes and recurrence profile. This study also suggests imaging biomarkers for predicting recurrence risk, miRNA940b whose down regulation was observed in breast cancer patients with lymph node metastasis21. It investigated recurrence correlations through texture analysis with Radiomics. The unique integration approach requires no expensive equipment and therefore could be used to provide precise tumor information for clinicians and help speed up drug discovery. In the future, we plan to extend the platform to predict other cancer types such as lung cancers including new imaging types (PetCT & CT Scan) and work on Radiomics features that can predict lymph node metastasis and potentially avoid lymph node biopsy if negative lymph nodes can be predicted.
