Review Article - Imaging in Medicine (2014) Volume 6, Issue 1
Imaging evidence of the relationship between atherosclerosis and chronic obstructive pulmonary disease
Damien Pike1,2, Tamas J Lindenmaier1,2, Don D Sin3 & Grace Parraga*,1,2,41Imaging Research Laboratories, Robarts Research Institute, The University of Western Ontario, London, Canada
2Department of Medical Biophysics, The University of Western Ontario, London, Canada
3James Hogg Research Centre, University of British Columbia, Vancouver, Canada
4Graduate Program in Biomedical Engineering, The University of Western Ontario, London, Canada
- Corresponding Author:
- Grace Parraga
Imaging Research Laboratories
Robarts Research Institute
The University of Western Ontario, London, Canada
Tel: +1 519 931 5265
Fax: +1 519 931 5238
E-mail: gparraga@robarts.ca
Abstract
Tobacco smoking is a risk factor for both pulmonary disease and atherosclerosis and a number of studies have provided both experimental and epidemiological evidence about the potential links between chronic obstructive pulmonary disease and atherosclerosis that is not explained by tobacco smoking alone. While this evidence is very compelling, the direct mechanisms that potentially accelerate atherosclerosis development in patients with chronic obstructive pulmonary disease have not been established. At the same time, major advances in quantitative pulmonary and vascular noninvasive imaging tools have advanced the development and validation of surrogate or intermediate end points of these chronic disorders. This article provides a review of emerging and established imaging methods that have the potential to quantify pulmonary disease and atherosclerosis noninvasively and robustly, in the same patients over time; we summarize studies that endeavored to evaluate lung structure–function and atherosclerosis in order to provide novel insights on disease pathogenesis and progression.
Keywords
atherosclerosis • computed tomography • COPD • intima–media thickness • MRI • ultrasound
Background & overview: is there a relationship between chronic lung & vascular disease that is not explained by smoking history?
There is increasing evidence that chronic obstructive pulmonary disease (COPD) and atherosclerosis may be directly and mechanistically related beyond shared risk factors of cigarette smoking and exposure to environmental pollutants. Large-scale investigations such as the Lung Health study [1], the MESA lung study [2] and the ARIC study [3], along with population-based studies on COPD mortality and morbidity [4–6], have established that impaired lung function is a risk factor for vascular disease, independent of cigarette smoking. While atherosclerosis and chronic pulmonary disease share common risk factors such as cigarette smoke, air pollution, biomass exposure, poor nutrition and in much of the developed world, low socioeconomic status [7], the relationship between COPD and atherosclerosis-related morbidities, such as ischemic heart disease and stroke, extend beyond these shared risk factors. However, the exact mechanisms underlying this relationship are not well understood [8].
As shown in Figure 1, van Eeden and others have recently proposed the ‘lung permeability’ theory as an important mechanism behind the relationship between COPD and atherosclerosis [8]. These authors and others suggest that inhalation of the environmental irritant (e.g., cigarette smoke, air pollution particles, respiratory viral or bacterial microbes) is the inciting event. In response, the host mounts a robust inflammatory reaction to control and eliminate these environmental irritants, preventing the direct translocation of toxic chemicals, respiratory pathogens and air pollution particles into the systemic circulation and enabling the host defenses to remove these unwanted visitors.

Figure 1: Proposed mechanism explaining atherosclerosis burden in patients with chronic lung disease related to smoking or environmental toxins. Chronic exposure to toxins, mainly cigarette smoke and/or air pollution triggers an inflammatory response within the lung air spaces that is dominated by alveolar macrophages. The inflammatory markers within the alveoli spill [8] into the vascular system where they stimulate the liver and bone marrow to release various inflammatory and coagulation mediators such as: C-reactive protein, fibrinogen, platelets and leukocytes. The systemic inflammatory response that follows promotes atherogenesis in combination with high levels of circulating cholesterol, coagulation factors and inflammatory mediators. LDL: Low-density lipoprotein; NO: Nitric oxide.
To promote this process, airway epithelial cells, alveolar macrophages and various circulating hematopoietic cells (e.g., neutrophils) synthesize cytokines, chemokines and reactive oxygen and nitrogen species in the lungs. Because the lungs are highly vascularized, it is possible although not proven, that during periods of inflammatory and oxidant stress, the alveolar–capillary interface may become highly permeable and allow inflammatory mediators to migrate into the systemic circulation. Some of these inflammatory mediators (e.g. IL-6 and IL-1β) can coax the liver to increase production of secondary mediators of inflammation such as C-reactive protein, fibrinogen, serum amyloid protein and procoagulant factors, and the bone mar row to increase the synthesis and release of leukocytes into the systemic circulation, causing an amplification of the inflammatory signal. With chronic lung insult (as in the case of cigarette smoking or living in highly polluted areas), the alveolar–capillary interface may ‘re-model’ and become persistently ‘leaky’, leading to a state of chronic (low-grade) systemic inflammation, even after the environmental exposure is removed (as in the case of smoking cessation). The constantly elevated level of inflammatory markers may contribute to the genesis and progression of atherosclerosis. However, recent work in this area [9,10] has shown that systemic inflammation is not the only factor contributing to atherogenesis in COPD. In fact, systemic inflammation is common to several COPD comorbidities [9] and it was recently shown that COPD patients with cardiovascular disease differ only in levels of IL-6 [10]. This suggests there must be other drivers of cardiovascular disease in COPD. Potential mediators, such as nutrition, inactivity, genetic factors or medication, may promote vascular dysfunction in COPD patients.
To date, the large majority of studies evaluating links between pulmonary and vascular disease have focused on pulmonary function tests to assess lung function and mainly carotid atherosclerosis intermediate end points such as intima–media thickness (IMT). One major limitation of ‘global’ pulmonary function tests is that they provide no anatomical or regional information of the lungs [11]. This limitation has been surmounted by the advent of noninvasive pulmonary imaging techniques that can directly quantify pulmonary structure–function correlates and enable accurate phenotyping of disease [12–14].
The risk of atherosclerosis can be monitored with or without vascular imaging techniques. Commonly, blood level measurements of lipids such as low-density lipoprotein, high density lipoprotein and triglycerides and, less frequently, inflammatory mediators such as C-reactive protein and myeloperoxidase, are used to provide surrogate measures of lipid profile and systemic inflammation, which may play a role in atherogenesis. In addition to blood sampling, the ankle brachial index (ABI) – the ratio of the systolic pressure of the ankle to the arm – is also widely used as another ‘nonimaging’ surrogate measure of atherosclerosis [15,16]. Although these nonimaging methods have been used in pulmonary–vascular disease studies, they are limited in the fact that they provide measurements of ‘generalized’ atherosclerosis or vascular disease [15]. From a direct imaging perspective, carotid ultrasound (US) measurements have emerged as reliable tools for evaluating atherosclerosis burden because they correlate well with future cardiovascular events [17,18] and, importantly, the method is relatively rapid, inexpensive and uncomplicated to acquire and quantify. Although there is still some controversy as to which US measurement best estimates risk of outcomes such as stroke [19], there is no disagreement that extensive development of noninvasive imaging methods to directly quantify atherosclerosis [20–24] has stimulated the development of improved medical treatment options and improved outcomes [25].
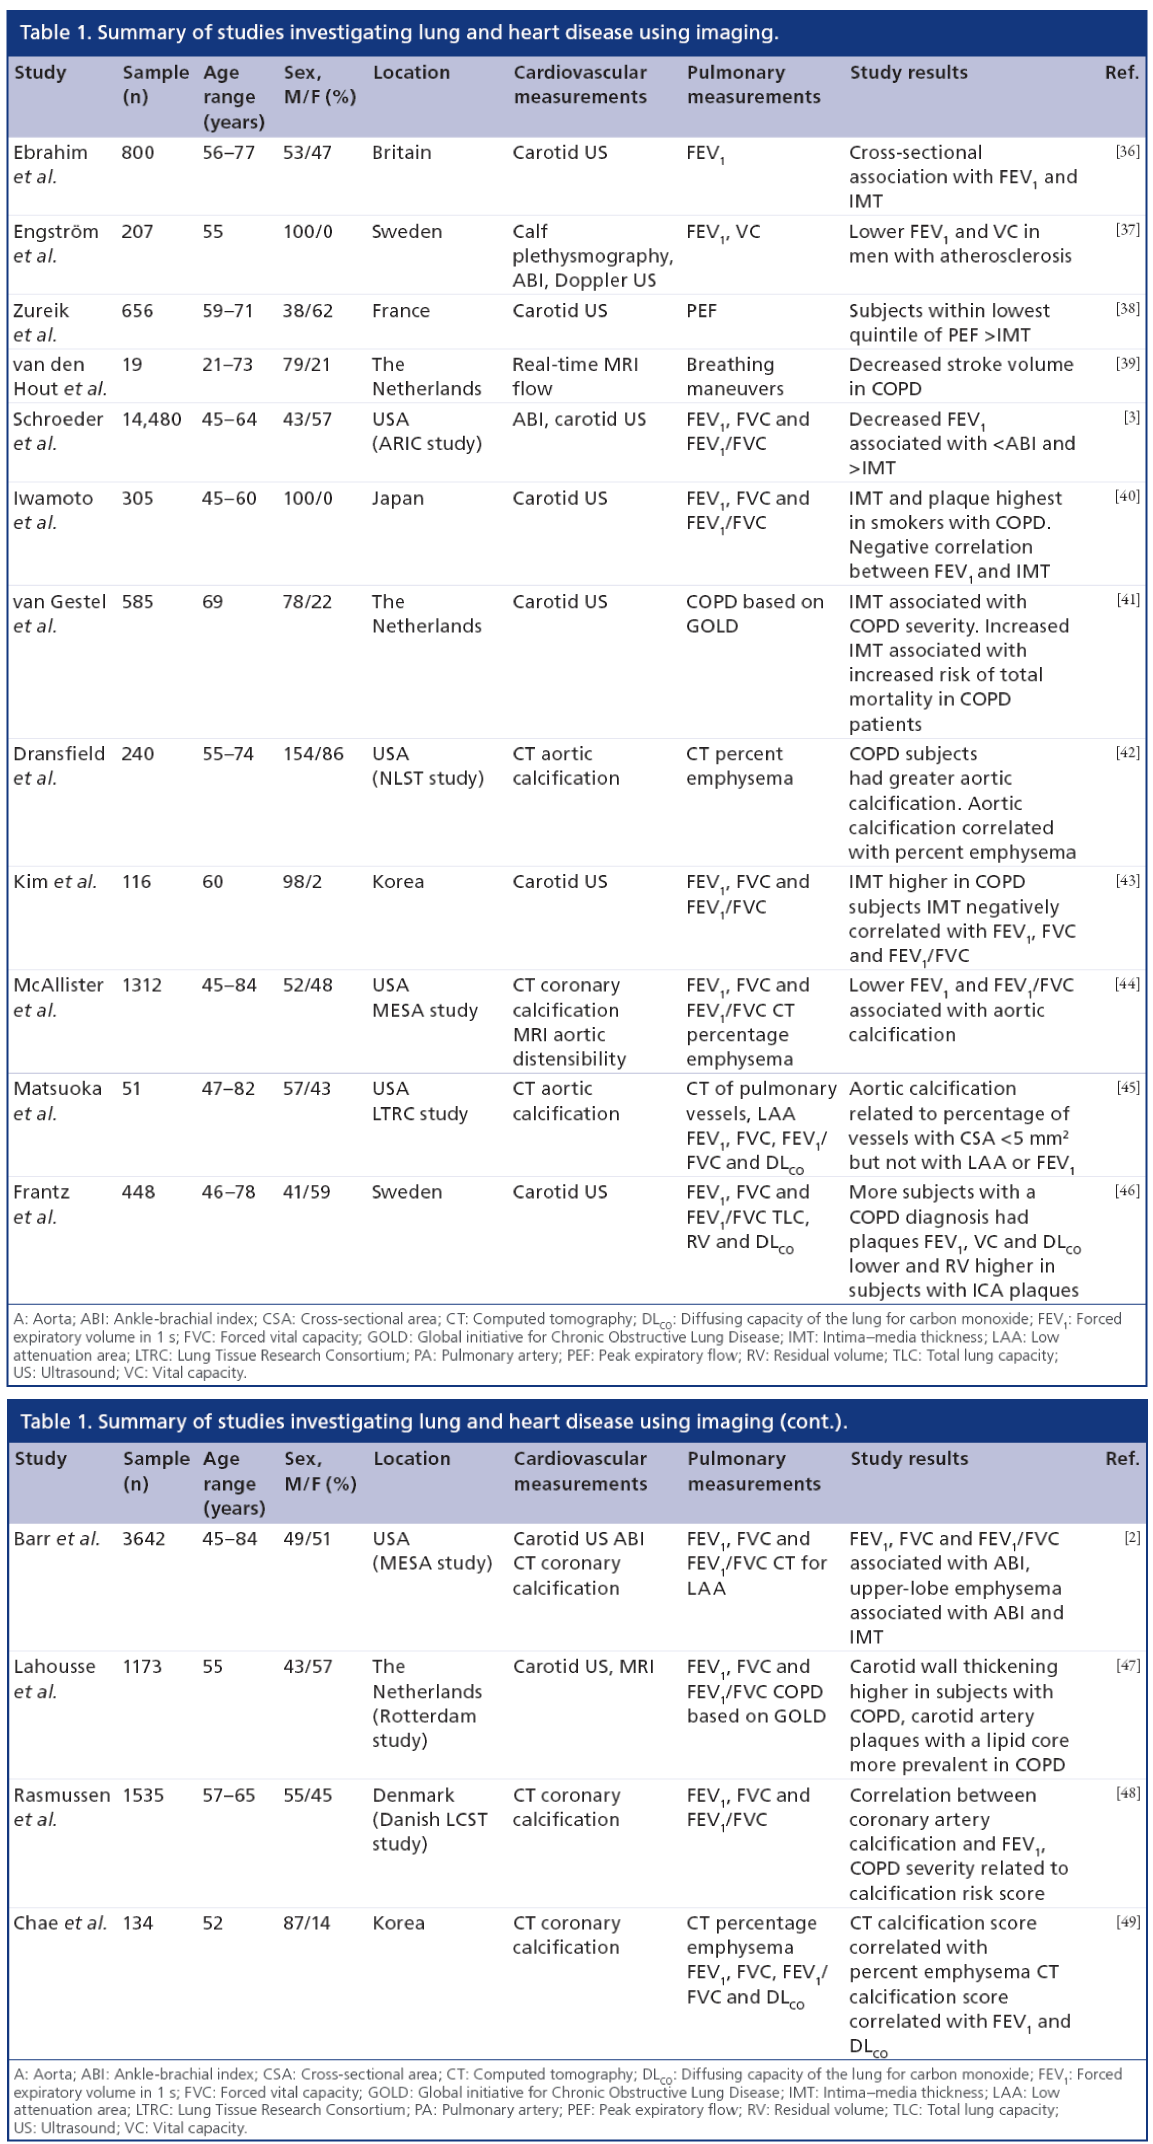
As several excellent reviews are available on chronic respiratory disease [26] and cardiovascular risk [7,27–29], and owing to the limited use of angiography [30–33] and intravascular US [34,35] for research purposes outside of coronary artery disease, here we focus on emerging pulmonary and atherosclerosis imaging techniques. There are few studies published that use imaging to interrogate pulmonary and vascular disease in the same patients. As summarized in Table 1, a number of key studies have primarily used imaging to investigate the relationship between carotid atherosclerosis and pulmonary function in COPD. Collectively, these studies provide a strong foundation for future studies that may incorporate novel imaging methods of both pulmonary and vascular disease in smokers and ex-smokers.
Imaging atherosclerosis
Carotid arteries
Carotid atherosclerosis is the main cause of transient ischemic attack and ischemic stroke, and is believed to be closely linked to atherosclerosis in the coronary and peripheral vascular beds that cause myocardial infarction and leg claudication, respectively [50]. As shown in Figure 1 and in more detail in Figure 2, the carotid artery bifurcates within the neck and in most subjects, this allows for direct and noninvasive imaging through the neck tissues using US methods. In the longitudinal or transverse view, the atherosclerotic plaque is typically observed near the bifurcation and in the internal carotid artery and, in the axial view, wall thickening and lumen stenosis can be visualized.

Figure 2: Carotid artery atherosclerosis. (A) Axial or cross-sectional view: the CCA is shown with atherosclerotic
plaque in yellow under a thin fibrous cap within the intima layer and modest lumen narrowing or arterial stenosis. (B) Longitudinal or transverse view: the CCA bifurcates approximately at the jawline into the ICA and the ECA, at
the BF point. The lumen–intima, and media–adventitia boundaries and calcified atherosclerotic plaque are readily
visible in both the axial and longitudinal views of the artery.
BF: Bifurcation; CCA: Common carotid artery; ECA: External carotid artery; ICA: Internal carotid artery.
Several imaging techniques have evolved to better understand the morphology of atherosclerosis and monitor its progression over time. Brightness-mode (B-mode) carotid US is a noninvasive, relatively inexpensive imaging technique that provides direct morphological measurements at the site of future cardiovascular events [18,51]. Doppler US is commonly used for evaluating carotid stenosis [52]. For research purposes, 3D US and carotid MRI are unique among carotid imaging methods in their ability to readily distinguish between different atherosclerotic tissue components and plaques. This provides a way to potentially assess carotid plaque vulnerability [20]. Distinct from carotid atherosclerosis imaging, imaging the heart using thoracic computed tomography (CT) for the detection and quantification of coronary artery calcifications has also emerged as a means to noninvasively evaluate atherosclerosis risk [33].
B-mode US
B-mode US is typically used to image carotid arteries for atherosclerotic burden, principally because it is noninvasive, relatively inexpensive and widely available in most clinical facilities. To obtain a 2D grayscale image, high-frequency US pulses are transmitted to internal tissues and their reflections (which themselves are dependent on the different acoustic impedances of the tissues) are converted to different pixel intensities [53,54]. A good example of this is provided in Figure 3 and shows the IMT measurement that is now recognized as robust and reliable for evaluating atherosclerotic burden [55]. It provides a 1D measurement of the mean distance between the lumen–intima and media–adventitia boundaries of the common carotid artery [54]. To standardize IMT measurements, guidelines were established by the Mannheim Intima–Media Thickness Consensus [56,57]. The 2D US images used to segment IMT are either generated by navigating a reconstructed 3D volume to visualize the desired plane [58], or by directly acquiring a 2D image using the US probe [23]. Importantly, IMT measurements do not incorporate a measure of carotid plaque, as users are encouraged to perform IMT segmentation only in regions of the common carotid artery that are void of plaque to ensure they capture an accurate representation of the intima–media layer [56,57].

Figure 3: Brightness mode and 3D ultrasound of the common carotid artery. (A) Conventional brightness-mode
ultrasound (US) common carotid artery image in the transverse plane and the generation of IMT measurement. (B) 3D US common carotid artery in the axial or cross-sectional plane with the generation of TPV and VWV US
measurements.
IMT: Intima–media thickness; TPV: Total plaque volume; VWV: Vessel wall volume.
Doppler US
Carotid Doppler US incorporates B-mode and Doppler US imaging [59]. The recorded B-mode 2D image provides structural and anatomical information about the vessel and surrounding tissues, while the Doppler component provides useful information about the blood flow in the vessel [60]. This offers a way to determine the velocity of blood in a vessel and provides information regarding the degree of stenosis in the artery [60]. Atherosclerotic stenosis and blood flow velocity are directly proportional; therefore, arteries with larger plaques present with a greater blood velocity [60]. Even though carotid disease is still diagnosed using conventional angiography, carotid Doppler US is suggested to be the most accurate noninvasive imaging modality in screening individuals for carotid artery stenosis [52,60].
3D US
Figure 4 shows a schematic for the methodology of 3D US volume acquisition. These scans differ slightly from 2D acquisition because the US probe is translated along the neck of the individual. This ‘linear translation’ [21] along the neck acquires a series of 2D images that are co-registered spatially into a 3D volume [54]. As shown in Figure 3, several measurements have been developed to date that utilize reconstructed 3D US volumes in order to monitor atherosclerotic disease progression. These measurements include the 2D total plaque area (TPA) measurement, and 3D total plaque volume (TPV) and vessel wall volume (VWV) measurements [61–64]. The TPA US measurement provides a 2D measurement that quantifies the area of a plaque along the longitudinal view of the artery. The user is required to outline the plaque as it appears in its largest dimension, which can be somewhat subjective. The segmentation can be performed on the US scanner by finding the plane of interest and freezing and magnifying the image [61] and the cursor is used to trace around the selected plaque [61]. The reconstructed 3D volume can also be used to isolate the longitudinal view of interest and perform the measurement by tracing the perimeter of the plaque using computer software. Previous research [61,65] has demonstrated that TPA is associated with serum cholesterol levels, hypertension myocardial infarction, risk of stroke and risk of death.

Figure 4: 3D ultrasound image acquisition. (A) Typical 3D ultrasound scanning procedure. The subject is supine with head turned to enable access to the right and/or left carotid arteries. The mechanical mover shown in the left panel holds the transducer in place and translates it up the neck. (B) Transducer acquiring a series of 2D images that are coregistered to generate a 3D volume. (C) 3D volume for the common carotid artery in the axial or transverse plane.
3D TPV and VWV measurements have been developed to monitor atherosclerotic disease progression, while providing useful information about the development of atherosclerotic plaques. The first technical development of TPV [62] used a manual segmentation approach, where the volume of the plaque was generated from the area of a series of axial slices. However, more recently, TPV has been generated using a semi-automated approach [66] and this has helped to improve speed and reproducibility of the measurements.
A 3D IMT measurement that includes plaque can be generated from a 3D US – the 3D US VWV [55]. 3D US VWV provides a circumferential wall thickness measurement, including plaque [55,67], and can be used to track changes over short time scales [68]. Recent research has shown that these measurements correlate well with age and sex [54]. US imaging measurements have been widely used to understand cardiovascular disease and patient outcomes [36,61], although it is difficult to distinguish between atherosclerotic plaque components.
Carotid MRI
MRI provides a way to distinguish between soft tissues, allowing for the evaluation of plaque composition and potentially, plaque vulnerability to rupture and thrombosis [69]. Plaque vulnerability is typically assessed by examining different characteristics such as the fibrous cap, lipid core and localized calcifications in the carotid arteries [20,47]. In particular, the thickness of the fibrous cap is of great interest, since rupturing of this component would expose the necrotic lipid core to the blood flow, which is believed to cause thromboembolic events; recent studies [70] have shown that carotid MRI findings correlate with histology and are sensitive in detecting thin and ruptured fibrous layers [71]. Other studies [72,73] have reported the use of a gadolinium-based contrast agents to obtain a higher contrast between atherosclerotic plaque characteristics and have found that the contrast between plaque structures can be enhanced even more.
Thoracic CT
As shown in Figure 5, thoracic CT can be used to reveal and quantify calcifications within the coronary arteries as a surrogate measurement of advanced coronary artery disease and atherosclerosis [33]. Such calcified lesions within the arterial wall are much denser than surrounding cardiovascular tissue and are visualized as regions of greater x-ray attenuation on thoracic CT scans. Commonly, a threshold of ≥130 HU is used to identify calcified lesions on thoracic CT based on the scoring method previously described by Agatston [74]. This approach has been the most widely used quantification method for coronary calcifications and studies have shown that Agatston scores correlate with future cardiovascular events [75,76]. The use of coronary artery calcifications has not been widely used, however, to evaluate the relationship between vascular and pulmonary disease.

Figure 5: Axial computed tomography view of chronic
obstructive pulmonary disease patients with coronary
calcifications. Yellow arrows point to coronary
calcifications, which are easily visible by increased x-ray
attenuation within cardiovascular tissues.
CT: Computed tomography.
Imaging COPD
COPD is characterized by chronic airflow limitation and systemic inflammation and is currently the fourth leading cause of death worldwide, affecting approximately 10% of the population over 40 years of age [77]. COPD is a heterogeneous disease comprised of airway inflammation, alveolar destruction (emphysema), mucociliary dysfunction, pulmonary hypertension and small airway remodeling [11,78]. Traditionally, COPD is diagnosed using the spirometry threshold of the forced expiratory volume in 1 s (FEV1) <70% of the forced vital capacity (FVC). However, it has been suggested that FEV1 and FVC are relatively insensitive to the pathophysiological changes that occur well before lung function declines [78]. Consequently, FEV1 and FVC alone do not sufficiently characterize lung disease onset, progression or response to treatment, especially early in the disease [79,80]. Moreover, spirometry provides only a global measurement of overall lung disease with no regional, structural or functional information to identify the diseased area or the underlying pathology. These drawbacks have provided the major motivation behind the development and optimization of sensitive and noninvasive pulmonary imaging modalities that can locate, characterize and quantify pathophysiological changes that cause lung function decline.
Pulmonary imaging offers several advantages for characterization of COPD:
• It is sensitive to early structural and functional changes in the lungs [81–85];
• It allows visualization of the pathophysiological processes contributing to airflow limitation [14,86];
• It provides regional information of which anatomical locations of the lung are affected by disease [14,87];
• Patients can potentially be stratified for treatment based on lung disease phenotype identified using pulmonary imaging [86,88–90].
Thoracic x-ray CT of COPD
The development of quantitative tools to measure airway dimensions and parenchyma structure using high-resolution CT have made it the pulmonary imaging modality of choice [13,14,90,91]. As previously mentioned, pulmonary function tests do not correlate well with morphological changes in the lung [11,79,80]. CT, however, is well suited to distinguish whether lung function decline is attributable to emphysema or airways disease. Thoracic CT images of pulmonary structure are based on tissue attenuation of x-rays in the lung parenchyma and surrounding vasculature. Therefore, high-resolution images of pulmonary structure can be acquired without the use of contrast agents.
Smoking-related emphysema is characterized by alveolar destruction, which leads to increased lung volume, decreased surface area for gas exchange and either localized or uniform emphysematous lesions to the lung parenchyma [78]. The emphysematous lesions have markedly reduced density, which can be identified by regions of lower x-ray attenuation values in Hounsfield units from the density frequency histogram taken from CT images [90]. One approach for quantifying the extent of emphysema has employed a threshold cut-off for voxels with attenuation values below a predetermined Hounsfield unit as emphysematous tissue [90]. CT attenuation thresholds have been used to identify emphysema at -910 [92], -950 [93], -960 and -970 HU [94]. However, -950 HU has emerged as the most common cut-off to distinguish between emphysematous and healthy lung tissue [93]. Another widelyused method for determining emphysema severity is with a ‘percentile cutoff ’ (e.g., the lowest 15th percentile) that identifies the percentage of emphysematous tissue based on the frequency distribution of attenuation values across a group of subjects [90,94,95]. Both techniques are considered acceptable for cross-sectional COPD studies. However, the Alpha-1 Foundation workshop committee recommended [96] that only the percentile cutoff approach be used for longitudinal studies since technical variations have less influence on these measurements [96]. Another technique for quantifying emphysema also incorporated attenuation cut-off values, but used a statistical approach to identify low attenuation clusters (LACs) [97,98]. Briefly, the size of an emphysematous lesion (connected voxels below a certain attenuation value) is plotted against the total number of ‘clusters’ of connected voxels on a log–log plot (cluster size on x-axis, number of clusters on y-axis). The slope of this relationship, which follows a power law, represents the size of the emphysematous lesion [99]. Typically, flatter curves with lower slope values represent larger emphysematous lesions.
Airways disease can be assessed using CT-derived measurements of airways dimensions. Airway remodeling in COPD is prominently caused by inflammation within the airway wall epithelium and mucous plugs in the airway lumen [78]. Therefore, CT measurements of airway wall area and lumen area are of interest for evaluating the severity of airways disease. The primary limitation of CT airway analysis lies within the limits of x-ray resolution and dose [90]. Previous work [100] has established that the major site of airflow limitation in COPD is in airways <2 mm in diameter. These airways, however, are difficult to visualize on CT [101]. Many different computational algorithms have been used to measure airways [102–105]; however, it remains unknown which algorithm provides the most useful airway data [96]. Figure 6 shows representative coronal CT images and CT-derived airway trees and LAC maps for two healthy (FEV1/FVC ≥70%) and two COPD subjects (FEV1/FVC <70%). Compared with the healthy subjects, the COPD patients have greater heterogeneity of attenuation values, which are reflected in the large LAC clusters corresponding to these low attenuation regions. These images are a good representation of how CT, along with quantification software, can be used to evaluate disease severity.

Figure 6: Thoracic x-ray computed tomography in healthy elderly subjects and patients with chronic obstructive
pulmonary disease. (A) Computed tomography coronal and axial centre slice scans. (B) Corresponding computed
tomography-derived volume rendered airway tree next to coregistered airway tree with LAC map for two healthy
subjects (S1 and S2) and two COPD subjects (S3 and S4).
COPD: Chronic obstructive pulmonary disease; LAC: Low attenuation cluster.
MRI of COPD
Until recently, pulmonary MRI has been challenging owing to the low proton (1H) density (and in contrast, high air density) within the lungs. Conventional MRI generates signal and tissue contrast based on the perturbation of 1H, which is bound to both water and fat in most tissues of the body. Distinct from other organs, the lungs have very low proton density, which results in low contrast and little-to-no morphological information on pulmonary 1H MRI [25]. This has motivated the development and optimization of MRI techniques that are able to visualize lung structure and function. Namely, hyperpolarized noble gas MRI and ultra-short echo time 1H MRI have emerged as promising methods to noninvasively image the lungs and have been used to study COPD.
Hyperpolarized noble gas MRI provides a way to visualize lung function by imaging ventilation within the lung. As shown in Figure 7, a breath-hold technique can be performed using hyperpolarized 3He or 129Xe gases [106] to generate images of ventilation within the lungs. These ‘static ventilation’ images provide functional information by visualizing gas distribution, and as shown in Figure 8, ventilation distribution in healthy subjects is homogeneous, with gas filling all regions within the lung [107]. In contrast, COPD patients have regions of signal void or ventilation defects, which represent areas of the lung that do not participate in ventilation [25]. To quantify hyperpolarized 3He and 129Xe MRI data, the volume of gas visualized in the images can be normalized to the patient’s thoracic cavity volume to generate a ventilation defect volume [108], a ventilation defect percent [109] and percent ventilation volume [83]. Although it is likely that ventilation defects represent disease, the exact etiology underlying them is not entirely clear. In COPD, these ventilation abnormalities may be due to airway disease, emphysema or a combination of both diseases. Another possibility is that these areas may be slow filling and are not ventilated during the breath-hold scan. In the future, uncovering the pathophysiology of noble gas ventilation defects in COPD will require the accurate registration of structural CT images with functional MRI, integrating other lung structural modalities such as optical coherence tomography [110] and comparing MRI data with histology [111]. Beyond functional imaging, noble gas MRI can also be used to probe lung microstructure by using diffusion-weighted MRI, which can characterize the dimensions of acinar ducts and alveoli, the main structures involved in gas exchange [12,112,113]. By sensitizing the MRI system to diffusion of the noble gas atoms, apparent diffusion coefficient (ADC) maps can be generated and quantified to assess lung microstructure [112]. In COPD, emphysema is associated with acinar duct enlargement and alveolar destruction [78]. These larger alveolar spaces in diseased subjects will generate higher ADC values on diffusion-weighted MRI scans compared with small, intact alveoli of a healthy volunteer [87,111] because the gas atoms have a larger distance per unit time to travel. This is represented in Figure 8 where the ADC maps display brighter colors as COPD/emphysema severity increases, representing an increase in ADC values and larger airspaces in these subjects. A limitation to diffusion-weighted MRI in noble gas imaging of the lungs is related to the ventilation patterns mentioned previously. ADC values can be extracted only for regions of the lung that participate in ventilation, therefore, in patients with high ventilation defect percent, the structure of the ventilation defect volume cannot be probed.

Figure 7: Conventional anatomical 1H MR and functional 3He and 129Xe MR images. (A) Anatomical 1H MRI, and (B) corresponding 3He (aqua-blue) and 129Xe (purple) MRI coregistered to anatomical MRI (grayscale) for a healthy
and COPD subject.
COPD: Chronic obstructive pulmonary disease.

Figure 8: 3He MRI ventilation and apparent diffusion coefficient maps. (A) Healthy elderly never-smoker. (B) Four
representative COPD subjects with Global initiative for Chronic Obstructive Lung Disease (GOLD) stages I–IV.
Grayscale 1H anatomical MRI is coregistered to aqua-blue ventilation pattern from 3He MRI. Corresponding ADC
maps generated from diffusion-weighted MRI using b = 1.6 s/cm2.
ADC: Apparent diffusion coefficient; COPD: Chronic obstructive pulmonary disease; SV: Static ventilation.
Independent of MRI methods that employ tracer gases to visualize lung structure and function, conventional 1H MRI using short echo times can be used to visualize pulmonary structure [12]. Such methods have been employed to try to reduce air–tissue interface artifacts [114], which are typically abundant on pulmonary MRI, allowing acquisition of images that can provide structural information by differentiating between regions of low and high proton density [115]. This has potentially useful applications to COPD because low proton-density regions may represent emphysematous lesions, whereas regions of high proton density could represent areas of other diseases or lung injuries such as edema [25,115].
Imaging relationships between lung disease & atherosclerosis
While cardiovascular and respiratory diseases are the first and third leading causes of death in the USA [116], both diseases have typically been evalufutureated as separate conditions. However, the last two decades have seen numerous studies providing imaging evidence that both diseases are related [1,2,5,6,39– 45,47–49,117–120]. These studies, summarized in Table 1, have established two important clinical findings: COPD patients have an increased burden of atherosclerosis in the form of carotid atherosclerosis and coronary artery plaque; and the relationship linking lung and heart diseases is complex and involves both structural and functional abnormalities to the lungs and vascular system.
Application of carotid US to lung & atherosclerosis studies
Carotid US semiautomated measurements of IMT make it well suited to be used in large-scale studies investigating atherosclerosis and lung disease. Studies using carotid US to investigate a relationship between atherosclerosis and lung disease started to emerge over a decade ago [36–38]. In one study [36], subjects from the British Regional Heart Study were evaluated and the investigators observed a cross-sectional relationship between carotid IMT and spirometry. Shortly after, a significant association between spirometry and Doppler US measurements of stenosis in an elderly population of Swedish men was reported [37]. Another study [38] used carotid US to examine carotid IMT and the development of carotid plaques in relation to peak expiratory flow (PEF) in an elderly cohort from France. Consistent with the two other studies, they found that reduced lung function (reduced PEF) was associated with increased atherosclerotic burden through elevated IMT and increased carotid plaque occurrence. Four years later, this area of research was revisited [3] in a large cohort recruited from the ARIC study. Using carotid US IMT and the ABI (i.e., the ratio of ankle to arm systolic blood pressure) in tandem with spirometry measurements, a cross-sectional association was observed between spirometry and IMT and ABI. This study invited future research on the coincident findings of lung disease and atherosclerosis using a number of imaging techniques. Subsequent work focused on the relationship of carotid US measurements of atherosclerosis and spirometry measurements of pulmonary function.
Several years later, a study [40] in 305 Japanese volunteers showed that COPD smokers had significantly greater IMT and plaque compared with smokers and nonsmokers without airflow limitation. Furthermore it was observed that FEV1 was independently associated with IMT after adjustment for age, BMI and blood pressure. The finding that IMT was elevated in patients with airflow limitation was replicated 2 years later [43] in a Korean study that showed greater IMT in COPD patients compared with non-COPD subjects. This group also observed a significant correlation between IMT and spirometry (FEV1, FEV1/FVC and FVC). There is evidence that this relationship may work in both directions, meaning that cardiovascular disease patients may have equally high risk of developing respiratory diseases as COPD patients are of developing cardiovascular conditions. Another research team obtained preoperative spirometry and carotid US measurements in a group of vascular surgery patients undergoing aortic or carotid artery surgeries and classified the patients based on severity of COPD [41]. They observed that subjects with spirometry evidence of airflow limitation had significantly greater IMT than non-COPD vascular surgery patients. In the 5-year follow-up period, nearly 30% of vascular surgery patients died, and after adjusting for confounders, elevated IMT was associated with increased total mortality. This work was in agreement with another investigation that evaluated [46] relationships between carotid plaque, FEV1 and VC along with total lung capacity, residual volume and diffusion capacity of the lung for carbon monoxide. The researchers observed that subjects with plaque had statistically significantly lower FEV1, VC and diffusion capacity of the lung for carbon monoxide and higher residual volume, but no significant difference in total lung capacity. This was the first study to probe pulmonary measurements beyond spirometry and PEF, and showed that these relationship were complex, with lung structure–function implications [46].
Application of carotid MRI to lung & atherosclerosis studies
Few studies have utilized carotid MRI to study lung and heart disease that is coincident in patients. One recent study [47] evaluated a subgroup from the Rotterdam cohort [121] using carotid MRI, carotid US and pulmonary function tests. The results were consistent with other studies, showing elevated carotid wall thickening in subjects with airflow limitation. However the carotid MRI data added valuable information about carotid plaque characteristics in COPD subjects that had not previously been reported. They showed that:
• The severity of stenosis measured using carotid MRI was greater in COPD patients;
• Subjects without COPD had higher incidence of plaque calcification than subjects with COPD;
• Carotid plaque in COPD patients were more likely to have a large lipid core, a recognized plaque component that is associated with cerebrovascular events [122].
These results were the first to associate carotid plaque characteristics with COPD cases and increased awareness that COPD is a risk factor for cardiovascular disease and importantly for debilitating ischemic events such as stroke.
Application of pulmonary imaging to lung & atherosclerosis studies
Thus far, pulmonary imaging has not played a large role in studies focused on the relationship between lung and heart disease in smokers. In Figure 9, we show the direct comparison of carotid 3D US TPV and IMT with hyperpolarized 3He MRI ventilation defect percent in a never- and two ex-smokers with normal pulmonary function and without airflow limitation from our own center. In a similar approach, a study from the Emphysema and Cancer Action Project [123] incorporated the use of thoracic CT to evaluate flow-mediated dilation of the brachial artery in a group of ex-smokers with early or very mild COPD.

Figure 9: 3He MRI ventilation maps and corresponding carotid 3D ultrasound images for a never-smoker and two ex-smokers. (A) 3He MRI static-ventilation images for a never-smoker and two ex-smokers. (B) Axial view of the carotid 3D US images for the never- and ex-smokers. The green contour represents the carotid lumen and the yellow contour encircles carotid plaque. (C) Longitudinal carotid 3D US view of the never- and ex-smokers. The carotid lumen is visualized by yellow and red contours. Compared with the never-smoker, the ex-smokers have more heterogeneous 3He ventilation throughout the lungs and greater carotid plaque volume. IMT: Intima–media thickness; TPV: Total plaque volume; US: Ultrasound; VDP: Ventilation defect percentage.
The results showed that low FEV1 and greater indices of emphysema was associated with attenuated flow-mediated dilation, suggesting that vascular endothelial function is influenced by lung function and structure. Other findings from the MESA lung study [2,124] also used thoracic CT to measure emphysema in subjects without cardiovascular disease, and evaluated subclinical atherosclerosis with carotid US and cardiac CT to determine vascular phenotypes. Inverse associations were observed between spirometry and IMT, similar to previously described [3,36,40,41,43], but novel insights with respect to the relationship between emphysema and vascular disease were also provided. Although whole lung emphysema percent was not related to IMT, upper-lobe emphysema was significantly related with internal carotid IMT. Other studies [42,49], have furthered our understanding of this relationship between emphysema and vascular disease by showing that emphysema percentage is related not only to carotid atherosclerosis, but also to calcification scores in the aorta, coronary arteries, as well as aortic and mitral annuli. Collectively, these studies provide strong evidence of a relationship between atherosclerosis and emphysema and support the notion of complex, heterogeneous vascular and lung disease in ex-smokers.
Application of thoracic & vascular imaging to evaluate pulmonary & cardiovascular disease
The development of cardiovascular imaging modalities that can provide surrogate measurements of vascular disease has played an important role in characterizing lung–vascular disease phenotypes. In 2003, real-time MRI of aortic flow [125] was used to quantify left ventricle stroke volume and cardiac performance in healthy control and COPD subjects [39]. The investigators observed that the COPD subjects had decreased cardiac performance compared with healthy volunteers and that the nonuniform breathing patterns in the COPD patients resulted in decreased stroke volume. Taken together, these results provided evidence that the abnormal breathing patterns and shallow respiration that may accompany COPD may be related to cardiovascular complications. Thoracic CT has also been used to provide a way to measure vascular changes and coronary artery calcification in patients with lung disease. Three studies in particular [44,45,48], have used thoracic CT to investigate the relationship between aortic calcification and pulmonary physiology using pulmonary function tests. Importantly, associations between the severity of aortic calcification were reported with lung function and morphologic parameters. Interestingly, this work [45] showed that pulmonary vascular alterations were correlated with aortic calcification, whereas other studies [44,48] showed associations between aortic calcifications and FEV1. A number of studies [126–128] have also investigated vascular dysfunction and arterial stiffness in COPD patients using pulse wave velocity, a functional measurement of vascular tone. These findings showed that COPD patients exhibit increased arterial stiffness [126] and furthermore, that the degree of arterial stiffness was related to the severity of airflow limitation [127,128].
Conclusion & future perspective
A number of recent studies have demonstrated the value of emerging and well-established vascular and pulmonary imaging approaches for furthering our understanding on the direct relationship between advanced lung and vascular disease in smokers and ex-smokers that cannot be explained on the basis of tobacco-smoking alone. In particular, carotid US measurements are valuable tools for the evaluation of cardio- and cerebro-vascular risk.
Beyond the evaluation and screening for inflammatory markers, the incorporation of carotid US and perhaps other atherosclerosis imaging methods into the clinical workflow and treatment plan for COPD may help identify significant peripheral, cardiovascular or cerebrovascular atherosclerosis. Similarly, the acquisition of spirometry and other pulmonary function measurements in ex-smokers with cardiovascular disease or vascular risk factors would help detect airflow limitation that might otherwise go undiagnosed [8,43]. In mild COPD especially, cardiovascular events are a major source of morbidity and mortality [8], so it is possible that advanced imaging of both diseases may help treatment decisions that improve outcomes overall and cardiovascular events in particular. Regardless, it is important to keep in mind that the underlying mechanisms linking COPD and atherosclerosis are still not clear, and as recently described [9,10] systemic inflammation may only provide a partial explanation for the links between COPD and advanced progressive atherosclerosis.
The incorporation of pulmonary functional imaging into vascular disease studies will provide new insight on the role of pulmonary morphological changes in the pathophysiology of vascular disease. Such studies will build on previous findings of emphysema in subjects with subclinical atherosclerosis [2,42,49]. In addition, the notion of different vascular and lung disease phenotypes [86,88,89,129–132] also holds promise for this area of research. In the future, a large-scale prospective study should be executed to monitor longitudinal changes in vascular and pulmonary conditions using sophisticated imaging techniques. Longitudinal monitoring of vascular and pulmonary disease in exsmokers will provide more insight onto the genesis and progression of vascular disease changes in COPD patients and using imaging, there is potential to monitor treatment effects and phenotype relationships. At present, there is some evidence supporting a mechanistic link between pulmonary and vascular disease that is not explained by tobacco smoking alone; however, the direct mechanisms that potentially accelerate atherosclerosis in ex-smokers with COPD have not been firmly established.
Major advances in noninvasive quantitative pulmonary and vascular imaging tools have advanced the development and validation of surrogate or intermediate end points of these chronic disorders. Based on this foundation of previous research, there is a clear role for novel vascular and pulmonary imaging methods to identify the direct potential links in future studies.
Acknowledgements
The authors would like to thank A Fenster, DG McCormack, JD Spence and DG Hackam for valuable conversations.
Financial & competing interests disclosures
G Parraga paid US$100,000 annually (2009–2011) for the use of an onsite hyperpolarized 3He gas polarizer (Helispin, General Electric Health Care, Durham, NC, USA) and US$60,000 for the use of the XeBox-E10 (Xemed LLC, Durham, NH, USA) system for the period of 6–29 September 2011. G Parraga gratefully acknowledges salary support from a Canadian Institutes of Health Research (CIHR) New Investigator Award as well as ongoing research funding from CIHR Operating grants MOP# 97748 and MOP# 106437, and Team Grant CIF# 97687. D Pike gratefully acknowledges funding support from a CIHR Strategic Training Program for Vascular Research. The authors have no other relevant affiliations or financial involvement with any organization or entity with a financial interest in or financial conflict with the subject matter or materials discussed in the manuscript apart from those disclosed.
No writing assistance was utilized in the production of this manuscript.
References
Papers of special note have been highlighted as:
• of interest
• • of considerable interest
- Anthonisen NR, Skeans MA, Wise RA et al. The effects of a smoking cessation intervention on 14.5-year mortality: a randomized clinical trial. Ann. Intern. Med. 142(4), 233–239 (2005).
- Barr RG, Ahmed FS, Carr JJ et al. Subclinical atherosclerosis, airflow obstruction and emphysema: the MESA lung study. Eur. Respir. J. 39(4), 846–854 (2012).
- Schroeder EB, Welch VL, Evans GW, Heiss G. Impaired lung function and subclinical atherosclerosis. The ARIC study. Atherosclerosis 180(2), 367–373 (2005).
- Sin DD, Man SF. Chronic obstructive pulmonary disease as a risk factor for cardiovascular morbidity and mortality. Proc. Am. Thorac. Soc. 2(1), 8–11 (2005).
- Hansell AL, Walk JA, Soriano JB. What do chronic obstructive pulmonary disease patients die from? A multiple cause coding analysis. Eur. Respir. J. 22(5), 809–814 (2003).
- Soriano JB, Visick GT, Muellerova H, Payvandi N, Hansell AL. Patterns of comorbidities in newly diagnosed COPD and asthma in primary care. Chest 128(4), 2099–2107 (2005).
- Ghoorah K, De Soyza A, Kunadian V. Increased cardiovascular risk in patients with chronic obstructive pulmonary disease and the potential mechanisms linking the two conditions: a review. Cardiol. Rev. 21(4), 196–202 (2013).
- van Eeden S, Leipsic J, Paul Man SF, Sin DD. The relationship between lung inflammation and cardiovascular disease. Am. J. Respir. Crit. Care Med. 186(1), 11–16 (2012).
- Agusti A, Edwards LD, Rennard SI et al. Persistent systemic inflammation is associated with poor clinical outcomes in COPD: a novel phenotype. PLoS ONE 7(5), e37483 (2012).
- Vanfleteren LE, Spruit MA, Groenen M et al. Clusters of comorbidities based on validated objective measurements and systemic inflammation in patients with chronic obstructive pulmonary disease. Am. J. Respir. Crit. Care Med. 187(7), 728–735 (2013).
- Vestbo J, Anderson W, Coxson HO et al. Evaluation of COPD Longitudinally to Identify Predictive Surrogate End Points (ECLIPSE). Eur. Respir. J. 31(4), 869–873 (2008).
- Fain S, Schiebler ML, McCormack DG, Parraga G. Imaging of lung function using hyperpolarized helium-3 magnetic resonance imaging: review of current and emerging translational methods and applications. J. Magn. Reson. Imaging 32(6), 1398–1408 (2010).
- Coxson HO, Rogers RM. Quantitative computed tomography of chronic obstructive pulmonary disease. Acad. Radiol. 12(11), 1457–1463 (2005).
- Mets OM, De Jong PA, Van Ginneken B, Gietema HA, Lammers JW. Quantitative computed tomography in COPD: possibilities and limitations. Lung 190(2), 133–145 (2012).
- Collaboration ABI, Fowkes F, Murray G et al. Ankle brachial index combined with Framingham risk score to predict cardiovascular events and mortality. JAMA 300(2), 197–208 (2008).
- Khan TH, Farooqui FA, Niazi K. Critical review of the ankle brachial index. Curr. Cardiol. Rev. 4(2), 101–106 (2008).
- Polak JF, Pencina MJ, Pencina KM, O’Donnell CJ, Wolf PA, D’Agostino RB Sr. Carotid-wall intima–media thickness and cardiovascular events. N. Engl. J. Med. 365(3), 213–221 (2011).
- Stein JH, Korcarz CE, Hurst RT et al. Use of carotid ultrasound to identify subclinical vascular disease and evaluate cardiovascular disease risk: a consensus statement from the American Society of Echocardiography Carotid Intima–Media Thickness Task Force. Endorsed by the Society for Vascular Medicine. J. Am. Soc. Echocardiogr. 21(2), 93–111; quiz 189–190 (2008).
- Wannarong T, Parraga G, Buchanan D et al. Progression of carotid plaque volume predicts cardiovascular events. Stroke 44(7), 1859–1865 (2013).
- Toussaint JF, Lamuraglia GM, Southern JF, Fuster V, Kantor HL. Magnetic resonance images lipid, fibrous, calcified, hemorrhagic, and thrombotic components of human atherosclerosis in vivo. Circulation 94(5), 932–938 (1996).
- Fenster A, Parraga G, Bax J. Three-dimensional ultrasound scanning. Interface Focus 1(4), 503–519 (2011).
- Fenster A, Landry A, Downey DB, Hegele RA, Spence JD. 3D ultrasound imaging of the carotid arteries. Curr. Drug Targets Cardiovasc. Haematol. Disord. 4(2), 161–175 (2004).
- Mallett C, House AA, Spence JD, Fenster A, Parraga G. Longitudinal ultrasound evaluation of carotid atherosclerosis in one, two and three dimensions. Ultrasound Med. Biol. 35(3), 367–375 (2009).
- Grant EG, Benson CB, Moneta GL et al. Carotid artery stenosis: gray-scale and Doppler US diagnosis – Society of Radiologists in Ultrasound Consensus Conference. Radiology 229(2), 340–346 (2003).
- Simon BA, Kaczka DW, Bankier AA, Parraga G. What can computed tomography and magnetic resonance imaging tell us about ventilation? J. Appl. Physiol. 113(4), 647–657 (2012).
- Sin DD, Anthonisen NR, Soriano JB, Agusti AG. Mortality in COPD: role of comorbidities. Eur. Respir. J. 28(6), 1245–1257 (2006).
- Man SF, Van Eeden S, Sin DD. Vascular risk in chronic obstructive pulmonary disease: role of inflammation and other mediators. Canadian J. Cardiol. 28(6), 653–661 (2012).
- Sin DD, Wu L, Man SF. The relationship between reduced lung function and cardiovascular mortality: a populationbased study and a systematic review of the literature. Chest 127(6), 1952–1959 (2005).
- Maclay JD, McAllister DA, Macnee W. Cardiovascular risk in chronic obstructive pulmonary disease. Respirology 12(5), 634–641 (2007).
- Hartung MP, Grist TM, Francois CJ. Magnetic resonance angiography: current status and future directions. J. Cardiovasc. Magn. Reson. 13, 19 (2011).
- Miller JM, Rochitte CE, Dewey M et al. Diagnostic performance of coronary angiography by 64-row CT. N. Engl. J. Med. 359(22), 2324–2336 (2008).
- Schuleri KH, George RT, Lardo AC. Applications of cardiac multidetector CT beyond coronary angiography. Nat. Rev. Cardiol. 6(11), 699–710 (2009).
- Schoepf UJ, Becker CR, Ohnesorge BM, Yucel EK. CT of coronary artery disease. Radiology 232(1), 18–37 (2004).
- Berry C, L’Allier PL, Gregoire J et al. Comparison of intravascular ultrasound and quantitative coronary angiography for the assessment of coronary artery disease progression. Circulation 115(14), 1851–1857 (2007).
- Kaneda H, Ako J, Terashima M. Intravascular ultrasound imaging for assessing regression and progression in coronary artery disease. Am. J. Cardiol. 106(12), 1735–1746 (2010).
- Ebrahim S, Papacosta O, Whincup P et al. Carotid plaque, intima media thickness, cardiovascular risk factors, and prevalent cardiovascular disease in men and women: the British Regional Heart Study. Stroke 30(4), 841–850 (1999).
- Engström G, Hedblad B, Valind S, Janzon L. Asymptomatic leg and carotid atherosclerosis in smokers is related to degree of ventilatory capacity: longitudinal and cross-sectional results from ‘Men born in 1914’, Sweden. Atherosclerosis 155(1), 237–243 (2001).
- Zureik M, Kauffmann F, Touboul PJ, Courbon D, Ducimetiere P. Association between peak expiratory flow and the development of carotid atherosclerotic plaques. Arch. Intern. Med. 161(13), 1669–1676 (2001).
- van den Hout RJ, Lamb HJ, Van Den Aardweg JG et al. Real-time MR imaging of aortic flow: influence of breathing on left ventricular stroke volume in chronic obstructive pulmonary disease. Radiology 229(2), 513–519 (2003).
- Iwamoto H, Yokoyama A, Kitahara Y et al. Airflow limitation in smokers is associated with subclinical atherosclerosis. Am. J. Respir. Crit. Care Med. 179(1), 35–40 (2009).
- van Gestel YR, Flu WJ, Van Kuijk JP et al. Association of COPD with carotid wall intima–media thickness in vascular surgery patients. Respir. Med. 104(5), 712–716 (2010).
- Dransfield MT, Huang F, Nath H, Singh SP, Bailey WC, Washko GR. CT emphysema predicts thoracic aortic calcification in smokers with and without COPD. COPD 7(6), 404–410 (2010).
- Kim SJ, Yoon DW, Lee EJ et al. Carotid atherosclerosis in patients with untreated chronic obstructive pulmonary disease. Int. J. Tuberc. Lung Dis. 15(9), 1265–1270, i (2011).
- McAsllister DA, Macnee W, Duprez D et al. Pulmonary function is associated with distal aortic calcium, not proximal aortic distensibility. MESA lung study. COPD 8(2), 71–78 (2011).
- Matsuoka S, Yamashiro T, Diaz A et al. The relationship between small pulmonary vascular alteration and aortic atherosclerosis in chronic obstructive pulmonary disease: quantitative CT analysis. Acad. Radiol. 18(1), 40–46 (2011).
- Frantz S, Nihlen U, Dencker M, Engstrom G, Lofdahl CG, Wollmer P. Atherosclerotic plaques in the internal carotid artery and associations with lung function assessed by different methods. Clin. Physiol. Funct. Imaging 32(2), 120–125 (2012).
- Lahousse L, Van Den Bouwhuijsen QJ, Loth DW et al. Chronic obstructive pulmonary disease and lipid core carotid artery plaques in the elderly: the Rotterdam study. Am. J. Respir. Crit. Care Med. 187(1), 58–64 (2013).
- Rasmussen T, Kober L, Pedersen JH et al. Relationship between chronic obstructive pulmonary disease and subclinical coronary artery disease in long-term smokers. Eur. Heart J. Cardiovasc. Imaging 14(12),1159–1166 (2013).
- Chae EJ, Seo JB, Oh YM, Lee JS, Jung Y, Lee SD. Severity of systemic calcified atherosclerosis is associated with airflow limitation and emphysema. J. Comput. Assist. Tomogr. 37(5), 743–749 (2013).
- Ross R. The pathogenesis of atherosclerosis: a perspective for the 1990s. Nature 362(6423), 801–809 (1993).
- Bots ML, Hoes AW, Hofman A, Witteman JC, Grobbee DE. Cross-sectionally assessed carotid intima–media thickness relates to long-term risk of stroke, coronary heart disease and death as estimated by available risk functions. J. Intern. Med. 245(3), 269–276 (1999).
- Carpenter JP, Lexa FJ, Davis JT. Determination of sixty percent or greater carotid artery stenosis by duplex Doppler ultrasonography. J. Vasc. Surg. 22(6), 697–703; discussion 703–695 (1995).
- Chan V, Perlas A. Basics of ultrasound imaging. In: Atlas of Ultrasound-Guided Procedures in Interventional Pain Management. Narouze SN (Ed.). Springer, Berlin, Germany, 13–19 (2011).
- Buchanan DN, Lindenmaier T, Mckay S et al. The relationship of carotid three-dimensional ultrasound vessel wall volume with age and sex: comparison to carotid intima–media thickness. Ultrasound Med. Biol. 38(7), 1145–1153 (2012).
- Egger M, Spence JD, Fenster A, Parraga G. Validation of 3D ultrasound vessel wall volume: an imaging phenotype of carotid atherosclerosis. Ultrasound Med. Biol. 33(6), 905–914 (2007).
- Touboul PJ, Hennerici MG, Meairs S et al. Mannheim intima–media thickness consensus. Cerebrovasc. Dis. 18(4), 346–349 (2004).
- Touboul PJ, Hennerici MG, Meairs S et al. Mannheim carotid intima–media thickness consensus (2004-2006). An update on behalf of the Advisory Board of the 3rd and 4th Watching the Risk Symposium, 13th and 15th European Stroke Conferences, Mannheim, Germany, 2004, and Brussels, Belgium, 2006. Cerebrovasc. Dis. 23(1), 75–80 (2007).
- Shai I, Spence JD, Schwarzfuchs D et al. Dietary intervention to reverse carotid atherosclerosis. Circulation 121(10), 1200–1208 (2010).
- Schäberle W. Ultrasonography in Vascular Diagnosis: a Therapy-Oriented Textbook and Atlas. Springer, Berlin, Germany (2010).
- Byrnes KR, Ross CB. The current role of carotid duplex ultrasonography in the management of carotid atherosclerosis: foundations and advances. Int. J. Vasc. Med. 2012, 187872 (2012).
- Spence JD, Eliasziw M, Dicicco M, Hackam DG, Galil R, Lohmann T. Carotid plaque area: a tool for targeting and evaluating vascular preventive therapy. Stroke 33(12), 2916–2922 (2002).
- Landry A, Spence JD, Fenster A. Measurement of carotid plaque volume by 3-dimensional ultrasound. Stroke 35(4), 864–869 (2004).
- Landry A, Spence JD, Fenster A. Quantification of carotid plaque volume measurements using 3D ultrasound imaging. Ultrasound Med. Biol. 31(6), 751–762 (2005).
- Landry A, Fenster A. Theoretical and experimental quantification of carotid plaque volume measurements made by three-dimensional ultrasound using test phantoms. Med. Phys. 29(10), 2319–2327 (2002).
- Barnett PA, Spence JD, Manuck SB, Jennings JR. Psychological stress and the progression of carotid artery disease. J. Hypertens. 15(1), 49–55 (1997).
- Buchanan D, Gyacskov I, Ukwatta E, Lindenmaier T, Fenster A, Parraga G. Semi-automated segmentation of carotid artery total plaque volume from three dimensional ultrasound carotid imaging. Med. Imaging 8317, 83170I (2012).
- Ukwatta E, Awad J, Ward A et al. Three-dimensional ultrasound of carotid atherosclerosis: Semiautomated segmentation using a level set-based method. Med. Phys. 38, 2479 (2011).
- Krasinski A, Chiu B, Spence JD, Fenster A, Parraga G. Threedimensional ultrasound quantification of intensive statin treatment of carotid atherosclerosis. Ultrasound Med. Biol. 35(11), 1763–1772 (2009).
- Yuan C, Oikawa M, Miller Z, Hatsukami T. MRI of carotid atherosclerosis. J. Nucl. Cardiol. 15(2), 266–275 (2008).
- Hatsukami TS, Ross R, Polissar NL, Yuan C. Visualization of fibrous cap thickness and rupture in human atherosclerotic carotid plaque in vivo with high-resolution magnetic resonance imaging. Circulation 102(9), 959–964 (2000).
- Mitsumori LM, Hatsukami TS, Ferguson MS, Kerwin WS, Cai J, Yuan C. In vivo accuracy of multisequence MR imaging for identifying unstable fibrous caps in advanced human carotid plaques. J. Magn. Reson. Imaging 17(4), 410–420 (2003).
- Yuan C, Kerwin WS, Ferguson MS et al. Contrast-enhanced high resolution MRI for atherosclerotic carotid artery tissue characterization. J. Magn. Reson. Imaging 15(1), 62–67 (2002).
- Wasserman BA, Smith WI, Trout HH, Cannon RO, Balaban RS, Arai AE. Carotid artery atherosclerosis: in vivo morphologic characterization with gadolinium-enhanced double-oblique MR imaging – initial results. Radiology 223(2), 566–573 (2002).
- Agatston AS, Janowitz WR, Hildner FJ, Zusmer NR, Viamonte M Jr, Detrano R. Quantification of coronary artery calcium using ultrafast computed tomography. J. Am. Coll. Cardiol. 15(4), 827–832 (1990).
- Folsom AR, Kronmal RA, Detrano RC et al. Coronary artery calcification compared with carotid intima–media thickness in prediction of cardiovascular disease incidence: the Multi-Ethnic Study of Atherosclerosis (MESA). Arch. Intern. Med. 168(12), 1333 (2008).
- Becker A, Leber AW, Becker C et al. Predictive value of coronary calcifications for future cardiac events in asymptomatic patients with diabetes mellitus: a prospective study in 716 patients over 8 years. BMC Cardiovasc. Disord. 8, 27 (2008).
- Buist AS, McBurnie MA, Vollmer WM et al. International variation in the prevalence of COPD (the BOLD Study): a population-based prevalence study. Lancet 370(9589), 741–750 (2007).
- Hogg JC. Pathophysiology of airflow limitation in chronic obstructive pulmonary disease. Lancet 364(9435), 709–721 (2004).
- Franciosi LG, Page CP, Celli BR et al. Markers of disease severity in chronic obstructive pulmonary disease. Pulm. Pharmacol. Ther. 19(3), 189–199 (2006).
- Gelb AF, Hogg JC, Muller NL et al. Contribution of emphysema and small airways in COPD. Chest 109(2), 353–359 (1996).
- Wang CMJPI, De Lange E, Altes TA. Elevated short-time-scale hyperpolarized helium-3 diffusion in secondhand smokers. Presented at: International Society of Magnetic Resonance in Medicine Proceedings 2012. Melbourne, Australia, 5–11 May 2012.
- Fain SB, Panth SR, Evans MD et al. Early emphysematous changes in asymptomatic smokers: detection with 3He MR imaging. Radiology 239(3), 875–883 (2006).
- Woodhouse N, Wild JM, Paley MN et al. Combined helium-3/proton magnetic resonance imaging measurement of ventilated lung volumes in smokers compared to never-smokers. J. Magn. Reson. Imaging 21(4), 365–369 (2005).
- Swift AJ, Wild JM, Fichele S et al. Emphysematous changes and normal variation in smokers and COPD patients using diffusion 3He MRI. Eur. J. Radiol. 54(3), 352–358 (2005).
- Irion KL, Marchiori E, Hochhegger B et al. CT quantification of emphysema in young subjects with no recognizable chest disease. Am. J. Roentgenol. 192(3), W90–W96 (2009).
- Galban CJ, Han MK, Boes JL et al. Computed tomography-based biomarker provides unique signature for diagnosis of COPD phenotypes and disease progression. Nat. Med. 18(11), 1711–1715 (2012).
- Kirby M, Heydarian M, Wheatley A, McCormack DG, Parraga G. Evaluating bronchodilator effects in chronic obstructive pulmonary disease using diffusion-weighted hyperpolarized helium-3 magnetic resonance imaging. J. Appl. Physiol. 112(4), 651–657 (2012).
- Tulek B, Kivrak AS, Ozbek S, Kanat F, Suerdem M. Phenotyping of chronic obstructive pulmonary disease using the modified Bhalla scoring system for highresolution computed tomography. Canadian Respir. J. 20(2), 91–96 (2013).
- Coxson HO, Eastwood PR, Williamson JP, Sin DD. Phenotyping airway disease with optical coherence tomography. Respirology 16(1), 34–43 (2011).
- Coxson HO, Mayo J, Lam S, Santyr G, Parraga G, Sin DD. New and current clinical imaging techniques to study chronic obstructive pulmonary disease. Am. J. Respir. Crit. Care Med. 180(7), 588–597 (2009).
- Matsuoka S, Yamashiro T, Washko GR, Kurihara Y, Nakajima Y, Hatabu H. Quantitative CT assessment of chronic obstructive pulmonary disease. Radiographics 30(1), 55–66 (2010).
- Muller NL, Staples CA, Miller RR, Abboud RT: ‘Density mask’. An objective method to quantitate emphysema using computed tomography. Chest 94(4), 782–787 (1988).
- Gevenois PA, De Vuyst P, De Maertelaer V et al. Comparison of computed density and microscopic morphometry in pulmonary emphysema. Am. J. Respir. Crit. Care Med. 154(1), 187–192 (1996).
- Madani A, Zanen J, De Maertelaer V, Gevenois PA. Pulmonary emphysema: objective quantification at multi-detector row CT–comparison with macroscopic and microscopic morphometry. Radiology 238(3), 1036–1043 (2006).
- Dirksen A, Piitulainen E, Parr DG et al. Exploring the role of CT densitometry: a randomised study of augmentation therapy in alpha1-antitrypsin deficiency. Eur. Respir. J. 33(6), 1345–1353 (2009).
- Coxson HO: Quantitative chest tomography in COPD research: Chairman’s summary. Proc. Am. Thorac. Soc. 5(9), 874–877 (2008).
- Mishima M, Hirai T, Itoh H et al. Complexity of terminal airspace geometry assessed by lung computed tomography in normal subjects and patients with chronic obstructive pulmonary disease. Proc. Natl Acad. Sci. USA 96(16), 8829–8834 (1999).
- Coxson HO, Whittall KP, Nakano Y et al. Selection of patients for lung volume reduction surgery using a power law analysis of the computed tomographic scan. Thorax 58(6), 510–514 (2003).
- Gietema HA, Muller NL, Fauerbach PV et al. Quantifying the extent of emphysema: factors associated with radiologists’ estimations and quantitative indices of emphysema severity using the ECLIPSE cohort. Acad. Radiol. 18(6), 661–671 (2011).
- Hogg JC, Chu F, Utokaparch S et al. The nature of smallairway obstruction in chronic obstructive pulmonary disease. N. Engl. J. Med. 350(26), 2645–2653 (2004).
- Lutey BA, Conradi SH, Atkinson JJ et al. Accurate measurement of small airways on low-dose thoracic CT scans in smokers. Chest 143(5), 1321–1329 (2013).
- Nakano Y, Muro S, Sakai H et al. Computed tomographic measurements of airway dimensions and emphysema in smokers. Correlation with lung function. Am. J. Respir. Crit. Care Med. 162(3 Pt 1), 1102–1108 (2000).
- King GG, Muller NL, Whittall KP, Xiang QS, Pare PD. An analysis algorithm for measuring airway lumen and wall areas from high-resolution computed tomographic data. Am. J. Respir. Crit. Care Med. 161(2 Pt 1), 574–580 (2000).
- Reinhardt JM, D’Souza ND, Hoffman EA. Accurate measurement of intrathoracic airways. IEEE Trans. Med. Imaging 16(6), 820–827 (1997).
- Saba OI, Hoffman EA, Reinhardt JM. Maximizing quantitative accuracy of lung airway lumen and wall measures obtained from X-ray CT imaging. J. Appl. Physiol. 95(3), 1063–1075 (2003).
- Albert MS, Cates GD, Driehuys B et al. Biological magnetic resonance imaging using laser-polarized 129Xe. Nature 370(6486), 199–201 (1994).
- Kirby M, Svenningsen S, Owrangi A et al. Hyperpolarized 3He and 129Xe MR imaging in healthy volunteers and patients with chronic obstructive pulmonary disease. Radiology 265(2), 600–610 (2012).
- Parraga G, Mathew L, Etemad-Rezai R, McCormack DG, Santyr GE. Hyperpolarized 3He magnetic resonance imaging of ventilation defects in healthy elderly volunteers: initial findings at 3.0 Tesla. Acad. Radiol. 15(6), 776–785 (2008).
- Mathew L, Evans A, Ouriadov A et al. Hyperpolarized 3He magnetic resonance imaging of chronic obstructive pulmonary disease: reproducibility at 3.0 tesla. Acad. Radiol. 15(10), 1298–1311 (2008).
- Coxson HO, Quiney B, Sin DD et al. Airway wall thickness assessed using computed tomography and optical coherence tomography. Am. J. Respir. Crit. Care Med. 177(11), 1201–1206 (2008).
- Woods JC, Choong CK, Yablonskiy DA et al. Hyperpolarized 3He diffusion MRI and histology in pulmonary emphysema. Magn. Reson. Med. 56(6), 1293–1300 (2006).
- Yablonskiy DA, Sukstanskii AL, Woods JC et al. Quantification of lung microstructure with hyperpolarized 3He diffusion MRI. J. Appl. Physiol. 107(4), 1258–1265 (2009).
- Saam BT, Yablonskiy DA, Kodibagkar VD et al. MR imaging of diffusion of (3)He gas in healthy and diseased lungs. Magn. Reson. Med. 44(2), 174–179 (2000).
- Edelman RR, Hatabu H, Tadamura E, Li W, Prasad PV. Noninvasive assessment of regional ventilation in the human lung using oxygen-enhanced magnetic resonance imaging. Nat. Med. 2(11), 1236–1239 (1996).
- Ohno Y, Koyama H, Nogami M et al. Dynamic oxygenenhanced MRI versus quantitative CT: pulmonary functional loss assessment and clinical stage classification of smokingrelated COPD. Am. J. Roentgenol. 190(2), W93–W99 (2008).
- Minino AM, Murphy SL, Xu J, Kochanek KD. Deaths: final data for 2008. National Vital Statistics Reports: from the Centers for Disease Control and Prevention, National Center for Health Statistics. National Vital Statistics System 59(10), 1–126 (2011).
- Celli BR, Cote CG, Marin JM et al. The body-mass index, airflow obstruction, dyspnea, and exercise capacity index in chronic obstructive pulmonary disease. N. Engl. J. Med. 350(10), 1005–1012 (2004).
- Zvezdin B, Milutinov S, Kojicic M et al. A postmortem analysis of major causes of early death in patients hospitalized with COPD exacerbation. Chest 136(2), 376–380 (2009).
- Sidney S, Sorel M, Quesenberry CP Jr, Deluise C, Lanes S, Eisner MD. COPD and incident cardiovascular disease hospitalizations and mortality: Kaiser Permanente Medical Care Program. Chest 128(4), 2068–2075 (2005).
- Wells JM, Washko GR, Han MK et al. Pulmonary arterial enlargement and acute exacerbations of COPD. N. Engl. J. Med. 367(10), 913–921 (2012).
- Hofman A, Van Duijn CM, Franco OH et al. The Rotterdam Study: 2012 objectives and design update. Eur. J. Epidemiol. 26(8), 657–686 (2011).
- Takaya N, Yuan C, Chu B et al. Association between carotid plaque characteristics and subsequent ischemic cerebrovascular events: a prospective assessment with MRI – initial results. Stroke 37(3), 818–823 (2006).
- Barr RG, Mesia-Vela S, Austin JH et al. Impaired flowmediated dilation is associated with low pulmonary function and emphysema in ex-smokers: the Emphysema and Cancer Action Project (EMCAP) study. Am. J. Respir. Crit. Care Med. 176(12), 1200–1207 (2007).
- Bild DE, Bluemke DA, Burke GL et al. Multi-ethnic study of atherosclerosis: objectives and design. Am. J. Epidemiol. 156(9), 871–881 (2002).
- Eichenberger AC, Schwitter J, McKinnon GC, Debatin JF, Von Schulthess GK. Phase-contrast echo-planar MR imaging: real-time quantification of flow and velocity patterns in the thoracic vessels induced by Valsalva’s maneuver. J. Magn. Reson. Imaging 5(6), 648–655 (1995).
- Maclay JD, McAllister DA, Mills NL et al. Vascular dysfunction in chronic obstructive pulmonary disease. Am. J. Respir. Crit. Care Med. 180(6), 513–520 (2009).
- Cinarka H, Kayhan S, Gumus A et al. Arterial stiffness measured by carotid femoral pulse wave velocity is associated with disease severity in chronic obstructive pulmonary disease. Respir. Care doi:10.4187/respcare.02621 (2013) (Epub ahead of print).
- Sabit R, Bolton CE, Edwards PH et al. Arterial stiffness and osteoporosis in chronic obstructive pulmonary disease. Am. J. Respir. Crit. Care Med. 175(12), 1259–1265 (2007).
- Burgel PR, Paillasseur JL, Caillaud D et al. Clinical COPD phenotypes: a novel approach using principal component and cluster analyses. Eur. Respir. J. 36(3), 531–539 (2010).
- Burgel PR, Paillasseur JL, Peene B et al. Two distinct chronic obstructive pulmonary disease (COPD) phenotypes are associated with high risk of mortality. PLoS ONE 7(12), e51048 (2012).
- Marsh SE, Travers J, Weatherall M et al. Proportional classifications of COPD phenotypes. Thorax 63(9), 761–767 (2008).
- Pike D, Parraga G. Chronic obstructive pulmonary disease: more imaging, more phenotyping…better care? Canadian Respir. J. 20(2), 90 (2013).
• • Large-scale study showed that cardiovascular diseases were the leading cause of hospitalization and second leading cause of death in subjects with mild-to-moderate chronic pulmonary obstructive disease (COPD).
• Provided evidence that the emphysema phenotype of COPD is associated with subclinical atherosclerosis.
• Provides a concise overview of systemic inflammation in COPD and how it promotes cardiovascular disease.
• • Provides an excellent description of the underlying pathologic links between COPD and comorbidities.
• One of the first studies to investigate lung function and carotid atherosclerosis and invited further investigation on comorbid lung and vascular disease.
• • Findings from this recent study showed that COPD is a predictor of the presence of vulnerable atherosclerotic plaques.


