Special Report - Imaging in Medicine (2010) Volume 2, Issue 5
Using magnetic resonance for the imaging of dural invasion by head and neck tumors
Alexandra Borges†1, Domingos Coiteiro2, Jorge Rosa Santos3, Miguel Magalhães4and Isabel Fonseca5
1Instituto Português de Oncologia de Francisco Gentil – Centro de Lisboa, Radiology Department, Rua da Junqueira, 292, 1300-340 Lisbon, Portugal
2Hospital de Santa Maria, Neurosurgery Department, Rua Avenida Prof. Egas Moniz, 1649-035 Lisbon, Portugal
3Instituto Português de Oncologia de Francisco Gentil – Centro de Lisboa, Department of Head & Neck Surgery, Rua Prof. Lima Basto, 1093, Lisbon, Portugal
4Instituto Português de Oncologia de Francisco Gentil – Centro de Lisboa, Department of Ear, Nose & Throat, Rua Prof. Lima Basto, 1093, Lisbon, Portugal
5Instituto Português de Oncologia de Francisco Gentil – Centro de Lisboa, Pathology Department, Rua Prof. Lima Basto, 1093, Lisbon, Portugal
- *Corresponding Author:
- Alexandra Borges
Instituto Português de Oncologia de Francisco Gentil – Centro de Lisboa Radiology
Department, Rua da Junqueira 292
1300-340 Lisbon, Portugal
Tel: +351 965 619 132
Fax:+351 217 229 880
E-mail: borgalexandra@gmail.com
Abstract
Transdural growth of head and neck malignancies has a major impact on treatment planning and patient prognosis. Whereas tumors remaining extradural can be excised through a facial approach, tumors that transgress the dura require a combined craniofacial surgery, including dural resection, to obtain free surgical margins and often major reconstructive efforts to avoid postsurgical complications. Several studies have demonstrated the negative impact of dural invasion in patient outcome, together with the presence of positive margins and tumor histology. Therefore, efforts should be made to recognize this feature preoperatively. Magnetic resonance has proven to be the most accurate image modality to depict dural invasion and perineural spread of tumors. Dural enhancement, although very sensitive for dural invasion, has a low specificity as it may also result from venous congestion and reactive fibrovascular changes. This report will review the predictive value of MRI in the depiction of dural invasion and present a retrospective study assessing the predictive value of MRI for dural invasion by head and neck tumors performed at our institution.
Keywords
craniofacial resection; dural enhancement; dural invasion; head and neck tumors; MRI; skull base
Anatomy
The skull base is an undulating structure composed of flat bones, traversed by several neurovascular foramina, which separates the intra- from the extra-cranial compartments [1,2]. On its endocranial surface it is coated by the meninges and its exocranial surface is in direct contact with the different spaces of the extracranial head and neck [1,2]. The meninges comprise the pachymeninges or dura mater and the leptomeninges, including the arachnoid and the pia mater. The dura mater, a mesenchymal derivative, is an epithelial-lined connective tissue with an outer periosteal leaflet made of loose connective tissue composed by elongated fibroblasts, large extracellular spaces and meningeal vessels; and an inner meningeal leaflet consisting of a single layer of meningoepithelial cells [3]. The epidural space is an almost virtual space that separates the periosteal leaflet of the dura from the adjacent skull base, and the subdural space separates the meningeal leaflet from the underlying arachnoid membrane [3].
Together with the periosteum, the dura mater is the most effective barrier to tumor spread from the head and neck into the intracranial compartment [4]. Any tumor approaching the skull base from below may invade its bony structure, transgress the dura and grow into the anterior, middle or posterior cranial fossa [1,2]. The most common neoplasms transgressing the skull base originate from the sinonasal and nasopharyngeal regions where the mucosa is closely applied to the bone [1,2,4]. The anterior skull base is particularly prone to invasion as the thin cribriform plate is a weak barrier to tumor growth [1,2].
Imaging modalities & technique
Owing to the fact that clinical access to the skull base is limited, imaging is mandatory to depict the exact relationship of a lesion with the skull base. Whereas CT clearly depicts transgression of mineralized bone, magnetic resonance (MR) is the modality of choice to detect the presence of intracranial extent, namely to evaluate the status of the dura, leptomeninges, brain parenchyma and cranial nerves [1,2,4]. CT technique should include a volumetric acquisition of the skull base using a high-resolution bone algorithm to allow for thin (1 mm) reconstructions in at least two perpendicular planes [1,2,4]. For MR, T2-weighted (T2W) and pre- and postgadolinium T1W thin sections in the coronal and/or sagittal planes through the skull base are mandatory [1,2,4]. The use of fat-suppression, particularly based on frequency selective fatsuppression techniques, is controversial as the skull base is prone to artifacts related to failure of fat suppression at the bone–air–soft tissue interfaces [1,2].
In normal conditions the compact bone of the skull base together with its periosteal layer is seen on MR as a continuous signal void on both T1W and T2W images, only interrupted by the neurovascular foramina (Figure 1A & B). In the sinonasal region a thin T2W hyperintense, contrast-enhancing rim, corresponding to the sinonasal mucosa, is seen immediately underneath (Figure 1C & D). Above lies the dura, which is usually not seen, except on postgadolinium T1W images that may show focal areas of faint, thin, linear enhancement and the subarachnoid space filled with cerebrospinal fluid shown as fluid signal intensity (hypointense on T1W and hyperintense on T2W MR images).

Figure 1.Sagittal and coronal T1- and T2-weighted images illustrate normal skull base anatomy. Sagittal T1-weighted (T1W) (A) and T2W (B) magnetic resonance images showing the compact bone of the skull base and periosteal layer of the dura as a continuous signal void (white arrows). Coronal T2W (C) and gadolinium-enhanced T1W (D) images show a thin T2 hyperintense, contrast-enhancing rim (white arrows) corresponding to the sinonasal mucosa of the sphenoid sinus, immediately underneath the compact bone (red arrows).
Importance of dural invasion in treatment planning & prognosis
Dural invasion by head and neck neoplasms is one of the most important factors determining treatment planning and patients prognosis [5–12].
In tumors that abut the skull base the status of the dura dictates the surgical approach and the composition of the surgical team [5–8]. Tumors that do not invade the dura can be resected endoscopically or via an inferior lateral paranasal approach whereas tumors that invade the dura often require a combined craniofacial resection and the presence of a neurosurgeon within the surgical team [1,2,4,5–8]. Depending on the amount of dura resected, a flap of pericranium or other fascia is needed to reconstruct the dural defect [1,2,7–9]. Therefore, adequate preoperative assessment of the status of the dura is mandatory to allow for adequate treatment planning and avoid the burden of secondary surgical procedures [1,2,5–9]. The neurosurgical approach depends on the location of the primary tumor. As most tumors transgressing the skull base arise from the sinonasal region, the most common surgical procedure is an anterior craniofacial resection [1,5–6]. This procedure involves a bifrontal craniotomy and a subfrontal approach is used to access the anterior skull base.
While elevating the frontal scalp a galeal-pericranial flap is created to facilitate reconstruction of the dural defect [5–7]. When the size of the defect is large, temporal fascia, fascia lata or a synthetic graft may be required to close the dural gap. The most common complications associated to this procedure are hemorrhage, cerebrospinal fluid leak, meningitis, cerebral edema and necrosis of the dural graft [8].
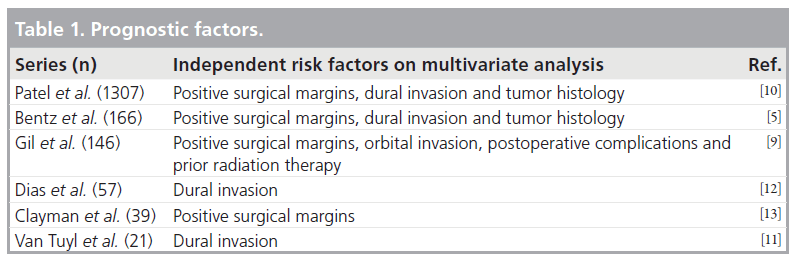
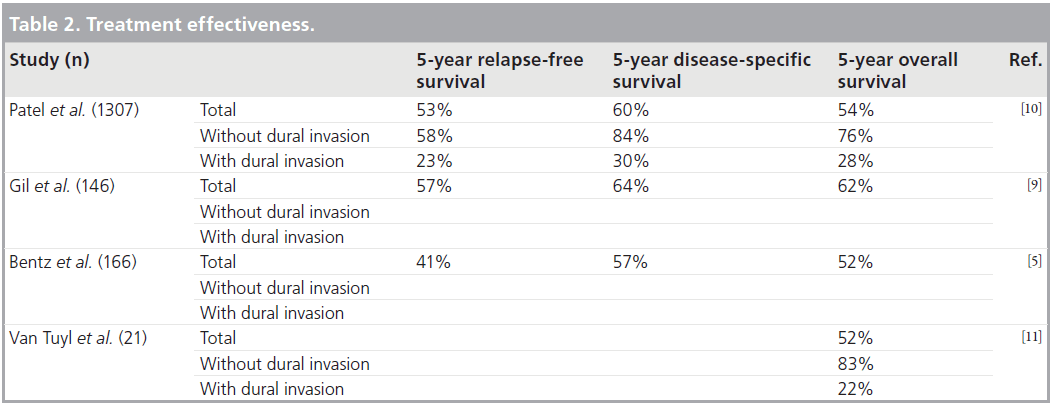
Prognostic factors in craniofacial surgery include: tumor histology, the status of surgical margins and the presence of dural invasion (Tab le 1) [5–13]. Large studies assessing treatment effectiveness demonstrate a statistically significant increase in relapse-free, disease-specific and overall 5‑year survival rates in patients without dural invasion when compared with those with intradural neoplasms. In a study by Patel et al. [10] including 1307 patients, the 5-year survival rate dropped from 84 to 30% in patients without and with dural invasion, respectively (Table 2) [5–11].
Mechanisms of dural invasion
Dural invasion can occur by three different mechanisms: direct extension through the destruction of the bony skull base (Figure 2A), growth along neurovascular foramina, where the dura investing the cranial nerves attaches to its margins (Figure 2B), or via hematogenous spread in the case of dural metastases (Figure 2C).

Figure 2.Gadolinium-enhanced T1-weighted images illustrate different mechanisms of dural invasion by tumor. (A) Sagittal image showing dural invasion by direct breakthrough of the anterior skull base by a large sinonasal neoplasm (undifferentiated sinonasal carcinoma). Note tumor breakthrough into the intracranial compartment (yellow arrow) and extensive brain edema (white arrows). (B) Coronal image demonstrating dural invasion of the left cavernous sinus via perineural spread of a recurrent nasopharyngeal carcinoma along the vidian nerve (black arrows) and V2 (yellow arrows). Note the abnormal enlargement and enhancement of these nerves on the affected side (thick arrows). (C) Axial image showing osseous and dural metastases of a prostate cancer secondary to hematogenous spread (yellow arrows).
The molecular mechanisms underlying dural invasion are complex and still a matter of debate. Autocrine and paracrine signaling molecules such as metalloproteinases and angiogenic factors, including VEGF and PDGF, are the most commonly implicated in tumor invasion, growth and migration [14,15]. Whereas membrane-type 1 metalloproteinases act upon the extracellular matrix (particularly type 1 collagen, fibronectin and gelatin) contributing to the disruption of the adjacent periosteum and underlying dura, the overexpression of proangiogenic factors activate the migration and proliferation of endothelial cells and may account for the abnormal dural enhancement (Figure 3) [15].

Figure 3.Molecular mechanisms for dural invasion. ECM: Extracellular matrix; MT1 MMP: Membrane type-1 matrix metalloproteinase.
MRI criteria for dural invasion
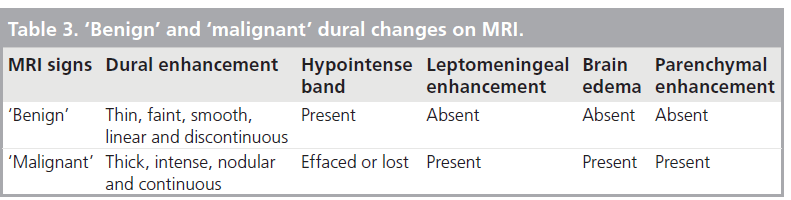
Several MR criteria have been used to evaluate dural invasion, the most important being dural enhancement in close vicinity to a tumor, the pattern of dural enhancement and the presence of leptomeningeal, parenchymal enhancement or brain edema (Tab le 3) [16–20]. Dural enhancement, although very sensitive in depicting dural invasion, has a low specificity because, as opposed to the vessels supplying the arachnoid membrane, dural microvessels are not part of the blood–brain barrier and lack tight junctions [3]. Therefore, some degree of dural enhancement is expected to occur in normal conditions. In addition, the dura tends to react in front of an advancing lesion by increasing its thickness and vascularization, a process known as reactive fibrovascular changes, further complicating this issue [16,19,20]. Whether these features result from venous congestion or from angiogenic paracrine signaling from the adjacent tumor remains elusive.
Normal dural enhancement should be thin, smooth, linear, discontinuous and faint (less intense then the enhancement normally seen in the cavernous sinus) [4,16,19,20]. This enhancement is most often seen at the vertex, falx and tentorium (Figure 4A & B). On the other hand, thick, continuous, intense (Figure 5A) and nodular enhancement (Figure 5B) should be regarded as pathologic [4,16,19,20]. Another criterion for dural invasion is the loss of the hypointense band between the tumor and the overlying enhancing dura, corresponding to the bony-periosteal layer (Figure 5C) [4]. The ‘sandwich sign’ reflects the presence of linear dural enhancement in between two hypointense lines that correspond to the bony-periosteal layer below, and the subarachnoid space above (cerebrospinal fluid cleft) (Figure 5D) [4]. The enhancement of the dura is often stronger than that of the adjacent tumor (Figure 5E) [4,19,20]. In most circumstances this sign results from fibrovascular changes of the dura and not from actual invasion by the tumor [18–20]. Effacement of both hypointense lines is a good predictive sign of dural invasion [4]. Tumor may abut the overlying brain parenchyma without brain edema or enhancement to suggest parenchymal invasion (Figure 5F) [4]. The presence of brain edema suggests early cortico-pial invasion, whereas parenchymal enhancement is a sign of gross invasion (Figure 5G) [4,16–20].

Figure 4.Gadolinium-enhanced sagittal and coronal T1-weighted images demonstrate the features of normal dural enhancement. Sagittal (A) and coronal (B) gadolinium-enhanced T1-weighted images showing normal dural enhancement along the tentorium (white arrows) and vertex (yellow arrows).

Figure 5.Gadolinium-enhanced T1-weighted images illustrating the different magnetic resonance criteria for dural invasion. (A) Sagittal image showing a segment of continuous, linear dural enhancement along the floor of the anterior skull base (white arrows) overlying a sinonasal neoplasm (sinonasal adenocarcinoma). (B) Sagittal image demonstrating nodular dural enhancement (white arrow) in contiguity with a large sinonasal malignancy (squamous cell carcinoma). (C) Sagittal image showing loss of the hypointense band corresponding to the bone and periosteal layer of the dura (white arrows). Note the thin, linear dural enhancement (dashed yellow arrows) overlying the areas of intact bony-periosteal layer (solid yellow arrow) (intestinal type adenocarcinoma). (D) Coronal image illustrating the ‘sandwich sign’: thin, linear dural enhancement (thin white arrows) in between two hypointense lines corresponding to the bony-periosteal layer immediately below (yellow arrows) and the cerebrospinal fluid cleft immediately above (thick white arrows). Note, however, the focal effacement of the hypointense line in the region of the cribriform plate, suggesting tumor transgression (dashed white and yellow arrows) (sinonasal T-cell lymphoma). (E) Sagittal image showing continuous and linear enhancement of the dura to a further degree than the tumor itself (yellow arrows) (squamous cell carcinoma). (F) Coronal image shows loss of both hypointense bands with intimate contact between the tumor and the overlying brain parenchyma (yellow arrow). No parenchymal enhancement or edema is noted to suggest cortico-pial invasion (olfactory neuroblastoma). (G) Coronal image demonstrating extensive dural transgression with cortico-pial enhancement (white arrows) and brain edema (yellow stars) (olfactory neuroblastoma)..
Predictive value of MRI for dural invasion
Material & methods
In order to evaluate the predictive value of MR for dural invasion by head and neck tumors we have conducted a retrospective study of 35 patients who underwent a craniofacial resection at our institution in a 5‑year period from January 2002 to July 2007. Inclusion criteria comprised patients submitted to a craniofacial resection at our institution without prior treatments who have had a MR study performed within 2 weeks prior to surgery, including gadolinium-enhanced images in at least two planes. We have only included cases with a portion of the dura resected en bloc with a portion of the tumor or with an adequately labeled dural biopsy sent to pathology. MR studies were assessed for the presence of dural enhancement contiguous with the primary tumor, maximal width of dural enhancement, pattern of enhancement (linear or nodular; continuous or discontinuous) and for the presence of a hypointense band separating the tumor from the enhancing dura. Leptomeningeal and parenchymal enhancement and brain edema were also evaluated. Out of the initial 35 patients only 22 met all inclusion criteria; the remaining 13 were excluded from further evaluation.
Results
Tumor histologies were varied but most tumors arose from the sinonasal region, accounting for the higher number of anterior craniofacial resections via a bifrontal craniotomy [15]. Middle cranial fossa and posterior cranial fossa resections were also seen in four and three patients, respectively (Tab le 4).
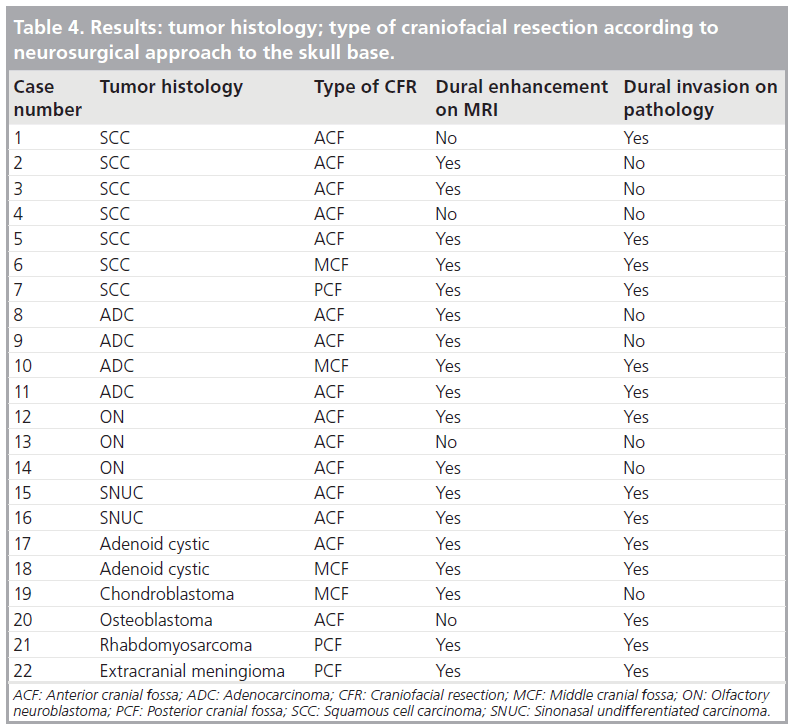
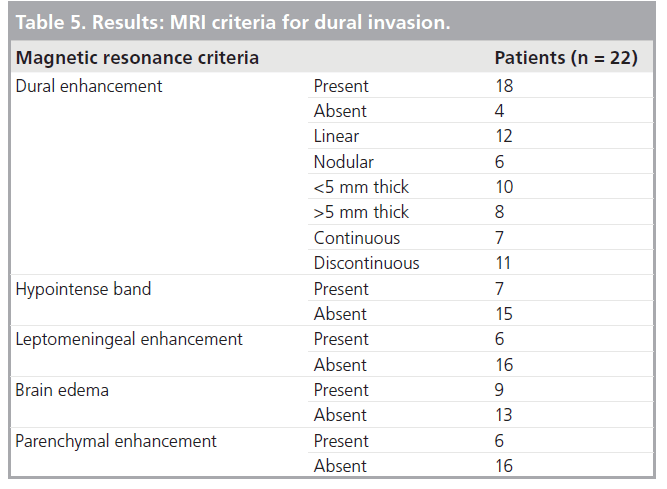
Among the 22 patients, 14 had dural invasion confirmed on pathology. Dural enhancement was present in 18 cases and absent in four (Tab le 4). Among those with dural enhancement, the enhancement was linear in 12 and nodular in six cases. The width of dural enhancement varied between 1 and 10 mm. A total of ten patients had a maximal width of enhancement below 5 mm and eight patients had dural enhancement above this threshold. Enhancement was continuous in seven and discontinuous in 11 patients. The hypointense band was absent in 15 cases and present in seven cases. A total of six patients had leptomeningeal enhancement, nine had brain edema and six had parenchymal enhancement (Tab le 5).
Our results, together with the existing literature, confirm that dural enhancement is fairly sensitive but nonspecific, although dural enhancement above 5 mm and nodular enhancement have a higher specificity and positive predictive value. Loss of the hypointense band and discontinuous dural enhancement have a higher accuracy, over 85%, and the best balance between positive and negative predictive values. Leptomeningeal, cortico-pial enhancement and brain edema are 100% specific but lack sensitivity.
All patients with dural enhancement above 5 mm or with nodular enhancement had dural invasion confirmed on pathology with no falsepositive results. There were also no false positives for dural invasion in patients with brain edema, leptomeningeal or parenchymal enhancement.
The pathologic correlate of dural enhancement was tumor invasion in 12 cases (true positives) (Figures 6 & 7). There were six cases with dural enhancement with no dural invasion found on pathology (false positives). In these cases pathology showed reactive fibrovascular changes and/or inflammatory infiltrates (Figure 8). Inflammatory infiltrates were also found in association with dural invasion by tumor.

Figure 6.Magnetic resonance image and corresponding histopathology slice illustrating a true positive case of dural enhancement in a patient with olfactory neuroblastoma. (A) Gadolinium-enhanced coronal T1-weighted image demonstrates a large sinonasal neoplasm invading the skull base and dura with early cortico-pial invasion, seen as abnormal enhancement creeping along the olfactory sulcus (white arrows). (B) Corresponding histological slice (HE in low magnification) confirms the magnetic resonance findings by showing sheets of tumor cells invading the periosteal dural leaflet (yellow arrows). Note a cap of meningoepithelial cells corresponding to the meningeal layer (black arrows). Multiple blood vessels and fibrous tissue hypertrophy are also noted reflecting reactive fibrovascular changes (olfactory neuroblastoma).

Figure 7.Magnetic resonance image and corresponding histopathology slice illustrating a true positive case of dural enhancement in a patient with a sinonasal squamous cell carcinoma. (A) Gadolinium-enhanced T1-weighted image shows thick, continuous dural enhancement and an area of nodular enhancement transgressing the dura and invading the adjacent brain parenchyma (yellow arrow). Also note extensive vasogenic edema of the adjacent brain (white arrows). (B) Corresponding histological slice (HE on high magnification) demonstrates a tumor thrombus filling in a dural vessel (black arrows) with an extensive inflammatory reaction surrounding the vessel mimicking a vasculitis (yellow arrows). Also note fibrous tissue hyperthrophy and hypervascularization at the periphery. Some of the malignant cells appear empty due to loss of keratin during processing of the material (squamous cell carcinoma).

Figure 8.Magnetic resonance image and corresponding histopathology slice illustrating a false-positive case of dural enhancement in a patient with a sinonasal adenocarcinoma. (A) Gadolinium-enhanced sagittal T1-weighted image shows intense, continuous and linear dural enhancement overlying a large sinonasal neoplasm (adenocarcinoma). (B) Corresponding histological slice (HE low magnification) demonstrates frank fibrous hypertrophy (yellow stars) and hypervascularization (black arrows) of the dura overlying the tumor. No tumor cells were noted infiltrating the dura. (C) HE with high magnification demonstrates a dilated vessel with some red blood cells inside (black arrows).
There were two false-negative results for dural enhancement and one false negative for the loss of the hypointense band. The false-negative result for both criteria was a large osteoblastoma, which proved to transgress the dura on pathology. However, no dural enhancement and no clear interruption of the hypointense band were noted in this case (Figure 9). This was due to the peripheral shelf of compact bone, typical for this tumor, which can mimic the normal bony-periosteal layer of the remodeled skull base. Therefore, this specific criterion may not apply to bone tumors of the skull base. The second false negative was a squamous cell carcinoma that was seen to efface the hypointense band but showed no dural enhancement (Figure 10).

Figure 9.Magnetic resonance and CT images illustrating a false-negative case for dural enhancement and loss of the hypointense band in a patient with a large osteoblastoma. Plain (A) and gadolinium-enhanced (B) sagittal T1-weighted images show a large anterior skull base neoplasm separated from the overlying brain by a thick hypointense band (white arrows). No abnormal dural enhancement is noted on the postgadolinium image. However, dural invasion was noted on pathology (not shown). (C) CT image of the same patient (sagittal reconstruction in bone window) demonstrates the bony nature of the lesion and the eggshell-like bone rim (osteoblastoma).

Figure 10.Coronal gadolinium-enhanced T1-weighted magnetic resonance images illustrating a false-negative case for dural enhancement, but not for the loss of the hypointense band. Gadolinium-enhanced coronal T1-weighted image (A) with fat suppression (B) demonstrate loss of the hypointense band separating this large sinonasal neoplasm from the overlying brain without dural enhancement. Dural invasion was noted on pathology.
The sensitivity of all types of dural enhancement to predict dural invasion was 92.8%, with an overall accuracy only slightly above 70%. However, if we disregard dural enhancement below 5 mm, specificity increases to 100% and accuracy approaches 80%. Adding to dural enhancement above 5 mm a second criterion – loss of the hypointense band – increases sensitivity to 98%.
Discussion
There are many problems with the pathologic assessment of dural invasion, justifying the lack of large retrospective or prospective studies assessing the accuracy of MR in depicting dural invasion. To adequately access the status of the dura the pathologist should receive the surgical specimen en bloc together with the adjacent dura, correctly labeled by the surgeon. However, in the great majority of cases the surgical specimen consists of tumor fragments resulting from piecemeal resections, lacking adequate anatomic references. If no labeling is provided, the dura is very hard to recognize as it consists of a fibrous tissue with scant meningoepithelial lining and pathologic staging remains incomplete.
Only three prior studies exist in the English literature evaluating the role of MRI in the prediction of dural invasion by head and neck tumors: one from Ahmadi et al. [19] including 17 patients showing one false-negative result using the same MR criteria as in the present study; another from Eisen et al. [18] including 22 patients showing slightly better accuracy for all MRI criteria when compared with our study; and finally, a study from Ishida et al. [20] including only ten patients, showing one false-negative and one false-positive result.
The accuracy of MRI is limited by the resolution of the technique and by the nonspecific contrast enhancement of the dura, which can result both from invasion by tumor and from reactive fibrovascular changes (connective tissue hypertrophy, inflammation and hypervascularity). Nevertheless, MRI is at the present time the imaging technique that best reflects preoperatively the status of the dura in patients with head and neck tumors abutting the skull base [20].
Conclusion
The depth and extent of skull base invasion by a tumor is the most critical information for a successful en bloc resection. Imaging is, at the present time, the only means for evaluating the status of the skull base and overlying dura preoperatively. The presence of dural invasion has a significant impact on surgical planning and in achieving curative resections, influencing patients prognosis. On MR, linear thickening and enhancement of the dura above 5 mm, nodular enhancement and effacement of the hypointense band are all good predictors of dural invasion. Cortico-pial enhancement and brain edema are very specific findings but lack sensitivity.
To date very few studies have evaluated the accuracy of MR in predicting dural invasion, mainly due to difficulties with the pathologic evaluation of piecemeal specimens with inadequate labeling of the dural surface, impeding a complete pathologic staging.
Future perspective
The increasing use of higher field magnets (3 Tesla) and the increasing resolution of MR sequences, allowing for submillimeter slices, will likely contribute to increase the accuracy of MR in depicting dural invasion by tumors abutting the skull base. MR-PET with the use of tumor-specific radioligands and the development of magnetically labeled nanoparticles will also contribute to increase the specificity of MR in distinguishing dural invasion from fibrovascular changes. The molecular mechanisms of dural invasion are being increasingly recognized and may be used as potential targets for imaging, namely the overexpression of metalloproteinases and proangiogenic factors and the degradation products of the extracellular matrix (collagen type I, fibronectin and gelatin).
Papers of special note have been highlighted as:
* of interest
* of considerable interest
References
- Borges A: Skull base tumours part I: imaging technique, anatomy and anterior skull base tumours. Eur. J. Radiol. 66(3), 338–347 (2008).
- Borges A: Imaging of the central skull base. Neuroimag. Clin. N. Am. 19, 669–696 (2009).
- Young B, Lowe J, Stevens A, Heath J: Central nervous system. In: Wheater’s Functional Histology: A Text and Colour Atlas (5th Edition). Churchill Livingstone, Elsevier, London, UK (2006).
- Maroldi R, Farina D, Battaglia G: Neoplastic invasion of bone, the orbit and dural layers: basic and advanced CT and MR findings. In: Imaging In Treatment Planning For Sinonasal Diseases. Maroldi R, Nicolai P (Eds). Springer-Verlag, Berlin, Germany (2005). & Provides a detailed description of magnetic resonance criteria predictive of dural invasion together with very didactic schematic illustrations.
- 5 Bentz BG, Bilsky MH, Shah JP, Kraus D: Anterior skull base surgery for malignant tumors: a multivariate analysis of 27 years of experience. Head Neck 25(7), 515–520 (2003). & Provides a multivariate analysis of the prognostic factors that impact the outcome of anterior craniofacial resections in 166 patients.
- Dos Santos LR, Cernea CR, Brandao LG et al.: Results and prognostic factors in skull base surgery. Am. J. Surg. 168(5), 481–484 (1994).
- Yousem DM, Gad K, Tufano RP: Resectability issues with head and neck cancer. AJNR Am. J. Neuroradiol. 27(10), 2024–2036 (2006).
- Gil Z, Patel SG, Bilsky M, Shah JP, Kraus DH: Complications after craniofacial resection for malignant tumors: are complication trends changing? Otolaryngol. Head Neck Surg. 140(2), 218–223 (2009).
- Gil Z, Patel SG, Cantu G et al.: Outcome of craniofacial surgery in children and adolescents with malignant tumors involving the skull base: an international collaborative study. Head Neck 31(3), 308–317 (2009).
- Patel SG, Singh B, Polluri A et al.: Craniofacial surgery for malignant skull base tumors: report of an international collaborative study. Cancer 15(98), 1179–1187 (2003).
- Van Tuyl R, Gussak GS: Prognostic factors in craniofacial sugery. Laryngoscope 101(3), 240–244 (1991).
- Dias FL, Sá GM, Kligerman J et al.: Prognostic factors and outcome in craniofacial surgery for malignant cutaneous tumors involving the anterior skull base. Arch. Otolaryngol. Head Neck Surg. 123(7), 738–742 (1997).
- Clayman GL, DeMonte F, Jaffe DM et al.: Outcome and complications of extended cranial-base resection requiring microvascular free-tissue transfer. Arch. Otolaryngol. Head Neck Surg. 121(11), 1253–1257 (1995).
- Knappe U, Fink T, Fisseler-Echoff A, Schoenmayr R: Expression of extracellular matrix proteins in perisellar connective tissue and duramater. Acta Neurochir. 152(2), 345–353 (2010).
- Polette M, Birembaut P: Membrane-type metalloproteinases in tumor invasion. Int. J. Biochem. Cell Biol. 30(11), 1195–1202 (1998).
- Ahmadi J, Hinton DR, Segall HD, Couldwell WT: Surgical implications of magnetic resonance-enhanced dura. Neurosurgery 35(3), 370–377 (1994). & This prospective study including 73 patients assesses the histopathologic changes associated with dural enhancement seen on MRI, highlighting the reactive fibrovascular changes.
- Maroldi R, Ambrosi C, Farina D: Metastatic disease of the brain: extra-axial metástases (skull, dura, leptomeningeal) and tumor spread. Eur. Radiol. 15(3), 617–626 (2005).
- Eisen M, Yousem D, Montone K et al.: Use of preoperative MR to predict dural, perineural, and venous sinus invasion of skull base tumors. AJNR Am. J. Neuroradiol. 17, 1937–1945 (1996). & This retrospective study evaluates the accuracy of MRI in predicting dural invasion in 22 patients, using different imaging criteria.
- Ahmadi J, Hinton DR, Segall HD, Couldwell WT, Stanley RB: Dural invasion by craniofacial and calvarial neoplasms: MR imaging and histopathologic evaluation. Radiology 188(3), 747–749 (1993). & First published paper evaluating the accuracy of MRI in the prediction of dural invasion by craniofacial and calvarial tumors using histopathology as the gold standard.
- Ishida H, Mohri M, Amatsu M: Invasion of the skull base by carcinomas: histopathologically evidenced findings with CT and MR. Eur. Arch. Otorrhinolaryngol. 259, 535–539 (2002). & Compares the accuracy of both CT and MRI in the depiction of dural invasion by head and neck tumors, demonstrating the better accuracy of magnetic resonance.


