Perspective Article - Imaging in Medicine (2011) Volume 3, Issue 4
Neurological imaging: statistics behind the pictures
Ivo D Dinov*SOCR Resource and Laboratory of Neuro Imaging, UCLA Statistics, 8125 Mathematical Science Bldg, Los Angeles, CA 90095, USA
- Corresponding Author:
- Ivo D Dinov
SOCR Resource and Laboratory of Neuro Imaging
UCLA Statistics, 8125 Mathematical Science Bldg
Los Angeles, CA 90095, USA
Tel: +1 310 825 8430
Fax: +1 310 206 5658
E-mail: dinov@stat.ucla.edu
Abstract
Neurological imaging represents a powerful paradigm for investigation of brain structure, physiology and function across different scales. The diverse phenotypes and significant normal and pathological brain variability demand reliable and efficient statistical methodologies to model, analyze and interpret raw neurological images and derived geometric information from these images. The validity, reproducibility and power of any statistical brain map require appropriate inference on large cohorts, significant community validation, and multidisciplinary collaborations between physicians, engineers and statisticians.
Keywords
brain mapping ▪ imaging modalities ▪ neuroimaging ▪ statistics
Scientific challenges
The clinical importance, structural fragility and organizational complexity of the brain require unique skills, powerful technologies and large amounts of data to study its intricate anatomical structure, functional connectivity, metabolic activity and physiology. Neurological imaging, or neuroimaging, along with modern quantitative and visualization techniques enable diverse means for untangling the secrets of the normal and pathological brain from development, through normal aging. There is a broad spectrum of neuroimaging modalities, significant presence of intrinsic and extrinsic noise, and extensive intra- and inter-subject variability. This explains why many neuroimaging biomarkers may have only marginal power to detect different brain phenotypes. These challenges demand reliable and efficient computational statistics methods for synthesizing, analyzing, modeling and interpreting the vast amounts of neuroimaging data [1]. Indeed, some techniques and computational methods are more susceptible to pathological, morphological and timedependent variation. For instance, some volumebased structural MRI [2,3], tensor-based [4] and functional imaging [5,6] approaches are sensitive for detecting, monitoring and tracking dementia- driven brain changes from mild cognitive impairment to Alzheimer’s disease.
Statistical methodologies
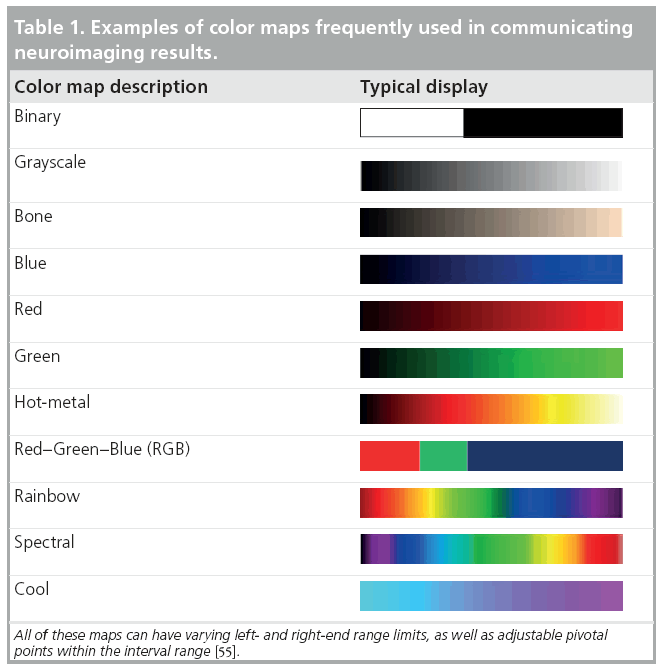
Many complementary types of statistical techniques exist to cope with the gamut of specific neuroimaging challenges arising from multiple imaging scales, normal imaging variability, high dimensional data, varying study designs and different a priori assumptions. These include parametric and nonparametric statistical tests [7,8], linear and nonlinear models [9], dimensionality reduction techniques [10], bootstrapping and resampling methods [11,12], and survival analyses [13], among others. The choice of an appropriate and sufficiently powerful statistical technique is paramount in any neuroimaging study as both false-positive (type I) and false-negative (type II) errors are not only likely, but inevitable [14]. The most common approach to communicate neuroimaging statistical results involves statistical mapping using diverse arrays of color maps to depict phenotypic effects, correlations, associations, peak outcomes, morphometric or physiological measurements beyond normally expected noise levels. Table 1 illustrates some examples of common color maps frequently used in structural, functional, diffusion, spectroscopic and tomographic neuroimaging. These examples of common color maps may lead to misunderstandings caused by fact that the range of intensity values mapped onto the RGB colors could be linearly or nonlinearly transformed by researchers and may vary significantly between different scientific reports.
Validity & reproducibility
Nowadays there are many large and publicly accessible databases [15–18] providing storage, management and retrieval of raw and derived neuroimaging data on a large scale (hundreds and thousands of subjects). This greatly facilitates the processes of algorithm development, mathematical modeling and testing of novel computational techniques for analyzing multimodal neuroimaging data. For example, the recent efforts on the human [101] and mouse [102] connectome projects employ diverse MRI protocols and multiparametric approaches to study the structural and functional aspects of brain connectivity [19,20]. Many new and innovative approaches fusing imaging, phenotypic and clinical data are proposed and tested to identify associations, trends and patterns characterizing intricate relations between developmental, cognitive and psychiatric traits and various functional anatomical biomarkers. Validation and reproducibility of the enormous amount of new techniques, models, results and findings remain challenging because of lack of exact data and protocol provenance, significant intrinsic and extrinsic variability within and between different cohorts (even within the same population), and model limitations of the available computational techniques [21,22].
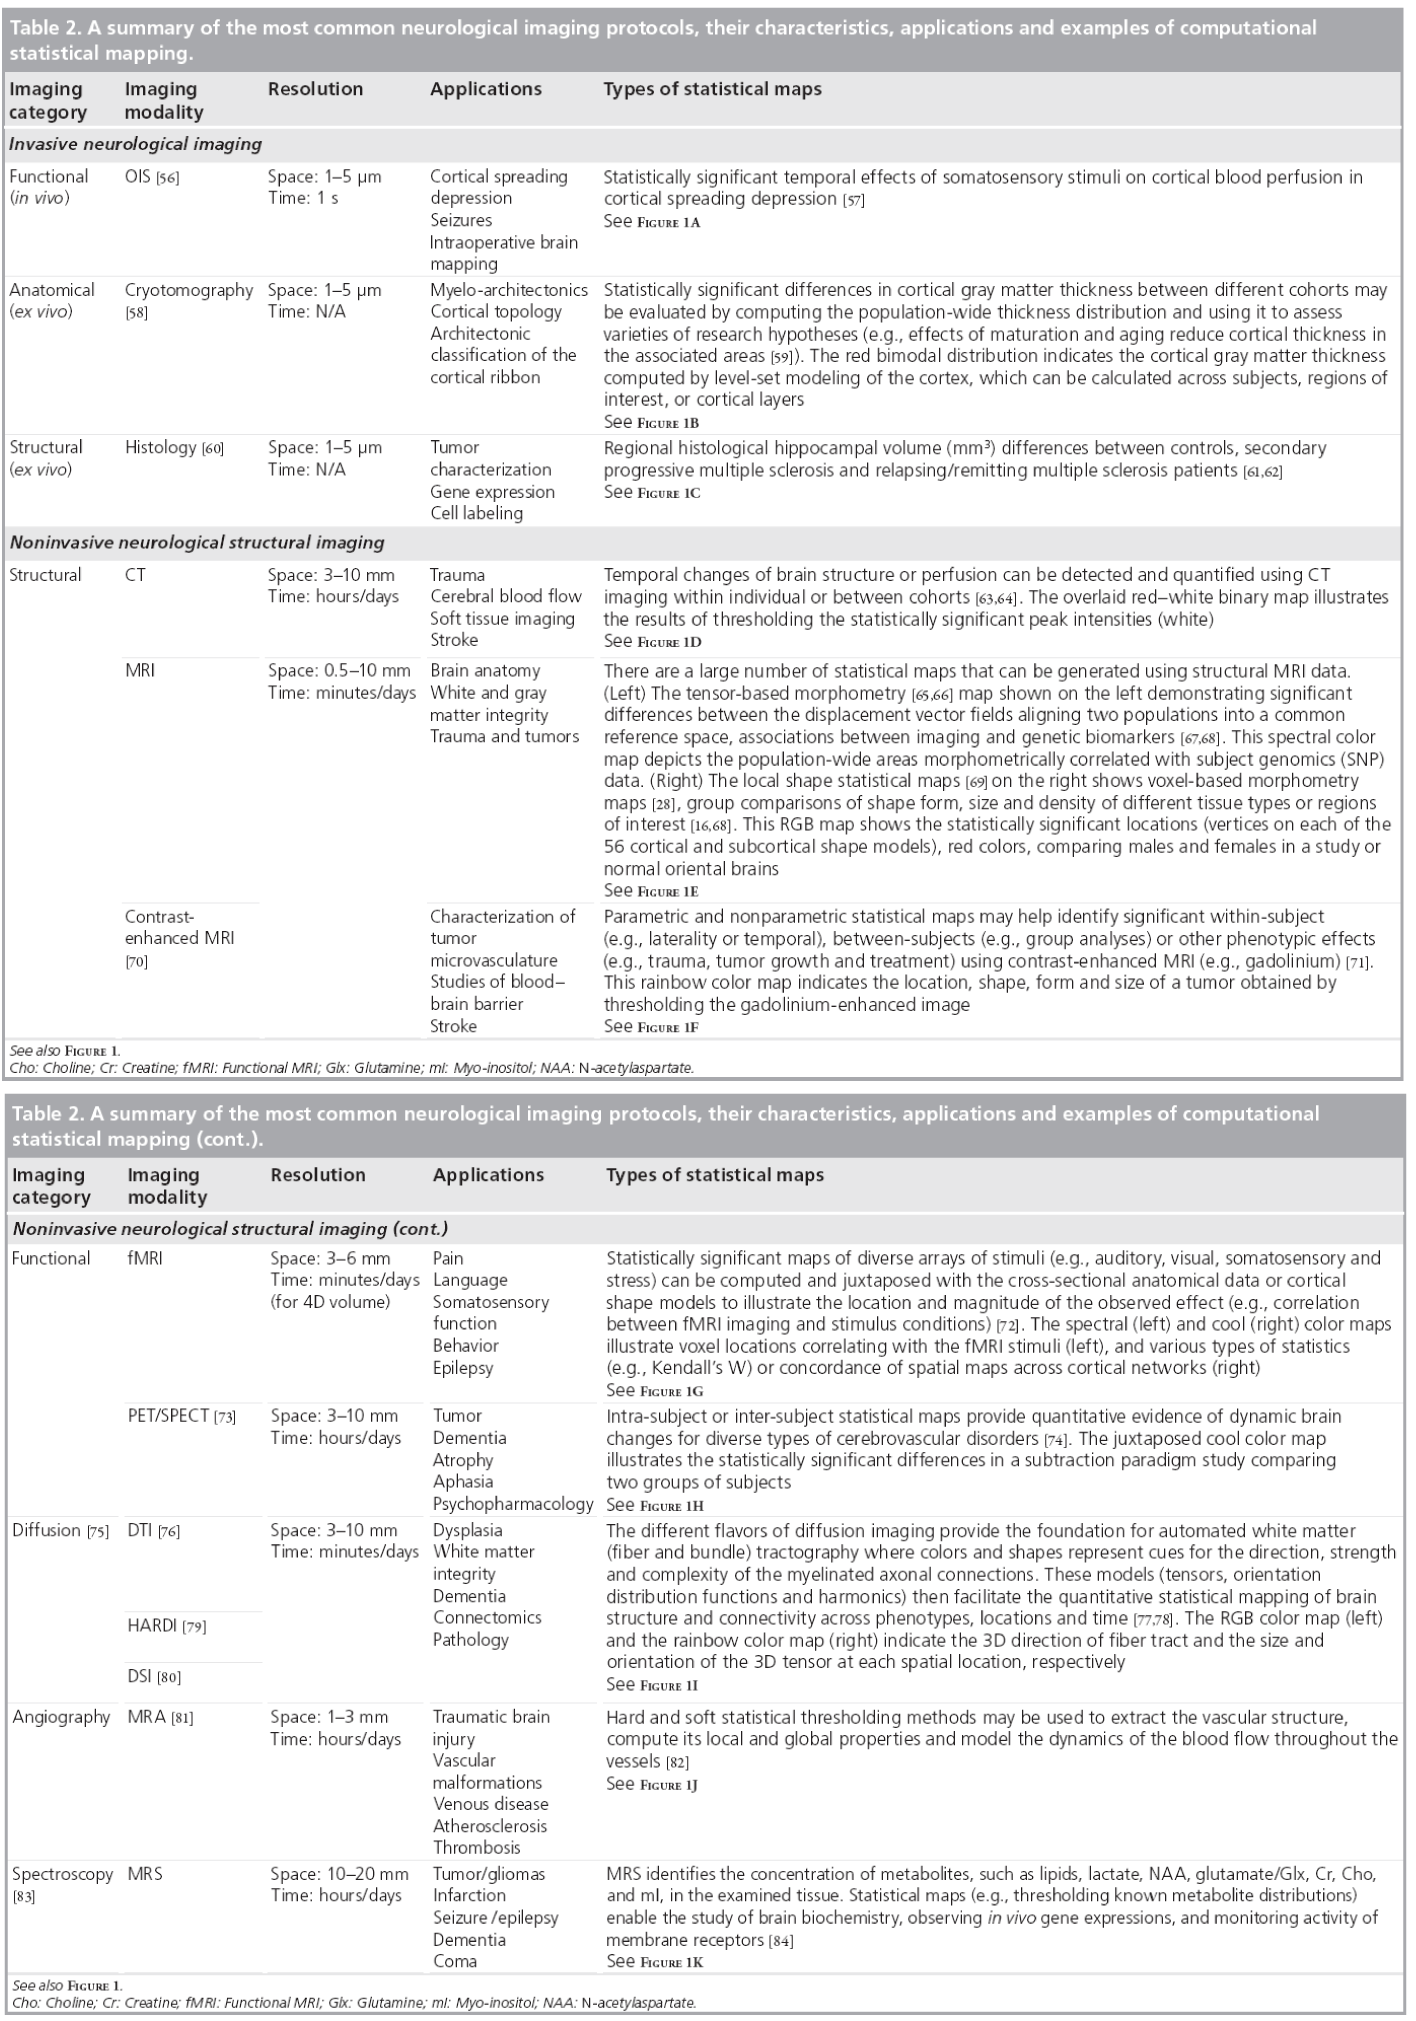
Figure 1 & Table 2 show examples of common neuroimaging modalities, typical statistical maps, applications and imaging resolutions. Space and time resolutions refer to the most common ranges for world-space scaling (space) and possible temporal frequency (time) for image acquisitions for each specific imaging modality. The processes of result validation and reproducibility of different neuroimaging analyses and statistical maps are often difficult because of a number of intrinsic and extrinsic factors. Examples of intrinsic factors include the significant intra- and inter-subject variability, presence of noise in the imaging data, and variations in study designs, sample sizes and sampling protocols. The significant number of available mapping techniques, statistical methodologies and computational tools used in the processing of neuroimaging data demonstrate extrinsic factors impacting neuroimaging result validation.

Figure 1: A summary of the most common neurological imaging protocols, their characteristics, applications and examples of computational statistical mapping. See also Table 2. Cho: Choline; Cr: Creatine; Glx: Glutamine; mI: Myo-inositol; NAA: N-acetylaspartate.
Challenges
■ Analysis of imaging, genetics & phenotypic data
The analysis of imaging and nonimaging data is rapidly becoming an important component of most modern neuroimaging studies. Nowadays, many neuroimaging studies include heterogeneous data from hundreds of subjects including multimodal imaging, multiple clinical measurements and diverse subject demographics. In fact, some studies include large genetics datasets (e.g., single nucleotide polymorphisms [SNPs], partial or complete genome mapping, gene-expression). The integration of quantitative and qualitative imaging, phenotypic and genomic data becomes challenging because different types of data are expressed in noncongruent bases and represent correlated (dependent) or orthogonal (independent) dimensions. Yet, the potential for significant health benefits provides strong incentives to design, validate and productize novel computational modeling and statistical analysis techniques that enable efficient, robust and powerful holistic analyses of multimodal neuroimaging data, clinical measurements, phenotypic records and genetic data. Some recent studies are making headway in analyzing such multiform data. Examples include the use of Alzheimer’s Disease Neuroimaging Initiative data [23,24,103] to investigate the relationship between genetic variation and imaging biomarkers via genome-wide association and shape analyses, and a study of schizophrenia using imaging, cognition, genetics and pharmacotherapeutic data [25].
■ Spatial versus geometric modeling
Traditional statistical mapping of neurological images focuses on spatial characterization of anatomical features in 2D, 3D or 4D images. Examples of such spatial neuroimaging modeling include structural analysis [26,27], voxel-based morphometry [28], statistical parametric mapping [29,30] and network analyses [31–33]. Most of these analytic techniques utilize univariate intensity-based measures of brain anatomy or functional activation directly obtained from the tomographically or stereotactically acquired imaging data. New complementary approaches extracting, modeling and analyzing geometric data derived from the raw neuroimaging data are increasingly becoming an integral component of many contemporary neuroimaging studies. Such geometric modeling techniques, derived from the raw imaging data, include shape analyses [34,35], tensor modeling and analyses [36,37], as well as tractography and white matter integrity [38,39]. These geometric techniques rely on sophisticated mathematical models to represent static or dynamic features of brain structure and function as multidimensional curved manifolds (spaces locally homeomorphic to Euclidian spaces of the same dimension with no curvature), higher-order generalizations of scalars, vectors and matrices (tensors), and topologically equivalent canonical spaces [40–42]. Figure 2 demonstrates an example of a canonical brain reference (atlas), the International Consortium for Brain Mapping Brain Atlas [43], where the entire brain is parcellated into disjoint and complementary regions of interest. The volume, geometric properties (e.g., regional surface complexity) and the inter-regional affinities (e.g., relative position or size) of this partition are all important characteristics of anatomical brain integrity. These shape and manifold-based measures can be computed for a large and diverse pool of subjects and then can be compared individually, or as a (sub) group, to an atlas, compared to other cohorts, or used as imaging markers to study the associations between neuroimaging predictors, clinical measurements and subject phenotypes.

Figure 2: (A) Coronal, (B) sagittal, (C) axial and (D) 3D cortical surface views of the International Consortium for Brain Mapping Brain atlas. Geometric models of global and local brain structure provide mechanisms for classifying shape form and size of different regions of interest by measuring various quantitative characteristics, such as shape area, fractal dimension and curvedness, etc. [16].
■ Statistical inference
Statistical power is a quantitative measure of the probability that a computational inference method would produce a false negative decision (i.e., fail to detect the presence of a real effect). Power estimates for many neuroimaging studies require knowledge of the approximate effect-size being studied, the sample-size, and the exact statistical model employed in the analysis, estimates of the expected normal data variability, and investigator-defined false-positive (type I) error rate. Power analysis, sample-size calculations (e.g., numbers needed to treat), and calculations of the minimum effect size can all be used interchangeably based on whether the investigator is able to specify either a realistic sample-size of the experiment, the desired power of the study, or accurately identify the underlying effect-size of interest. Power analyses in brain imaging studies are challenging as they require separate analyses for many brain regions of interest, each of which has a different effect size and variability.
All computational and statistical inference methods require some a priori assumptions. These typically concern the generation of the observed data and specifications of model probability distributions. Examples of such a priori conditions include parametric, nonparametric and semiparametric assumptions. Parametric assumptions require that the data probability distributions can be described by a specific family of distributions (e.g., Poisson, Exponential, General Normal, or Gaussian distributions) involving only a finite number of unknown parameters. Nonparametric assumptions indicate that the data-generating process obeys some more relaxed properties (e.g., the distribution has a well-defined median). Semiparametric assumptions represent an intermediate type of condition; for instance, the data distribution may have a well-defined mean, range or shape, at the same time as demanding that two or more variables have a specific linear model relationship. The parametric neuroimaging statistics are applicable for detecting mean differences and are appropriate for identifying between-group (spatial) or within-subject (temporal) differences when the underlying research hypotheses are directly related to central tendency. On the other side, nonparametric approaches, typically based on data rank-orders, are applicable for studies where the distributions of the parameters of interest are skewed, have heavy tails, exhibit noncontiguous support or are otherwise nonregular [44].
Multiple comparison problems in neuroimaging studies may occur when investigators conduct a large set of statistical inferences simultaneously, which may lead to inference errors (e.g., intervals that fail to include their corresponding population parameters or hypothesis tests with underestimated false positive error). Although several alternative solutions to the multiple comparisons problem exist (e.g., Bonferroni correction, False Discovery Rate, Family-Wise Error Rate), these may either be too conservative or insufficiently corrective [45]. Most brain imaging studies demand multiple comparison corrections, although such post hoc analyses need not be performed on the entire brain, but can be localized, using regional masks, to specific (smaller) brain regions identified by previous studies, which increases the power to detect phenotypic and genetic effects on brain structure and function.
■ Future perspective
Computational and statistical modeling, characterization and inference of future neuroimaging studies are likely to rely on significantly increased volume and heterogeneity of multimodal imaging data across different scales, complex subject phenotypes, integrated individual subject and reference human genomics data, advanced computational infrastructure, as well as powerful new technologies for the management, processing and visualization of these intricate data. Examples of powerful new multimodal imaging protocols include simultaneous PET-CT scanning used in clinical imaging [46,47], joint PET-MRI providing high spatial resolution and excellent morphologic discrimination of MRI and the exquisite sensitivity of nuclear imaging in both preclinical and clinical settings [48,49], combining fluorescence molecular tomography, near-infrared imaging, CT and MRI [50,51], as well as variants of integrated x-ray, nuclear imaging, and optical imaging in all-in-one tomographic scanner [52–54].
The reproducibility and validity of new findings may be increased if the neuroimaging community embraces open, collaborative and distributed mechanisms for sharing data, disseminating exact data analysis protocols, incorporating modern Grid and Cloud computing infrastructures, and supports the engagement of multidisciplinary investigators in such translational studies. The following activities and resources may be critical for the successful translational application of modern neuroimaging techniques in the near future – open and collaborative communication between multiple disciplines, sharing of imaging data and metadata, as well as wide distribution of methods, software tools, web services, computational infrastructure and detailed analysis protocols.
Financial & competing interests disclosure
This work was supported in part by National Institutes of Health grants U54 RR021813, P41 RR013642, and U24-RR025736, and National Science Foundation grants 0716055 and 1023115. The author has no other relevant affiliations or financial involvement with any organization or entity with a financial interest in or financial conflict with the subject matter or materials discussed in the manuscript apart from those disclosed.
No writing assistance was utilized in the production of this manuscript.
References
- Akil H, Martone ME, Van Essen DC. Challenges and opportunities in mining neuroscience Data. Science 331(6018), 708–712 (2011).
- Woodard JL, Seidenberg M, Nielson KA et al. Semantic memory activation in amnestic mild cognitive impairment. Brain 132(8), 2068–2078 (2009).
- George S, Mufson EJ, Leurgans S, Shah RC, Ferrari C, Detoledo-Morrell L. MRI-based volumetric measurement of the substantia innominata in amnestic MCI and mild AD. Neurobiol. Aging DOI: 10.1016/j. neurobiolaging.2009.11.006 (2011) (Epub ahead of print).
- Ho AJ, Hua X, Lee S et al. Comparing 3 T and 1.5 T MRI for tracking Alzheimer’s disease progression with tensor-based morphometry. Hum. Brain Mapp. 31(4), 499–514 (2010).
- Kochunov P, Ramage AE, Lancaster JL et al. Loss of cerebral white matter structural integrity tracks the gray matter metabolic decline in normal aging. Neuroimage 45(1), 17–28 (2009).
- Berti V, Osorio RS, Mosconi L, Li Y, De Santi S, De Leon MJ. Early detection of Alzheimer’s disease with pet imaging. Neurodegen. Dis. 7(1–3), 131–135 (2010).
- Thirion B, Pinel P, Mériaux S, Roche A, Dehaene S, Poline J-B. Analysis of a large fMRI cohort: statistical and methodological issues for group analyses. Neuroimage 35(1), 105–120 (2007).
- Che A, Cui J, Dinov I. SOCR analyses: implementation and demonstration of a new graphical statistics educational toolkit. J. Stat. Soft. 30(3), 1–19 (2009).
- Friston KJ, Dolan RJ. Computational and dynamic models in neuroimaging. Neuroimage 52(3), 752–765 (2010).
- Shen H, Wang L, Liu Y, Hu D. Discriminative analysis of resting-state functional connectivity patterns of schizophrenia using low dimensional embedding of fMRI. Neuroimage 49(4), 3110–3121 (2010).
- Koenig T, Melie-García L, Stein M, Strik W, Lehmann C. Establishing correlations of scalp field maps with other experimental variables using covariance analysis and resampling methods. Clin. Neurophys. 119(6), 1262–1270 (2008).
- Christou N, Dinov I. Confidence interval based parameter estimation – a new SOCR applet and activity. PLoS ONE 6(5), E19178 (2011).
- Pirotte BJM, Levivier M, Goldman S et al. Positron emission tomography-guided volumetric resection of supratentorial high-grade gliomas: a survival analysis in 66 consecutive patients. Neurosurgery 64(3), 471–481 (2009).
- Lazzeroni LC, Ray A. The cost of large numbers of hypothesis tests on power, effect size and sample size. Mol. Psychiatry DOI: 10.1038/mp.2010.117 (2010) (Epub ahead of print).
- Nestor SM, Rupsingh R, Borrie M et al. Ventricular enlargement as a possible measure of Alzheimer’s disease progression validated using the Alzheimer’s disease neuroimaging initiative database. Brain 131(9), 2443–2454 (2008).
- Dinov I, Lozev K, Petrosyan P et al. Neuroimaging study designs, computational analyses and data provenance using the loni pipeline. PLoS ONE 5(9), E13070 (2010).
- Marcus D, Olsen T, Ramaratnam M, Buckner R. The extensible neuroimaging archive toolkit. Neuroinformatics. 5(1), 11–33 (2007).
- Van Horn JD, Toga AW. Is it time to re-prioritize neuroimaging databases and digital repositories? Neuroimage 47(4), 1720–1734 (2009).
- Dolgin E. This is your brain online: the functional connectomes project. Nat. Med. 16(4), 351–351 (2010).
- Swanson LW, Bota M. Foundational model of structural connectivity in the nervous system with a schema for wiring diagrams, connectome, and basic plan architecture. Proc. Natl Acad. Sci. 107(48), 20610–20617 (2010).
- Landman BA, Huang AJ, Gifford A et al. Multi-parametric neuroimaging reproducibility: a 3-T resource study. Neuroimage 54(4), 2854–2866 (2011).
- David O, Guillemain I, Saillet S et al. Identifying neural drivers with functional MRI: an electrophysiological validation. PLoS Biol. 6(12), DOI: 10.1371/journal. pbio.0060315 (2008) (Epub ahead of print).
- Kim S, Swaminathan S, Shen L et al. Genome-wide association study of CSF biomarkers Ab1–42, t-tau, and p-tau181p in the ADNI cohort. Neurology 76(1), 69–79 (2011).
- Wang Y, Song Y, Rajagopalan P et al. Surface-based TBM boosts power to detect disease effects on the brain: an N=804 ADNI study. Neuroimage 56(4), 1993–2010 (2011).
- Vyas N, Patel N, Nijran K, Al-Nahhas A, Puri B. The use of PET imaging in studying cognition, genetics and pharmacotherapeutic interventions in schizophrenia. Exp. Rev. Neurother. 11, 37–51 (2011).
- Bartzokis G, Cummings JL, Sultzer D, Henderson VW, Nuechterlein KH, Mintz J. White matter structural integrity in healthy aging adults and patients with Alzheimer disease: a magnetic resonance imaging study. Arch. Neurol. 60(3), 393–398 (2003).
- Mega MS, Thompson PM, Dinov ID, Toga AW, Cummings JL. The UCLA Alzheimer brain atlas project: structural and functional applications. Neurobiol. Aging 22(2), 334–334 (2001).
- Ashburner J, Friston KJ. Voxel-Based Morphometry – the Methods. Neuroimage 11(6), 805–821 (2000).
- Sowell ER, Levitt J, Thompson PM et al. Brain abnormalities in early-onset schizophrenia spectrum disorder observed with statistical parametric mapping of structural magnetic resonance images. Am. J. Psychiatry 157(9), 1475–1484 (2000).
- Friston KJ, Holmes AP, Worsley KJ, Poline J-P, Frith CD, Frackowiak RSJ. Statistical parametric maps in functional imaging: a general linear approach. Human Brain Mapp. 2, 189–210 (1995).
- Mcintosh A, Gonzalez-Lima F. Structural equation modeling and its application to network analysis in functional brain imaging. Human Brain Mapp. 2(1–2), 2–22 (1994).
- Bota M, Dong HW, Swanson LW. From gene networks to brain networks. Nat. Neurosci. 6(8), 795–799 (2003).
- Joshi A, Joshi S, Leahy R, Shattuck D, Dinov I, Toga A. Bayesian approach for network modeling of brain structural features. Proceedings of the SPIE 7626, 762607 (2011).
- Shi Y, Dinov I, Toga A. Cortical Shape Analysis in the Laplace-Beltrami Feature Space. In: Medical Image Computing and Computer-Assisted Intervention – MICCAI 2009. Yang G-Z, Hawkes D, Rueckert D, Noble A, Taylor C (Eds). Springer, Berlin/ Heidelberg, Germany 208–215 (2009).
- Brignell CJ, Dryden IL, Gattone SA et al. Surface shape analysis with an application to brain surface asymmetry in schizophrenia. Biostat. 11(4), 609–630 (2010).
- Wang Y, Zhang J, Gutman B et al. Multivariate tensor-based morphometry on surfaces: application to mapping ventricular abnormalities in HIV/AIDS. Neuroimage 49(3), 2141–2157 (2010).
- Bressler SL, Menon V. Large-scale brain networks in cognition: emerging methods and principles. Trends Cogn. Sci. 14(6), 277–290 (2010).
- Bastin ME, Maniega SM, Ferguson KJ et al. Quantifying the effects of normal ageing on white matter structure using unsupervised tract shape modelling. Neuroimage 51(1), 1–10 (2010).
- Chanraud S, Zahr N, Sullivan E, Pfefferbaum A. MR diffusion tensor imaging: a window into white matter integrity of the working brain. Neuropsychol. Rev. 20(2), 209–225 (2010).
- Koh W, Mccormick BH. Topology-graph directed separating boundary surfaces approximation of nonmanifold neuroanatomical structures: application to mouse brain olfactory bulb. IEEE Trans. Med. Imaging 28(4), 555–563 (2009).
- Lepore N, Brun C, Yi-Yu C et al. Generalized tensor-based morphometry of HIV/AIDS using multivariate statistics on deformation tensors. IEEE Trans. Med. Imaging 27(1), 129–141 (2008).
- Sakai T, Imiya A. Gradient Structure of Image in Scale Space. J. Math. Imaging Vision. 28(3), 243–257 (2007).
- Mazziotta J TA, Evans A, Fox P et al. A probabilistic atlas and reference system for the human brain: International Consortium for Brain Mapping (ICBM). Philos. Trans. R. Soc. Lond. B Biol. Sci. 356(1412), 1293–1322 (2001).
- Rorden C, Bonilha L, Nichols TE. Rankorder versus mean based statistics for neuroimaging. Neuroimage 35(4), 1531–1537 (2007).
- Chumbley JR, Friston KJ. False discovery rate revisited: FDR and topological inference using Gaussian random fields. Neuroimage 44(1), 62–70 (2009).
- Von Schulthess G, Schlemmer H-P. A look ahead: PET/MR versus PET/CT. Eur. J. Nucl. Med. Mol. Imaging 36(Suppl. 1), S3–S9 (2009).
- Mawlawi O, Townsend D. Multimodality imaging: an update on PET/CT technology. Eur. J. Nucl. Med. Mol. Imaging 36(Suppl. 1), S15–S29 (2009).
- Zaidi H, Montandon ML, Alavi A. The clinical role of fusion imaging using PET, CT, and MR Imaging. Magn. Reson. Imaging Clin. N. Am. 18(1), 133–149 (2010).
- Pichler BJ, Kolb A, Nagele T, Schlemmer H-P. PET/MRI: paving the way for the next generation of clinical multimodality imaging applications. J. Nucl. Med. 51(3), 333–336 (2010).
- Hyde D, De Kleine R, Maclaurin SA et al. Hybrid FMT-CT imaging of amyloid-[beta] plaques in a murine Alzheimer’s disease model. Neuroimage 44(4), 1304–1311 (2009).
- Pogue BW, Leblond F, Krishnaswamy V, Paulsen KD. Radiologic and near-infrared/ optical spectroscopic imaging: where is the synergy? Am. J. Roentgenol. 195(2), 321–332 (2010).
- Kobayashi H, Longmire MR, Ogawa M, Choyke PL, Kawamoto S. Multiplexed imaging in cancer diagnosis: applications and future advances. Lancet Oncol. 11(6), 589–595 (2010).
- Wehrl H, Judenhofer M, Wiehr S, Pichler B. Pre-clinical PET/MR: technological advances and new perspectives in biomedical research. Eur. J. Nucl. Med. Mol. Imaging 36(0), 56–68 (2009).
- Cherry SR. Multimodality Imaging: beyond PET/CT and SPECT/CT Semin. Nucl. Med. 39(5), 348–353 (2009).
- Dinov I, Valentino D, Shin B et al. LONI visualization environment. J. Digit. Imaging 19(2), 148–158 (2006).
- Cannestra AF, Blood AJ, Black KL, Toga AW. The evolution of optical signals in human and rodent cortex. Neuroimage 3(3), 202–208 (1996).
- Ba AM, Guiou M, Pouratian N et al. Multiwavelength optical intrinsic signal imaging of cortical spreading depression. J. Neurophysiol. 88(5), 2726–2735 (2002).
- Ikonomovic MD, Klunk WE, Abrahamson EE et al. Post-mortem correlates of in vivo PiB-PET amyloid imaging in a typical case of Alzheimer’s disease. Brain 131(6), 1630–1645 (2008).
- Annese J, Pitiot A, Dinov ID, Toga AW. A myelo-architectonic method for the structural classification of cortical areas. Neuroimage 21(1), 15–26 (2004).
- Mackenzie-Graham A, Tinsley MR, Shah KP et al. Cerebellar cortical atrophy in experimental autoimmune encephalomyelitis. Neuroimage. 32(3), 1016–1023 (2006).
- Soldan SS, Retuerto AIA, Sicotte NL, Voskuhl RR. Immune modulation in multiple sclerosis patients treated with the pregnancy hormone estriol. J. Immunol. 171(11), 6267–6274 (2003).
- Morales LBJ, Loo KK, Liu H-B, Peterson C, Tiwari-Woodruff S, Voskuhl RR. Treatment with an estrogen receptor ligand is neuroprotective in experimental autoimmune encephalomyelitis. J. Neurosci. 26(25), 6823–6833 (2006).
- Dugdale PE, Miles KA, Bunce I, Kelley BB, Leggett DaC. CT Measurement of perfusion and permeability within lymphoma masses and its ability to assess grade, activity, and chemotherapeutic response. J. Comput. Assist. Tomogr. 23(4), 540–547 (1999).
- Coles JP. Imaging after brain injury. Br. J. Anaesth. 99(1), 49–60 (2007).
- Hua X, Leow AD, Levitt JG, Caplan R, Thompson PM, Toga AW. Detecting brain growth patterns in normal children using tensor-based morphometry. Human Brain Mapp. 30(1), 209–219 (2009).
- Brun C, Leporé N, Pennec X et al. A tensorbased morphometry study of genetic influences on brain structure using a new fluid registration method. Med. Image Comput. Comput. Assist. Interv. 11(Pt 2), 914–921 (2008).
- Rimol LM, Agartz I, Djurovic S et al. Sex-dependent association of common variants of microcephaly genes with brain structure. Proc. Natl Acad. of Sci. 107(1), 384–388 (2010).
- Ho AJ, Stein JL, Hua X et al. A commonly carried allele of the obesity-related FTO gene is associated with reduced brain volume in the healthy elderly. Proc. Natl Acad. Sci. 107(18), 8404–8409 (2010).
- Dinov I, Torri F, Macciardi F et al. Visual Informatics and Genomics Computations using the Pipeline Environment. BMC Bioinformatics. (2011) (In Press).
- Israeli D, Tanne D, Daniels D et al. The application of MRI for depiction of subtle blood brain barrier disruption in stroke. Int. J. Biol. Sci. 7(1), 1–8 (2011).
- Gerstner ER, Duda DG, Di Tomaso E et al. VEGF inhibitors in the treatment of cerebral edema in patients with brain cancer. Nat. Rev. Clin. Oncol. 6(4), 229–236 (2009).
- Nuñez SC, Dapretto M, Katzir T et al. fMRI of syntactic processing in typically developing children: structural correlates in the inferior frontal gyrus. Dev. Cogn. Neurosci. 1(3), 313–323 (2011).
- Mega MS, Chu T, Mazziotta JC et al. Mapping biochemistry to metabolism: FDG-PET and amyloid burden in Alzheimer’s disease. Neuroreport 10(14), 2911–2917 (1999).
- Meerwaldt R, Slart RHJA, Van Dam GM, Luijckx G-J, Tio RA, Zeebregts CJ. PET/ SPECT imaging: from carotid vulnerability to brain viability. Eur. J. Radiol. 74(1), 104–109 (2010).
- Jones D. Diffusion MRI: Theory, Methods, and Applications. Oxford University Press, USA (2010).
- Madan N, Grant PE. New directions in clinical imaging of cortical dysplasias. Epilepsia 50, 9–18 (2009).
- Geng X, Ross T, Zhan W et al. Diffusion MRI registration using orientation distribution functions. Inf. Process Med. Imaging 21, 626–637 (2009).
- Mori S, Oishi K, Jiang H et al. Stereotaxic white matter atlas based on diffusion tensor imaging in an ICBM template. Neuroimage 40(2), 570–582 (2008).
- Raj A, Hess C, Mukherjee P. Spatial HARDI: improved visualization of complex white matter architecture with Bayesian spatial regularization. Neuroimage 54(1), 396–409 (2011).
- Wedeen VJ, Wang RP, Schmahmann JD et al. Diffusion spectrum magnetic resonance imaging (DSI) tractography of crossing fibers. Neuroimage 41(4), 1267–1277 (2008).
- Barnes SRS, Haacke EM. Susceptibilityweighted imaging: clinical angiographic applications. Magn. Reson. Imaging Clin. N. Am. 17(1), 47–61 (2009).
- Lehmpfuhl MC, Hess A, Gaudnek MA, Sibila M. Fluid dynamic simulation of rat brain vessels, geometrically reconstructed from MR-angiography and validated using phase contrast angiography. Phys. Med. 27(3) 169–176 (2011)
- Soares DP, Law M. Magnetic resonance spectroscopy of the brain: review of metabolites and clinical applications. Clin. Radiol. 64(1), 12–21 (2009).
- Barker P. Fundamentals of MR Spectroscopy. In: Clinical MR Neuroimaging: Diffusion, Perfusion and Spectroscopy. Gillard J, Waldman A, Barker P (Eds). Cambridge, Cambridge University Press, UK, 7–26 (2005).


