Review Article - Imaging in Medicine (2011) Volume 3, Issue 2
Hepatic fat-content assessment using magnetic resonance-based methods
Anneloes E Bohte†1, Aart J Nederveen1 & Jaap Stoker11Department of Radiology, Academic Medical Center, University of Amsterdam, Meibergdreef 9, 1105 AZ, Amsterdam, The Netherlands
- Corresponding Author:
- Anneloes E Bohte
Department of Radiology
Academic Medical Center, University of Amsterdam
Meibergdreef 9, 1105 AZ, Amsterdam, The Netherlands
Tel: +31 205 669 111
Fax: +31 205 669 119
E-mail: a.e.bohte@amc.nl
Abstract
Magnetic resonance (MR) -based methods are increasingly used for liver fat quantification as a noninvasive alternative to liver biopsy in diagnostic studies, observational studies and clinical trials. Many studies have addressed the diagnostic accuracy of MR-based methods and of other noninvasive imaging methods (CT and ultrasound). Important advantages of MR-based methods over CT and ultrasound are their quantitative nature and lack of ionizing radiation exposure. In this article, we give an overview of the most commonly available MR-based techniques (MRI and MR spectroscopy) for liver fat detection and quantification. Technical aspects, advantages, disadvantages and diagnostic accuracies are also discussed.
Keywords
diagnostic accuracy ▪ hepatic steatosis ▪ liver ▪ magnetic resonance spectroscopy ▪ MRI
According to various population studies, at least 30% of the general western adult population has a fatty liver [1–4]. A liver is considered ‘fat’ or ‘steatotic’ when fat-containing vacuoles accumulate in the hepatocytes and the total fat content exceeds 5% of the wet weight of the liver [5,6]. The majority of fatty livers are related to nonalcoholic fatty liver disease (NAFLD). NAFLD is currently one of the most common causes of chronic liver disease in both children and adults, owing to the strong association with diabetes and obesity [4,5]. The prevalence of NAFLD increases to 40–69% when diabetes is present, and up to 91% in obese patients [4]. Moreover, diabetes, insulin resistance and obesity are independent predictors of mortality in patients with chronic liver disease [7]. Other conditions that are associated with hepatic steatosis include excessive alcohol consumption, chronic viral infection (hepatitis C), and metabolic or storage disorders. Certain drugs and toxins can also induce hepatic steatosis [8,9].
Detection and quantification of hepatic steatosis is clinically important in several situations: in NAFLD, steatosis is recognized as the earliest biomarker and necessary feature for the development of nonalcoholic steatohepatitis (NASH). NASH is a condition in which hepatic steatosis coexists with liver cell injury and inflammation [10]. While the presence of steatosis alone (‘simple steatosis’) is considered benign, patients with NASH have an increased risk of liver-related complications and mortality [5]. Recently, a follow-up study showed that simple steatosis can progress to NASH; of 13 patients with simple steatosis at baseline, five developed borderline NASH and three developed NASH after 3 years [11]. Early diagnosis and treatment of NASH and monitoring of patients with simple steatosis is, therefore, important.
In hepatitis C, steatosis is associated with more severe fibrosis and rapid disease progression, while an adequate response to antiviral treatment results in a decrease of steatosis [12]. In addition, the presence of hepatic steatosis impairs the regenerative capacity of the liver in both donor and recipient in liver transplantation surgery, and is associated with primary nonfunction of the liver graft [13–16]. The maximum amount of fatty infiltration for liver grafts accepted by most transplantation centers varies between 10 and 30% [13,16]. Therefore, an accurate tool with which to determine the exact amount of fat in the liver is essential.
Liver biopsy is the reference standard for the assessment of hepatic steatosis. Liver biopsy has a number of disadvantages, including patient discomfort (in a nationwide study conducted in France 20% of patients experience moderate pain and 3% experience severe pain [17]), as well as complication and mortality risks of 0.31 and 0.03%, respectively [18]. Moreover, the histological examination of the liver biopsy by pathologists is subject to inter- and intra-observer variability and the small volume of the liver biopsy sample (30 μl) can cause sampling errors [17–19]. For these reasons, a liver biopsy is unsuitable for monitoring patients, or for large-scale clinical trials.
Magnetic resonance-based methods (MRI and proton MR spectroscopy [1H-MRS]) can detect and quantify hepatic steatosis noninvasively. Other available imaging techniques are ultrasound and CT. MR methods have a higher diagnostic accuracy than ultrasound and CT for evaluating hepatic steatosis, and are capable of detecting and quantifying even small amounts of hepatic fat [20–22]. Although not always readily available and relatively expensive, MR-based methods have the advantage of being accurate and quantitative. Moreover, they do not involve radiation exposure and can easily be combined with other MR protocols. 1H-MRS is considered the most accurate technique and is increasingly used as a reference standard instead of liver biopsy in clinical trials, diagnostic studies and observational studies [23–35].
In this article, we provide an overview of the most commonly available MR-based techniques (MRI and 1H-MRS) for liver fat detection and quantification.
Chemical-shift techniques
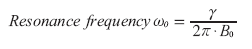
Chemical-shift imaging utilizes the difference in resonance frequency of protons in water and protons in fat to detect and measure hepatic fat content [36,37]. (Methylene is the most abundant chemical structure within a triglyceride molecule and therefore the most dominant signal that arises from the triglyceride molecule. Unless specified otherwise, the term ‘fat’ in this article refers to methylene.) After excitation by a radiofrequency pulse, protons in water will resonate slightly faster than protons in fat, owing to the difference in chemical environments. This difference in resonance frequency of protons is termed chemical shift. The difference in resonance frequency is linearly related to the magnetic field strength, B0. The resonance frequency w0 (MHz) is defined by the Larmor equation:
 (1)
(1)
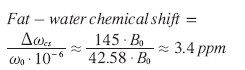
In this equation, the resonance frequency w0 is expressed in megahertz; g represents the gyromagnetic ratio (g /2p = 42.58 MHz/T for protons in water) and B0 represents the magnetic field strength in Tesla (T). The chemical shift frequency difference (Δωcs) between protons in water and fat is proportional to the magnetic field strength: at body temperature, this difference is approximately 145 Hz at 1T, 217 Hz at 1.5T and 434 Hz at 3T. Chemical shifts are usually expressed in parts per million (ppm), which are independent of B0. The chemical-shift difference between water and fat is approximately 3.4 ppm:
 (2)
(2)
How can this principle be used to quantify
hepatic steatosis in MRI? At the exact moment
the excitation radiofrequency pulse is sent into
the liver tissue, all protons are exactly in-phase
(IP), meaning that all magnetization vectors
point in the same direction. Immediately after
the radiofrequency pulse is turned off, the
protons will start to dephase. Fat protons will
dephase slightly faster than water protons. As
a result, at  fat protons will be 180°
out of phase, meaning they point in exactly the
opposite direction as the water protons (Figure 1):
fat protons will be 180°
out of phase, meaning they point in exactly the
opposite direction as the water protons (Figure 1):
 (3)
(3)

Figure 1: Signal vector diagram for in-phase and opposed-phase imaging. The signals of water and fat are combined and the resultant signal is observed.
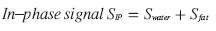
At t = TEIP, all protons will be IP again, meaning that water and fat signals add up (Figure 1).
 (4)
(4)
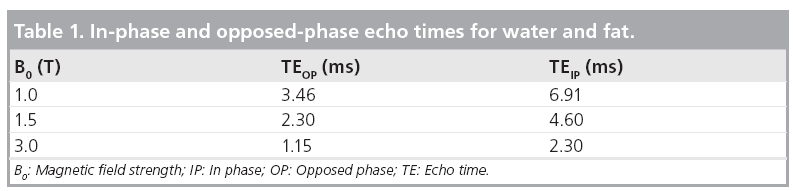
The echo times (TE), at which fat and water signals are IP and out of phase can be calculated for different MR field strengths (B0 ) (Table 1):
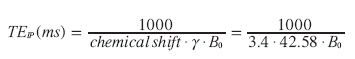 (5)
(5)
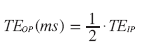 (6)
(6)
Dual-echo chemical shift MRI (dual-echo IP/opposed-phase imaging)
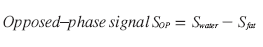
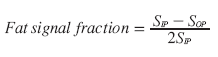
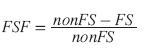
For this technique, the hepatic fat fraction is calculated by comparing the signal intensities on IP and opposed-phase (OP) images:
 (7)
(7)
The fat fraction can be calculated when applying Equation 7 to signal intensities measured in corresponding regions of interest on IP and OP images (Figure 2A & 2B) [38]. In addition, instead of selecting regions of interest, a fat signal fraction map can be generated for the complete MR slice, showing the spatial distribution of the fat signal-intensity values throughout the liver (Figure 2C). However, IP and OP echoes must be acquired after a single radiofrequency excitation pulse, with identical calibration for both echoes. If the IP and OP echoes are acquired separately, an internal reference (spleen) should be used to correct the hepatic signal-intensity values [39].

Figure 2: A 10-year-old obese boy with severe fatty liver. T1-weighted dual-echo in-phase (IP)/opposed-phase (OP) MRI acquisition. (A) OP image; (B) IP image; (C) fat-signal fraction map based on IP and OP signal intensities in selected regions of interest (270 vs 53). The total fat signal is 0.4.
Advantages
The dual-echo IP/OP imaging technique is fast, can be performed easily in routine examinations and is widely available. Moreover, it allows for fat quantification of the entire liver. It can be performed at different magnetic field strengths, and is relatively insensitive to magnetic field heterogeneity [38].
Disadvantages
There are several important limitations to dualecho IP/OP imaging; the fat–water signal dominance ambiguity, and confounders, such as T2* effects, T1 effects and fat spectral complexity effects [38,40].
Fat–water signal-dominance ambiguity limits fat quantification in the case of severe fatty liver. As explained in the previous section, and in Figure 1, the signal intensity on an IP or OP MRI reflects the sum of the magnetization vectors of water and fat. If the magnetization vectors of water and fat are equal, their signals will cancel each other out in the OP image. If, however, the magnetization vectors are unequal, which will normally be the case, then it is not possible to determine whether the resultant signal intensity on the OP image originates from either fat or water. Correct liver fat quantification will not be possible unless additional information is acquired from, for instance, multiple flip angles or repetition times, fat suppression or field mapping [41–43]. Fat fractions greater than 50%, however, are very uncommon [3], meaning that the resultant signal on OP images will normally originate from water.
T2* effects
Dual-echo IP/OP imaging does not correct for T2* effects. The IP and OP images are acquired at different TEs. During the TE interval, T2* decay occurs, resulting in signal loss. The signal loss between IP and OP images is used to calculate fat content, so additional signal loss due to T2* effects will interfere with fat detection and lead to errors of interpretation. If the OP image is acquired first, additional signal loss on the IP images due to T2* effects will cause the hepatic fat content to be underestimated. If, on the other hand, the IP image is acquired first, then signal loss on the OP image owing to T2* effects will lead to overestimation of hepatic fat content. This T2* bias is even stronger in the case of iron overload, which can coexist with fat in chronic liver diseases and is associated with liver cirrhosis [44]. T2* effects can be minimized by choosing the first consecutive OP and IP echoes. T2* effects can also be corrected for by measuring T2* separately. More advanced imaging techniques based on IP/OP imaging, such as triple-echo and multiecho techniques, have been developed to take these T2* effects into account and will be discussed later in this article [26,35,38,41,45,46].
T1-effects
T1-weighting in dual-echo IP/OP imaging causes a bias as water and fat have different T1 values. The shorter T1 time of fat causes the fat signal to be artificially amplified in a T1-weighted image. This T1 bias can be avoided by using a low (10°) flip angle [38,40,47].
Fat spectral complexity effects
In dual-echo IP/OP imaging, the ratio between the signal from water (4.7 ppm) and the signal from the methylene fat peak (1.3 ppm) is calculated. As shown in the MR spectum in Figure 3A, fat has other (smaller) spectral peaks that also contribute to the total fat content, but are ignored in dual-echo IP/OP imaging (e.g., diacyl at 2.75 ppm; a-carboxyl at 2.24 ppm; a-olefinic at 2.02 ppm and methyl [CH3] at 0.9 ppm). These peaks cause complex phase interferences (fat–fat interference effects), leading to inaccuracies in fat and water signal measurements [48]. A correction model for these effects has been described by Yokoo et al. [35]. Moreover, fat peaks at 5.29 ppm (olefinic) and at 4.20 ppm (glycerol) account for 8.6–15% of the total fat content [49,50]. However, these peaks lie so close to the water peak at 4.7 ppm that their signal will add to the water signal, leading to further quantification errors. Since there may only be limited variation in the fat spectrum of the liver, the magnitude of the 5.29 and 4.20 ppm peak areas can be corrected for when the magnitude of the other fat peaks is known [49].

Figure 3: Examples of 1H-magnetic resonance spectra at 3T. (A) Spectrum of a severe fatty liver. The most dominant signals are the resonance signal from water at 4.7 parts per million (ppm) and the main fat peak (methylene [CH2]) at 1.3 ppm. The chemical-shift difference between water and fat is 3.4 ppm. The other peaks represent the resonances from other protons along the fatty acid chain: (a) olefinic at 5.29 ppm; (b) diacyl at 2.75 ppm; (c) α-carboxyl at 2.24 ppm; (d) α-olefinic at 2.02 ppm and (e) methyl CH3 at 0.9 ppm. (B) MR spectrum of a nonfatty liver. Only the water peak at 4.7 ppm is visible, no fat peaks are observed.
Accuracy
Studies that compared the diagnostic accuracy of dual-echo IP/OP imaging with liver biopsy as the reference standard were analyzed in a meta-analysis [20]. Summary estimates of sensitivity and specificity for detecting liver fat with a threshold of 0–5% fat on liver biopsy were 82% (95% CI: 64–92%) and 90% (95% CI: 81–95%), respectively. With a threshold of 10–20% liver fat, sensitivity and specificity summary estimates were 90% (95% CI: 73–97%) and 95% (95% CI: 83–99%), respectively. With a threshold of 30–33% liver fat on biopsy, sensitivity was 97% (95% CI: 84–100%) and specificity was 76% (95% CI: 50–91%). No separate analyses were performed for the presence of iron, fibrosis stages or underlying liver disease. All studies were performed at a magnetic field strength of 1.5T.
Two recently published papers that compared the accuracy of ultrasound, CT, dual-echo IP/OP MRI and 1H-MRS with liver histopathology were not included in this meta-analysis. Both studies used a 3T MR system for MRI and 1H-MRS. For dual-echo IP/OP MRI with a threshold of more than 5% liver fat on histopathology, Van Werven et al. found a sensitivity of 90% and a specificity of 91% for steatosis detection in 46 patients who underwent liver resection [22]; the area under the curve (AUC) was 0.93. They did not correct for T1 or T2* effects. The performance of dual-echo IP/OP imaging was better than ultrasound and CT (AUC: 0.77 and 0.76, respectively). 1H-MRS performed slightly better than dual-echo IP/OP imaging with an AUC of 0.97.
Lee et al. assessed the accuracy of ultrasound, CT, dual-echo IP/OP imaging and 1H-MRS in 161 potential living liver donors compared with liver biopsy [21]. For dual-echo IP/OP imaging with corrections for T2* effects, the sensitivity, specificity and AUC with a threshold of more than 5% fat on liver biopsy were 77%, 87% and 0.883, respectively. With a threshold of more than 30% fat on liver biopsy, sensitivity, specificity and AUC were 91%, 94% and 0.995, respectively. In this study, dual-echo IP/OP imaging performed significantly better than ultrasound and CT. There was no significant difference in performance between dual-echo IP/OP imaging and 1H-MRS. The results from both Lee et al. and Van Werven et al. are in close agreement with the results from the meta-analysis [21,22].
Multiecho chemical-shift MRI
New techniques have been described that address the discussed confounding influences of T1, T2* and fat spectral complexity effects [25–27,30,32,35,41,45,47,51–54]. In summary, T1 is accounted for by using a long repetition time (TR) and a low (10°) flip angle; T2* relaxation effects are estimated and corrected for by triple- or multi-echo acquisition and the fat–fat interference effect is corrected for by incorporating this component into the model (fat spectral modeling). Images can be acquired in one or two breath holds. An additional postprocessing step is required that includes a reconstruction algorithm to generate fat signal fraction (FSF) map [39].
Accuracy
All studies that investigate the diagnostic accuracy of multiecho techniques for liver fat quantification have used 1H-MRS as reference standard. To our knowledge, no studies have been published with liver biopsy as reference standard.
Yokoo et al. compared low flip angle (10°) dual-echo IP/OP imaging, triple-echo, multiecho and multi-interference techniques with 1H-MRS as reference standard at 1.5T MRI [47]. All four techniques suppressed T1 effects by a low 10° flip angle. Dual-echo IP/OP imaging did not include T2* correction or fat spectral modeling. Triple- and multi-echo techniques included T2* correction, but did not correct for fat–fat interference effects. The multiinterference technique covered all three confounding influences. With a diagnostic threshold of 6.25% for the presence of a fatty liver with 1H-MRS, the sensitivity of dual-echo IP/ OP imaging was 82%. This was significantly lower than the sensitivities of triple-echo (97%), multiecho (95%) and multi-interference imaging (98%). Specificities were 100, 88, 100 and 88%, respectively. A systematic underestimation of the liver fat fraction (LFF) with dualecho IP/OP imaging of 2.9% resulted in the low sensitivity and high specificity.
Guiu et al. assessed the systematic errors in liver methylene fraction resulting from fat–fat interference effects from nonmethylene peaks with dual-echo IP/OP gradient recalled echo imaging and triple-echo gradient recalled echo imaging at 3T MRI [27]. They found that nonmethylene peaks produced an approximate 10% systematic relative underestimation of the liver methylene fraction in both techniques. T2* decay was responsible for an absolute systematic error of 1.9–4.2% in liver methylene fraction measurement.
Most recently, Yokoo et al. compared the accuracy of dual-, triple- and six-echo MRI methods in 163 subjects with 1H-MRS as the reference standard at 3T MRI [35]. For each of the three MRI methods, the fat fraction was calculated with single-frequency (methylene, 1.3 ppm) and with multifrequency (all measurable fat peaks) fat signal modeling. The multiecho methods were corrected for T2* effects, the dual-echo methods were not. The classification accuracies of T2* corrected multifrequency triple- and sixecho imaging methods were highest (accuracies of 95–96% for both methods depending on the fat fraction threshold). The accuracy of singlefrequency fat fraction measurement was highest for triple-echo MRI with an accuracy of 94–96%.
Frequency-selective fat saturation
Frequency-selective imaging enables suppression of a signal of interest, such as that of water or fat. This is different from dual-echo IP/OP imaging, where both fat and water protons are excited to produce the MR signal. When the signal from the main fat peak (methylene) in the liver is suppressed, the resultant signal will approximate the signal from the water peak. To suppress the methylene peak, a frequency selective presaturation radiofrequency pulse with the same resonance frequency as that of the methylene fat peak is applied. The bandwidth of the pulse needs to be selected in such a way that it does not affect the water frequency (4.7 ppm). The flip angle of this radiofrequency pulse needs to be exactly 90° so that all longitudinal magnetization in the fat peak will be tipped into the transverse plane and, thus, will be saturated. The pulse is followed by a crusher gradient to spoil all transverse magnetization of fat. Immediately after this presaturation pulse, a standard imaging sequence is started. The zero net magnetization that results from the presaturation pulse has no time to recover, resulting in suppression of signal from the main fat peak: the remaining signal originates from water [55].
To calculate the fat percentage with frequency- selective fat-saturation (FS) imaging, two spin-echo or IP T2-weighted MR images need to be acquired: one with a presaturation FS pulse and one without a presaturation FS pulse. Both images should be acquired with the same imaging parameters, so that confounding influences, such as T2* effects, are balanced. If the FS and non-FS images are not obtained with identical imaging parameters, an internal reference (e.g., spleen) is necessary to normalize the signal intensity values of the liver [38]. Non-FS images show the signal intensity of water and fat protons together, FS images that are of water only (Figure 4). The fraction of relative signalintensity loss on images without FS and with FS is calculated as follows:
 (8)
(8)

Figure 4: A 53-year-old female patient with focal liver steatosis. (A) T2-weighted image without fat saturation. (B) T2-weighted image with fat saturation. The T2-weighted fat saturated image (B) shows substantial signal loss in the right liver lobe due to focal liver steatosis, whereas this was not visible on the T2-weighted image without fat saturation (A).
As with IP/OP imaging, either manually selected colocalized regions of interest can be placed in the liver to calculate the FSF or a separate fat signal fraction map can be created.
Advantages
The frequency-selective FS pulse can precede any MRI sequence. Signal in non-fat tissue is unaffected as long as the bandwidth and saturation pulse frequency are accurately selected. FS pulses are very effective when the main magnetic field B0, as well as the transmit radiofrequency field B1, are homogeneous in the selected field of view. Although few clinical studies have been published on the diagnostic accuracy of frequency-selective FS imaging for liver steatosis quantification, FS imaging could have benefits over dual-echo IP/OP imaging as FS imaging is less susceptible to T2* effects than dual-echo IP/OP imaging [42,56–59].
Disadvantages
B0 heterogeneities
Fat-saturation pulses are sensitive to B0 heterogeneities that shift the position of the water and fat peaks with respect to the presaturation pulse. Such B0 heterogeneities can lead to incomplete or failed saturation of the targeted signal. The saturation pulse can even be so far off that it saturates the water peak instead of the fat peak. Therefore, successful fat suppression with presaturation pulses requires a homogeneous magnetic field.
B1 heterogeneities
The perfect FS pulse requires an exact 90° flip angle in order to saturate the longitudinal magnetization of fat. A smaller or larger flip angle results in incomplete suppression of the fat signal. Flip angles, however, are typically accurate only within a 5–10° range, as they are sensitive to heterogeneities in the radiofrequency field B1. The use of surface coils can also distort the transmitter field [60].
Accuracy
Qayyum et al. retrospectively compared the relative accuracy of FS fast spin-echo MRI and that of dual-echo IP/OP imaging with liver biopsy in patients with and without cirrhosis [42]. In patients without cirrhosis, FS/non-FS imaging correlated better with liver biopsy than dualecho IP/OP imaging (r = 0.92 vs 0.69; p < 0.01). In patients with cirrhosis, FS/non-FS imaging correlated with liver biopsy (r = 0.76; p < 0.01), whereas dual-echo IP/OP imaging did not correlate with liver biopsy (r = 0.25; p = 0.36). Increased liver iron levels in patients with cirrhosis could have caused T2* effects and confounded dual-echo IP/OP measurements. Liver iron, however, was not measured.
Cotler et al. validated the FS technique in phantoms and in ten patients with biopsy proven NAFLD [56]. MRI-measured fat content of patients correlated strongly with histopathology (r = 0.96; p < 0.001).
Cowin et al. compared FS/non-FS imaging, dual-echo IP/OP imaging and 1H-MRS with liver biopsy in 12 patients with hepatic steatosis [57]. Correlations were 0.935 (p < 0.0001) for FS/non- FS imaging, 0.942 (p < 0.0001) for dual-echo IP/ OP imaging and 0.928 (p < 0.0001) for 1H-MRS. In two patients, mild liver iron was present.
Fat-saturation/non-FS imaging and dual-echo IP/OP imaging were compared with liver biopsy in 52 patients with liver disease by Bahl et al. [59]. No liver iron was present. Correlations were 0.75 for FS/non-FS and 0.78 for dual-echo IP/OP imaging (p < 0.01).
McPherson et al. studied the accuracy of FS/ non-FS, dual-echo IP/OP imaging and 1H-MRS in 94 patients with a wide spectrum of liver diseases with histopathology as reference standard [58]. Correlations were 0.88 (p < 0.001) for all three techniques. Severe (grade 4) hepatic iron overload was present in two patients. For these patients, both dual-echo IP/OP measurements were aberrant, one 1H-MRS was uninterpretable and the other did not have 1H-MRS performed. However, steatosis estimates observed with FS/ non-FS imaging were consistent with histology for both patients.
MR spectroscopy
Magnetic resonance spectroscopy characterizes the molecular composition of tissue. The signals that originate from protons in different molecular structures within a selected voxel are recorded and plotted in a spectrum (Figure 3). The molecular structures are separated from each other and characterized based upon their differences in precession frequency. The signal intensity and line width of individual peaks of the spectrum give additional information regarding the relative quantity of the chemical moieties. Different nuclei can be used for liver fat quantification with MRS (e.g., protons [1H] [61], phosphor [31P] [62,63] or carbon [13C] [64]). 1H-MRS has the advantage over other metabolites that it is easier to perform, more widely available and that it provides a higher signal-to-noise ratio (SNR). The difference between MRS and MRI is that MRS does not contain information on the spatial origin of the signal. Therefore, a MRS voxel needs to be placed in the location of interest on a separately acquired anatomical MRI (Figure 5). Clinical 1H-MR spectra of the liver are measured in voxels with sizes ranging from 1 to 36 cm3 [46,50,58,65–68]. When placing the voxel, large vessels need to be avoided, as well as the liver edges (with a margin of 1–2 cm). Especially when spectra are acquired during free breathing, the chest and diaphragm can move substantially, as a result of which subcutaneous fat or lung tissue can cause artificial signal contributions.

Figure 5: Correct placement of magnetic resonance spectroscopy voxel in the liver. Large vessels and liver edges are avoided.
Clinical 1H-MRS may be performed by using a torso coil and the following acquisition parameters: TR: >3000 ms; TE: 20–35 ms; spectral width: 1000–2500 Hz; 1000–2000 data points for 16–32 acquisitions [69]. Acquisition can be performed with breath holds, with respiratory gating or during free breathing [70,71]. A single voxel is placed in the liver and the acquisition takes approximately 1–15 min, depending on the imaging sequence.
The clinical application of 1H-MRS to quantify fatty infiltration of the liver was first published by Longo et al. in 1993 [61]. Since the results from the Dallas Heart Study were published by Szczepaniak et al. in 2005 [3], 1H-MRS has often been used as reference standard for liver fat quantification in diagnostic studies [23,25–28,30,32,47,48] and as a clinical end point in observational studies and clinical trials [24,29,34]. Arguments in favor of using 1H-MRS as the reference standard are based on the fact that 1H-MRS measures fat content volumetrically and, thus, is directly comparable with results obtained from MRI techniques. By contrast, with liver biopsy, the number of fat-containing hepatocytes are examined, which does not reflect volumetric fat content. Moreover, 1H-MRS and MRI can be performed during a single MR examination and results from similar sampling volumes in the same liver region can be obtained, which is not achievable for liver biopsy [35].
For single voxel spectroscopy there are two approaches: point-resolved spectroscopy (PRESS) and stimulated-echo acquisition mode (STEAM) [37,50,61,72,73].
Point-resolved spectroscopy acquisition uses a 90–180–180° pulse sequence, with a TE larger than 35 ms. STEAM uses a 90– 90–90° pulse sequence, and allows the use of shorter echo times (typically ~10 ms). STEAM sequences are attractive for measuring peaks with short T2 values. However, the maximum amplitude for a STEAM echo is a half of that for a PRESS echo at the same TE, therefore yielding a lower signal compared with PRESS [74].
Confounders T1 & T2 effects
Each peak in a MR spectrum has its own longitudinal (T1) and transverse (T2) relaxation time, and the relative signal amplitudes of the peaks vary with the chosen TR and TE. T2 values vary across individuals, mainly due to the presence of variable liver iron content. Accurate fat quantification with 1H-MRS therefore requires individual correction for these effects [27]. T1 effects are minimized by choosing a long TR (>3000 ms). Correction for T2 effects requires acquisition of 1H-MRS at multiple echo times. The T2 value of each peak is then calculated separately, assuming monoexponential signal decay. By extrapolating the T2 decay curve to an echo time of zero, the relative proton density of each peak is estimated [27]. Some studies correct for T2 effects with fixed T2 times for water and fat [25,71]. However, this can cause inaccuracies as T2 times between subjects may vary.
J coupling
All liver fat resonances exhibit J coupling [75]. J coupling or spin–spin coupling occurs when spins within a molecule interact with each other and affect the local magnetic field around their nuclei. Spin coupling differs from chemical shift: it is independent of the magnetic field strength B0 and there is always another spin involved in the coupling. Resonances that exhibit J coupling are divided into multiple peaks with different resonance frequencies. In the liver, J coupling occurs between adjacent protons along the carbon chain. J couplings give rise to changes in peak amplitude with increasing echo time, thus modulating the apparent peak T2 value, which can result in erroneous estimation of the water/ fat ratio in the liver [76]. Hamilton et al. have shown that J-coupling effects are more prominent in PRESS than in STEAM in the liver. Therefore, STEAM sequences will give a more accurate estimation of liver fat [49].
Fat-content measurement
The area under the resonance signal of a specific metabolite is directly related to the concentration of this metabolite. Absolute quantification of peaks, however, is difficult due to differing conditions between measurements (e.g., B0 and B1 heterogeneities). Therefore, for liver fat quantification the ratio between the fat peaks between 0.5 and 3 ppm and the sum of fat and water peaks is calculated as:
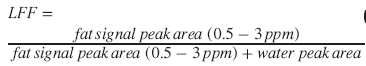 (9)
(9)
Because the fat peaks that resonate under the water peak (at 5.3 and 4.2 ppm) are not considered in this equation, an additional correction needs to be performed [77]:
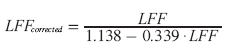 (10)
(10)
Dedicated software is available for postprocessing and analysis of 1H-MRS data, such as jMRUI with the AMARES algorithm [78], LC Model or SAGE-Spectral Analysis [69].
Advantages
1H-MRS is considered to be a very accurate noninvasive technique to quantify liver fat [20,38,69]. With 1H-MRS, the absolute liver fat concentration can be directly measured and very small amounts of liver fat (as low as 0.5%) can be detected and quantified [38].
The between-weeks reproducibility of 1H-MRS is high, with a coefficient of variation of 9.5%, repeatability coefficient of 1.3% and intraclass coefficient of 99.8% [71].
Disadvantages
The complexity of data analysis is the major limitation of 1H-MRS. A skilled operator and dedicated postprocessing software is needed to analyse and interpret the data.
Clinical MRS is typically performed in a single voxel as measuring multiple voxels is too time consuming. Additional MR images are mandatory for anatomical orientation. Although a voxel is much larger in size than a liver biopsy, unequal distribution of liver fat can still cause sampling error [71]. The quality of the MR spectrum depends on the homogeneity of the magnetic field, which can be influenced by magnetic field susceptibility effects near organ edges or foreign bodies. Timeconsuming shimming is usually required to ensure high-quality 1H-MRS data, lengthening the total examination time. Individual correction for T2 effects requires extra data acquisition at multiple echo times to measure T2 times. The spectral resolution of an MR spectrum depends on the magnetic field strength. Therefore, at clinical field strengths lower than 3T, the spectral resolution of the MR spectrum is not high enough for complete detection of the individual smaller fat peaks.
Accuracy
In 1993 and 1995, Longo et al. reported correlations of 0.68 and 0.70 between 1H-MRS and liver biopsy in two studies of 26 and 29 patients with fatty liver, respectively [50,61]. Thomsen et al. in 1994 reported a correlation of 0.9 (p < 0.001) between 1H-MRS and chemical triglyceride measurement of liver biopsy tissue in 14 patients with alcohol abuse [73]. Szczepaniak et al. demonstrated that in vivo 1H-MRS measurement of liver fat in dogs and rabbits correlated well with biochemical analysis of liver tissue (r = 0.93; p < 0.0001) [79]. In 2005, the results from the Dallas Heart Study were published (a multiethnic, probability-based population sample) where the distribution of liver fat was analyzed with 1H-MRS in 2349 participants [3]. In this study, the upper limit of normal (95th percentile) for hepatic triglyceride content in 345 healthy subjects, without identifiable risks for hepatic steatosis, was 5.56%. Since then, 1H-MRS has gradually gained acceptance as reference standard instead of liver biopsy.
Meta-analysis of 1H-MRS diagnostic accuracy studies showed a sensitivity and specificity of 89% (95% CI: 77–95%) and 92% (95% CI: 81–97%) for detecting liver fat with a threshold of 0–5% fat on liver biopsy [20]. With a threshold of 10% liver fat, sensitivity was 83% (95% CI: 62–93%) and specificity was 94% (95% CI: 80–99%). For detecting moderate amounts of liver fat (>30%), sensitivity and specificity were 73% (95% CI: 41–91%) and 96% (95% CI: 85–99%). The lower sensitivity of 1H-MRS at higher liver fat levels might be explained from the fact that with 1H-MRS, the absolute volume of liver fat is measured, whereas on liver biopsy, the percentage of hepatocytes that contain fat droplets is visually estimated by the pathologist. The latter method overestimates the liver fat volume by a factor of more than two [56,66,77,80]. If not corrected for, this discrepancy becomes more apparent at higher grades of liver fat. Krssak and d’Assignies compared 1H-MRS with visual evaluation of liver fat content on liver biopsy and with biochemical analysis [66] and semiautomatic fat vacuole segmentation [46]. In both studies, the correlation for 1H-MRS was significantly higher with biochemical analysis or semi-automatic fat vacuole segmentation than with visual evaluation of liver fat content.
In 46 patients undergoing liver resection, Van Werven et al. observed a sensitivity of 91% (95% CI: 70–98%) and a specificity of 87% (95% CI: 65–97%) for 1H-MRS at 3T MRI in identifying more than 5% fat on liver biopsy [22].
Lee et al. observed sensitivities of 80% (95% CI: 68–88%) and 73% (95% CI: 43–91%) and specificities of 80% (95% CI: 71–87%) and 79% (95% CI: 72–85%) for 1H-MRS at 3T MRI in identifying more than 5% and more than 30% fat on liver biopsy, respectively [21]. In this study, 161 consecutive potential living liver donors underwent liver biopsy, ultrasound, CT, dual-echo IP/OP MRI and 1H-MRS.
Other imaging techniques
Ultrasound
Ultrasound is widely used in clinical practice for the evaluation of the presence of hepatic steatosis, as it is a safe and inexpensive examination that is widely available. Criteria for steatosis assessment with ultrasound include: liver echogenicity, echotexture, visibility of diaphragm and large vessels and beam attenuation [40]. The positive predictive value for detecting hepatic steatosis has a broad range in literature, ranging from 59 to 100% [81–98]. The diagnostic accuracy for detecting moderate and severe degrees of hepatic steatosis (>33%) of ultrasound is good, with a sensitivity of 86% (95% CI: 78–91%) and a specificity of 85% (95% CI: 77–91%). For detection of liver fat with a lower threshold (>0–5% liver fat), the accuracy is lower with a sensitivity of 73% (95% CI: 62–82%) and a specificity of 84% (95% CI: 76–90%) [20].
Evaluation with ultrasound, however, is qualitative, operator dependent and has a poor reproducibility. Therefore, ultrasound is not the preferred imaging technique for the follow-up of hepatic steatosis or when exact quantification of the amount of hepatic steatosis is required.
Computed tomography
CT attenuation is related to liver fat content and therefore CT allows for quantitative and qualitative evaluation of hepatic steatosis. The accuracy of CT for assessing hepatic steatosis has been investigated for unenhanced CT [13,14,16,94,99–106], contrast-enhanced CT [14,99,100] and dual-energy CT [107]. Kodama et al. compared unenhanced with enhanced CT and found that unenhanced CT performed better than enhanced CT scans for prediction of pathologic fat content [100]. For examination of the degree of hepatic steatosis, the Hounsfield units (HU) are measured in the liver. Preferably, the attenuation value of the spleen is used as an internal reference by calculating liver minus spleen HU values or the liver-to-spleen ratio. When liver HU only is used, the calibration of the CT scanner or the amount of subcutaneous fat can influence the result and thus hamper comparison between different patients and scanners. The specificity of CT for detecting liver fat with liver biopsy as the reference standard in diagnostic accuracy studies is high, ranging from 88 to 95%. The sensitivity for detecting different degrees of hepatic steatosis, however, is much lower, ranging from 46 to 72% [20]. Other drawbacks are the radiation exposure and susceptibility to confounding effects due to cirrhosis or depositional diseases (e.g., glycogen, iron and amyloid accumulation) [69].
Summary
Several MR-based techniques have the ability to detect and quantify fat in the liver. Each technique has important advantages and disadvantages.
Dual-echo IP/OP imaging is a fast, easy-toperform and widely available technique, without complicated postprocessing, that allows for fat quantification of the entire liver. Limitations, however, are the fat–water signal dominance ambiguity, T2* effects and fat–fat interference effects. Accuracy of dual-echo imaging is high in the absence of liver iron accumulation.
Multiecho techniques correct for T2* and fat–fat interference effects and have a higher accuracy than dual-echo IP/OP imaging, but require more complex postprocessing. All studies that investigate the diagnostic accuracy of multiecho techniques for liver fat quantification have used 1H-MRS as reference standard.
Frequency-selective FS imaging enables selective suppression of fat. Although few clinical studies on the diagnostic accuracy of frequencyselective FS imaging for liver steatosis quantification have been published, FS imaging could have benefits over dual-echo IP/OP imaging because it has less susceptibility to T2* effects. FS sequences, however, are very sensitive to B0 and B1 heterogeneities.
Magnetic resonance spectroscopy characterizes the molecular composition of liver tissue. 1H-MRS has a high diagnostic accuracy for liver fat quantification, and is increasingly being used as the reference standard instead of liver biopsy. With 1H-MRS, a spatially localized sequence, such as PRESS or STEAM, is used to obtain data within a manually placed voxel. The accuracy of 1H-MRS is improved by correcting for T2 decay of individual frequency peaks by obtaining multiecho spectra. Analysis of MR spectra is complex and requires dedicated postprocessing software.
Ultrasound has a high accuracy for detecting moderate and severe grades of liver steatosis. For lower amounts of liver fat, ultrasound is less accurate. Ultrasound is widely available and is relatively inexpensive. Evaluation of liver fat content with ultrasound, however, is qualitative in nature and is operator dependent.
For CT, the sensitivity to detect liver steatosis is moderate, and the specificity is good. Radiation exposure and susceptibility to confounding effects makes CT a less attractive imaging modality for the evaluation of liver steatosis.
Conclusion & future perspective
Liver fat quantification has become important clinically due to the rapidly increasing prevalence of NAFLD. There is a need for an accurate noninvasive test that can detect, quantify and monitor liver steatosis. Over the last two decades a major step has been made in the development and evaluation of MR-based methods for liver fat quantification. MR-based methods have been demonstrated to outweigh CT and ultrasound with respect to their ability to detect and quantify hepatic steatosis. 1H-MRS is now increasingly being used as reference standard in clinical trials, observational studies and diagnostic accuracy studies. Surprisingly, until recently only a small number of human studies were published that investigated the diagnostic accuracy of 1H-MRS compared with liver histopathology. The latest publications on this topic show that MRI methods, especially multiecho chemicalshift imaging, have a comparable accuracy as 1H-MRS. Until now, MR-based techniques for liver fat quantification are still mainly used as a research tool in tertiary centers, and are not yet ready for widespread implementation in routine clinical practice. Future research should, therefore, focus on standardization of the techniques to improve reproducibility and comparability of results from different centers. The role of MR-based techniques as the reference standard for liver fat detection and quantification needs to be further established and agreed upon. Finally, the biggest challenge in the near future will be to convince clinicians of the benefits of MR-based techniques for liver fat quantification over liver biopsy, ultrasound and CT, and to implement the techniques in routine clinical practice.
Financial & competing interests disclosure
This work was supported by a research grant received from the Nuts Ohra Foundation (Amsterdam, The Netherlands). The Nuts Ohra Foundation was not involved in preparation of this manuscript. The authors have no other relevant affiliations or financial involvement with any organization or entity with a financial interest in or financial conflict with the subject matter or materials discussed in the manuscript apart from those disclosed.
No writing assistance was utilized in the production of this manuscript.
References
Papers of special note have been highlighted as:
• of interest
• • of considerable interest
- Bellentani S, Bedogni G, Miglioli L, Tiribelli C: The epidemiology of fatty liver. Eur. J. Gastroenterol. Hepatol. 16(11), 1087–1093 (2004).
- Browning JD, Szczepaniak LS, Dobbins R et al.: Prevalence of hepatic steatosis in an urban population in the United States: impact of ethnicity. Hepatology 40(6), 1387–1395 (2004).
- Szczepaniak LS, Nurenberg P, Leonard D et al.: Magnetic resonance spectroscopy to measure hepatic triglyceride content: prevalence of hepatic steatosis in the general population. Am. J. Physiol. Endocrinol. Metab. 288(2), E462–E468 (2005).
- Williams CD, Stengel J, Asike MI et al.: Prevalence of nonalcoholic fatty liver disease and nonalcoholic steatohepatitis among a largely middle-aged population utilizing ultrasound and liver biopsy: a prospective study. Gastroenterology 140(1), 124–131 (2011).
- Ratziu V, Bellentani S, Cortez-Pinto H, Day C, Marchesini G: A position statement on NAFLD/NASH based on the EASL 2009 special conference. J. Hepatol. 53(2), 372–384 (2010).
- Vetelainen R, van VA, Gouma DJ, van Gulik TM: Steatosis as a risk factor in liver surgery. Ann. Surg. 245(1), 20–30 (2007).
- Stepanova M, Rafiq N, Younossi ZM: Components of metabolic syndrome are independent predictors of mortality in patients with chronic liver disease: a population-based study. Gut 59(10), 1410–1415 (2010).
- Angulo P: Nonalcoholic fatty liver disease. N. Engl. J. Med. 346(16), 1221–1231 (2002).
- Hamer OW, Aguirre DA, Casola G, Lavine JE, Woenckhaus M, Sirlin CB: Fatty liver: imaging patterns and pitfalls. Radiographics 26(6), 1637–1653 (2006).
- Brunt EM: Alcoholic and nonalcoholic steatohepatitis. Clin. Liver Dis. 6(2), 399–420, vii (2002).
- Wong VW, Wong GL, Choi PC et al.: Disease progression of non-alcoholic fatty liver disease: a prospective study with paired liver biopsies at 3 years. Gut 59(7), 969–974 (2010).
- Cobbold JF, Patel JH, Goldin RD et al.: Hepatic lipid profiling in chronic hepatitis C: an in vitro and in vivo proton magnetic resonance spectroscopy study. J. Hepatol. 52(1), 16–24 (2010).
- Iwasaki M, Takada Y, Hayashi M et al.: Noninvasive evaluation of graft steatosis in living donor liver transplantation. Transplantation 78(10), 1501–1505 (2004).
- Kim DY, Park SH, Lee SS et al.: Contrastenhanced computed tomography for the diagnosis of fatty liver: prospective study with same-day biopsy used as the reference standard. Eur. Radiol. 20(2), 359–366 (2009).
- Ploeg RJ, D’Alessandro AM, Knechtle SJ et al.: Risk factors for primary dysfunction after liver transplantation – a multivariate analysis. Transplantation 55(4), 807–813 (1993).
- Yamashiki N, Sugawara Y, Tamura S et al.: Noninvasive estimation of hepatic steatosis in living liver donors: usefulness of visceral fat area measurement. Transplantation 88(4), 575–581 (2009).
- Cadranel JF, Rufat P, Degos F: Practices of liver biopsy in France: results of a prospective nationwide survey. For the Group of Epidemiology of the French Association for the Study of the Liver (AFEF). Hepatology 32(3), 477–481 (2000).
- Poynard T, Ratziu V, Bedossa P: Appropriateness of liver biopsy. Can. J. Gastroenterol. 14(6), 543–548 (2000).
- Bravo AA, Sheth SG, Chopra S: Liver biopsy. N. Engl. J. Med. 344(7), 495–500 (2001).
- Bohte AE, Van Werven JR, Bipat S, Stoker J: The diagnostic accuracy of US, CT, MRI and 1H-MRS for the evaluation of hepatic steatosis compared with liver biopsy: a meta-analysis. Eur. Radiol. 21(1), 87–97 (2011).
- Lee SS, Park SH, Kim HJ et al.: Non-invasive assessment of hepatic steatosis: prospective comparison of the accuracy of imaging examinations. J. Hepatol. 52(4), 579–585 (2010).
- Van Werven JR, Marsman HA, Nederveen AJ et al.: Assessment of hepatic steatosis in patients undergoing liver resection: comparison of US, CT, T1-weighted dual-echo MR imaging, and point-resolved 1H MR spectroscopy. Radiology 256(1), 159–168 (2010).
- Borra RJ, Salo S, Dean K et al.: Nonalcoholic fatty liver disease: rapid evaluation of liver fat content with in-phase and out-of-phase MR imaging. Radiology 250(1), 130–136 (2009).
- Gastaldelli A, Harrison S, Belfort-Aguiar R et al.: Pioglitazone in the treatment of NASH: the role of adiponectin. Aliment. Pharmacol. Ther. 32(6), 769–775 (2010).
- Guiu B, Loffroy R, Petit JM et al.: Mapping of liver fat with triple-echo gradient echo imaging: validation against 3.0-T proton MR spectroscopy. Eur. Radiol. 19(7), 1786–1793 (2009).
- Guiu B, Petit JM, Loffroy R et al.: Quantification of liver fat content: comparison of triple-echo chemical shift gradient-echo imaging and in vivo proton MR spectroscopy. Radiology 250(1), 95–102 (2009).
- Guiu B, Petit JM, Loffroy R et al.: Liver methylene fraction by dual- and triple-echo gradient-echo imaging at 3.0T: correlation with proton MR spectroscopy and estimation of robustness after SPIO administration. J. Magn Reson. Imaging 33(1), 119–127 (2011).
- Irwan R, Edens MA, Sijens PE: Assessment of the variations in fat content in normal liver using a fast MR imaging method in comparison with results obtained by spectroscopic imaging. Eur. Radiol. 18(4), 806–813 (2008).
- Jonker JT, Wang Y, de HW et al.: Pioglitazone decreases plasma cholesteryl ester transfer protein mass, associated with a decrease in hepatic triglyceride content, in patients with Type 2 diabetes. Diabetes Care 33(7), 1625–1628 (2010).
- Kim H, Taksali SE, Dufour S et al.: Comparative MR study of hepatic fat quantification using single-voxel proton spectroscopy, two-point dixon and threepoint IDEAL. Magn. Reson. Med. 59(3), 521–527 (2008).
- Kotronen A, Peltonen M, Hakkarainen A et al.: Prediction of non-alcoholic fatty liver disease and liver fat using metabolic and genetic factors. Gastroenterology 137(3), 865–872 (2009).
- O’Regan DP, Callaghan MF, Wylezinska- Arridge M et al.: Liver fat content and T2*: simultaneous measurement by using breath-hold multiecho MR imaging at 3.0 T – feasibility. Radiology 247(2), 550–557 (2008).
- Schwimmer JB, Middleton MS, Deutsch R, Lavine JE: A Phase 2 clinical trial of metformin as a treatment for non-diabetic paediatric non-alcoholic steatohepatitis. Aliment. Pharmacol. Ther. 21(7), 871–879 (2005).
- Visser ME, Akdim F, Tribble DL et al.: Effect of apolipoprotein-B synthesis inhibition on liver triglyceride content in patients with familial hypercholesterolemia. J. Lipid Res. 51(5), 1057–1062 (2010).
- Yokoo T, Shiehmorteza M, Hamilton G et al.: Estimation of hepatic proton-density fat fraction by using MR imaging at 3.0 T. Radiology 258(3), 749–759 (2011).
- Dixon WT: Simple proton spectroscopic imaging. Radiology 153(1), 189–194 (1984).
- Salibi N, Brown MA: Clinical MR Spectroscopy: First Principles. Wiley-Liss, Inc., NJ, USA (1998).
- Hughes Cassidy F, Yokoo T, Aganovic L et al.: Fatty liver disease: MR imaging techniques for the detection and quantification of liver steatosis. Radiographics 29(1), 231–260 (2009).
- Sirlin CB: Noninvasive imaging biomarkers for steatosis assessment. Liver Transpl. 15(11), 1389–1391 (2009).
- Reeder SB , Sirlin CB: Quantification of liver fat with magnetic resonance imaging. Magn Reson. Imaging Clin. N. Am. 18(3), 337–57 (2010).
- Hussain HK, Chenevert TL, Londy FJ et al.: Hepatic fat fraction: MR imaging for quantitative measurement and display – early experience. Radiology 237(3), 1048–1055 (2005).
- Qayyum A, Goh JS, Kakar S, Yeh BM, Merriman RB, Coakley FV: Accuracy of liver fat quantification at MR imaging: comparison of out-of-phase gradient-echo and fatsaturated fast spin-echo techniques – initial experience. Radiology 237(2), 507–511 (2005).
- Reeder SB, Pineda AR, Wen Z et al.: Iterative decomposition of water and fat with echo asymmetry and least-squares estimation (IDEAL): application with fast spin-echo imaging. Magn. Reson. Med. 54(3), 636–644 (2005).
- Westphalen AC, Qayyum A, Yeh BM et al.: Liver fat: effect of hepatic iron deposition on evaluation with opposed-phase MR imaging. Radiology 242(2), 450–455 (2007).
- Bydder M, Yokoo T, Hamilton G et al.: Relaxation effects in the quantification of fat using gradient echo imaging. Magn. Reson. Imaging 26(3), 347–359 (2008).
- D’Assignies G, Ruel M, Khiat A et al.: Noninvasive quantitation of human liver steatosis using magnetic resonance and bioassay methods. Eur. Radiol. 19(8), 2033–2040 (2009).
- Yokoo T, Bydder M, Hamilton G et al.: Nonalcoholic fatty liver disease: diagnostic and fat-grading accuracy of low-flip-angle multiecho gradient-recalled-echo MR imaging at 1.5 T. Radiology 251(1), 67–76 (2009).
- Reeder SB, Robson PM, Yu H et al.: Quantification of hepatic steatosis with MRI: the effects of accurate fat spectral modeling. J. Magn. Reson. Imaging 29(6), 1332–1339 (2009).
- Hamilton G, Yokoo T, Bydder M et al.: In vivo characterization of the liver fat 1H MR spectrum. NMR Biomed. DOI: 10.1002/nbm.1622 (2010) (Epub ahead of print).
- Longo R, Pollesello P, Ricci C et al.: Proton MR spectroscopy in quantitative in vivo determination of fat content in human liver steatosis. J. Magn. Reson. Imaging 5(3), 281–285 (1995).
- Hines CD, Yu H, Shimakawa A et al.: Quantification of hepatic steatosis with 3-T MR imaging: validation in ob/ob mice. Radiology 254(1), 119–128 (2010).
- Liu CY, McKenzie CA, Yu H, Brittain JH, Reeder SB: Fat quantification with IDEAL gradient echo imaging: correction of bias from T1 and noise. Magn. Reson. Med. 58(2), 354–364 (2007).
- Reeder SB, McKenzie CA, Pineda AR et al.: Water-fat separation with IDEAL gradientecho imaging. J. Magn. Reson. Imaging 25(3), 644–652 (2007).
- Yu H, McKenzie CA, Shimakawa A et al.: Multiecho reconstruction for simultaneous water-fat decomposition and T2* estimation. J. Magn. Reson. Imaging 26(4), 1153–1161 (2007).
- Bley TA, Wieben O, Francois CJ, Brittain JH, Reeder SB: Fat and water magnetic resonance imaging. J. Magn. Reson. Imaging 31(1), 4–18 (2010).
- Cotler SJ, Guzman G, Layden-Almer J, Mazzone T, Layden TJ, Zhou XJ: Measurement of liver fat content using selective saturation at 3.0 T. J. Magn. Reson. Imaging 25(4), 743–748 (2007).
- Cowin GJ, Jonsson JR, Bauer JD et al.: Magnetic resonance imaging and spectroscopy for monitoring liver steatosis. J. Magn. Reson. Imaging 28(4), 937–945 (2008).
- McPherson S, Jonsson JR, Cowin GJ et al.: Magnetic resonance imaging and spectroscopy accurately estimate the severity of steatosis provided the stage of fibrosis is considered. J. Hepatol. 51(2), 389–397 (2009).
- Bahl M, Qayyum A, Westphalen AC et al.: Liver steatosis: investigation of opposed-phase T1-weighted liver MR signal intensity loss and visceral fat measurement as biomarkers. Radiology 249(1), 160–166 (2008).
- Delfaut EM, Beltran J, Johnson G, Rousseau J, Marchandise X, Cotten A: Fat suppression in MR imaging: techniques and pitfalls. Radiographics 19(2), 373–382 (1999).
- Longo R, Ricci C, Masutti F et al.: Fatty infiltration of the liver. Quantification by 1H localized magnetic resonance spectroscopy and comparison with computed tomography. Invest. Radiol. 28(4), 297–302 (1993).
- Angus PW, Dixon RM, Rajagopalan B et al.: A study of patients with alcoholic liver disease by 31P nuclear magnetic resonance spectroscopy. Clin. Sci. 78(1), 33–38 (1990).
- Sevastianova K, Hakkarainen A, Kotronen A et al.: Nonalcoholic fatty liver disease: detection of elevated nicotinamide adenine dinucleotide phosphate with in vivo 3.0-T 31P MR spectroscopy with proton decoupling. Radiology 256(2), 466–473 (2010).
- Petersen KF, West AB, Reuben A, Rothman DL, Shulman GI: Noninvasive assessment of hepatic triglyceride content in humans with 13C nuclear magnetic resonance spectroscopy. Hepatology 24(1), 114–117 (1996).
- Friedrich-Rust M, Muller C, Winckler A et al.: Assessment of liver fibrosis and steatosis in PBC with fibroscan, MRI, MRspectroscopy, and serum markers. J. Clin. Gastroenterol. 44(1), 58–65 (2009).
- Krssak M, Hofer H, Wrba F et al.: Non-invasive assessment of hepatic fat accumulation in chronic hepatitis C by 1H magnetic resonance spectroscopy. Eur. J. Radiol. 74(3), e60–e66 (2009).
- Orlacchio A, Bolacchi F, Cadioli M et al.: Evaluation of the severity of chronic hepatitis C with 3-T 1H-MR spectroscopy. AJR Am. J. Roentgenol. 190(5), 1331–1339 (2008).
- Orlacchio A, Bolacchi F, Angelico M et al.: In vivo, high-field, 3-Tesla 1H MR spectroscopic assessment of liver fibrosis in HCV-correlated chronic liver disease. Radiol. Med. 113(2), 289–299 (2008).
- Ma X, Holalkere NS, Kambadakone RA, Mino-Kenudson M, Hahn PF, Sahani DV: Imaging-based quantification of hepatic fat: methods and clinical applications. Radiographics 29(5), 1253–1277 (2009).
- Bredella MA, Ghomi RH, Thomas BJ et al.: Breath-hold 1H-magnetic resonance spectroscopy for intrahepatic lipid quantification at 3 Tesla. J. Comput. Assist. Tomogr. 34(3), 372–376 (2010).
- Van Werven JR, Hoogduin JM, Nederveen AJ et al.: Reproducibility of 3.0 Tesla magnetic resonance spectroscopy for measuring hepatic fat content. J. Magn Reson. Imaging 30(2), 444–448 (2009).
- Qayyum A: MR spectroscopy of the liver: principles and clinical applications. Radiographics 29(6), 1653–1664 (2009). nn Overview of principles and clinical applications of 1H-MRS.
- Thomsen C, Becker U, Winkler K, Christoffersen P, Jensen M, Henriksen O: Quantification of liver fat using magnetic resonance spectroscopy. Magn. Reson. Imaging 12(3), 487–495 (1994).
- Hamilton G, Middleton MS, Bydder M et al.: Effect of PRESS and STEAM sequences on magnetic resonance spectroscopic liver fat quantification. J. Magn. Reson. Imaging 30(1), 145–152 (2009).
- Oostendorp M, Engelke UF, Willemsen MA, Wevers RA: Diagnosing inborn errors of lipid metabolism with proton nuclear magnetic resonance spectroscopy. Clin. Chem. 52(7), 1395–1405 (2006).
- Stables LA, Kennan RP, Anderson AW, Gore JC: Density matrix simulations of the effects of J coupling in spin echo and fast spin echo imaging. J. Magn. Reson. 140(2), 305–314 (1999).
- Fischbach F , Bruhn H: Assessment of in vivo 1H magnetic resonance spectroscopy in the liver: a review. Liver Int. 28(3), 297–307 (2008).
- Naressi A, Couturier C, Devos JM et al.: Java-based graphical user interface for the MRUI quantitation package. MAGMA 12(2–3), 141–152 (2001).
- Szczepaniak LS, Babcock EE, Schick F et al.: Measurement of intracellular triglyceride stores by H spectroscopy: validation in vivo. Am. J. Physiol. 276(5 Pt 1), E977–E989 (1999).
- Marsman H, Matsushita T, Dierkhising R et al.: Assessment of donor liver steatosis: pathologist or automated software? Hum. Pathol. 35(4), 430–435 (2004).
- Chen C-H, Lin S-T, Yang C-C, Yeh Y-H, Kuo C-L, Nien C-K: The accuracy of sonography in predicting steatosis and fibrosis in chronic hepatitis C. Digest. Dis. Sci. 53(6), 1699–1706 (2008).
- Crum-Cianflone N, Dilay A, Collins G et al.: Nonalcoholic fatty liver disease among HIV-infected persons. J. Acquir. Immune Def. Synd. J. AIDS 50(5), 464–473 (2009).
- Dasarathy S, Dasarathy J, Khiyami A, Joseph R, Lopez R, McCullough AJ: Validity of real time ultrasound in the diagnosis of hepatic steatosis: a prospective study. J. Hepatol. 51(6), 1061–1067 (2009).
- De Korte PJ, van der Loos TL, van den Tweel JG, Cremers PT, Veldhuijzen van Zanten GO, Lustermans FA: Interpretation of a ‘bright’ liver in ultrasound examination. Neth. J. Med. 29(1), 5–7 (1986).
- De Moura AA, Cotrim HP, Barbosa DB et al.: Fatty liver disease in severe obese patients: diagnostic value of abdominal ultrasound. World J. Gastroenterol. 14(9), 1415–1418 (2008).
- Dietrich CF, Wehrmann T, Zeuzem S, Braden B, Caspary WF, Lembcke B: [Analysis of hepatic echo patterns in chronic hepatitis C]. [German]. Ultraschall in der Medizin (1), 9–14 (1999).
- Graif M, Yanuka M, Baraz M et al.: Quantitative estimation of attenuation in ultrasound video images: correlation with histology in diffuse liver disease. Invest. Radiol. 35(5), 319–324 (2000).
- Hepburn MJ, Vos JA, Fillman EP, Lawitz EJ: The accuracy of the report of hepatic steatosis on ultrasonography in patients infected with hepatitis C in a clinical setting: a retrospective observational study. BMC Gastroenterol. 5, 14, (2005).
- Hultcrantz R , Gabrielsson N: Patients with persistent elevation of aminotransferases: investigation with ultrasonography, radionuclide imaging and liver biopsy. J. Intern. Med. 233(1), 7–12 (1993).
- Joseph AE, Saverymuttu SH, al-Sam S, Cook MG, Maxwell JD: Comparison of liver histology with ultrasonography in assessing diffuse parenchymal liver disease. Clin. Radiol. 43(1), 26–31 (1991).
- Kichian K, McLean R, Gramlich LM, Bailey RJ, Bain VG: Nonalcoholic fatty liver disease in patients investigated for elevated liver enzymes. Can. J. Gastroenterol. 17(1), 38–42 (2003).
- Kim SH, Jeong ML, Jong HK et al.: Appropriateness of a donor liver with respect to macrosteatosis: application of artificial neural networks to US images – initial experience. Radiology 234(3), 793–803 (2005).
- Kutcher R, Smith GS, Sen F et al.: Comparison of sonograms and liver histologic findings in patients with chronic hepatitis C virus infection. J. Ultrasound Med. 17(5), 321–325 (1998).
- Lee JY, Kim KM, Lee SG et al.: Prevalence and risk factors of non-alcoholic fatty liver disease in potential living liver donors in Korea: a review of 589 consecutive liver biopsies in a single center. J. Hepatol. 47(2), 239–244 (2007).
- Mathiesen UL, Franzen LE, Aselius H et al.: Increased liver echogenicity at ultrasound examination reflects degree of steatosis but not of fibrosis in asymptomatic patients with mild/moderate abnormalities of liver transaminases. Digest. Liver Dis. 34(7), 516–522 (2002).
- Palmentieri B, de Sio I, La Mura V et al.: The role of bright liver echo pattern on ultrasound B-mode examination in the diagnosis of liver steatosis. Digest. Liver Dis. 38(7), 485–489 (2006).
- Saverymuttu SH, Joseph AE, Maxwell JD: Ultrasound scanning in the detection of hepatic fibrosis and steatosis. Br. Med. J. Clin. Res. Ed. 292(6512), 13–15 (1986).
- Webb M, Yeshua H, Zelber-Sagi S et al.: Diagnostic value of a computerized hepatorenal index for sonographic quantification of liver steatosis. Am. J. Roentgenol.192(4), 909–914 (2009).
- Cho CS, Curran S, Schwartz LH et al.: Preoperative radiographic assessment of hepatic steatosis with histologic correlation. J. Am. Coll. Surg. 206(3), 480–488 (2008).
- Kodama Y, Ng CS, Wu TT et al.: Comparison of CT methods for determining the fat content of the liver. AJR Am. J. Roentgenol. 188(5), 1307–1312 (2007).
- Lee SW, Park SH, Kim KW et al.: Unenhanced CT for assessment of macrovesicular hepatic steatosis in living liver donors: comparison of visual grading with liver attenuation index. Radiology 244(2), 479–485 (2007).
- Limanond P, Raman SS, Lassman C et al.: Macrovesicular hepatic steatosis in living related liver donors: correlation between CT and histologic findings. Radiology 230(1), 276–280 (2004).
- Park SH, Kim PN, Kim KW et al.: Macrovesicular hepatic steatosis in living liver donors: use of CT for quantitative and qualitative assessment. Radiology 239(1), 105–112 (2006).
- Saadeh S, Younossi ZM, Remer EM et al.: The utility of radiological imaging in nonalcoholic fatty liver disease. Gastroenterology 123(3), 745–750 (2002).
- Tobari M, Hashimoto E, Yatsuji S, Torii N, Shiratori K: Imaging of nonalcoholic steatohepatitis: advantages and pitfalls of ultrasonography and computed tomography. Intern. Med. 48(10), 739–746 (2009).
- Yoshimitsu K, Kuroda Y, Nakamuta M et al.: Noninvasive estimation of hepatic steatosis using plain CT vs. chemical-shift MR imaging: significance for living donors. J. Magn. Reson. Imaging 28(3), 678–684 (2008).
- Mendler MH, Bouillet P, Le SA et al.: Dual-energy CT in the diagnosis and quantification of fatty liver: limited clinical value in comparison to ultrasound scan and single-energy CT, with special reference to iron overload. J. Hepatol. 28(5), 785–794 (1998).
• • Meta-analysis of studies on diagnostic accuracy of radiologic modalities for evaluation of liver steatosis.
• Prospective comparison of dual- and multiecho, single-frequency and multifrequency MRI for liver fat quantification compared with 1H-magnetic resonance spectroscopy (MRS).
• • Comprehensive overview of MRI techniques for detection and quantification of liver steatosis.
• • Comprehensive overview of MRI techniques for detection and quantification of liver steatosis.
• Prospective study assessing the accuracy of dual- and multi-echo MRI for liver fat quantification compared with 1H-MRS in patients with nonalcoholic fatty liver disease; a detailed mathematical explanation of fat spectral modeling is provided in the online appendix.
• Comprehensive overview of different imaging techniques (ultrasound, CT, MRI and 1H-MRS) for quantification of liver steatosis.


