Review Article - Imaging in Medicine (2010) Volume 2, Issue 5
Optimal imaging of focal liver lesions
Giovanni Morana†1, Aleksandra Stankiewicz2, Ermanno La Torre1, Mirko Fuser3 & Christian Cugini11Radiological Department, General Hospital Ca’ Foncello, Piazza Ospedale 1, 31100 Treviso, Italy
- Corresponding Author:
- Giovanni Morana
Radiological Department
General Hospital Ca’ Foncello
Piazza Ospedale 1, 31100 Treviso, Italy
Tel: +39 042 232 2253
Fax: +39 042 232 2202
E-mail: gmorana@ulss.tv.it
Abstract
Modern diagnostic imaging allows the accurate identification of different focal liver lesions. Ultrasound and contrast-enhanced ultrasound are widely available, and contrast injection allows the classification of most lesions as benign or malignant. CT is a robust, widely available and easy-to-use imaging technique that allows studies to be conducted in uncooperative patients. Owing to different sequences and liver‑specific contrast agents, MRI is able to not only provide morphological and vascular information of the focal liver lesions, but also functional information on the capacity of the lesion to uptake the liverspecific contrast agent. The main drawback of the technique is the requirement for state-of-the-art equipment and a good knowledge of the different contrast mechanisms. Owing to the different costs and availability of the imaging techniques, their correct utilization permits a precise, accurate and fast way to gain the most significant information, thus allowing correct management of the different patients.
Keywords
benign focal liver lesion ▪ contrast agent ▪ CT ▪ liver ▪ magnetic resonance ▪ malignant focal liver lesion ▪ ultrasound
Focal liver lesions (FLL) are common in the general population and are frequently found during ultrasound examination either incidentally, in healthy subjects, in symptomatic patients and in patients with oncological history, during cancer staging or follow-up. Early detection and accurate characterization of FLLs are important for further management and treatment planning.
Imaging techniques
Modern diagnostic imaging offers sophisticated techniques providing excellent visualization of the liver and its alterations, with both morphological and functional information.
Ultrasound is a widely used method for the detection of FLLs; however, there are limitations to the conventional grayscale B-mode ultrasound, in particular, when the lesions are small (<2 cm), in the setting of cirrhosis or in patients undergoing chemotherapy. Color and power-Doppler have increased sensitivity for FLL detection compared with the conventional B-mode, but sensitivity is still inferior to contrast- enhanced CT and MRI [1]. To improve the detection and characterization of FLLs, sonography must also provide information on vascularity, exploiting differences in blood supply between normal and pathologic tissue. The introduction of microbubble contrast agents (CA) and the development of contrast-specific techniques have opened new perspectives in ultrasound of the liver.
Contrast-enhanced ultrasound (CEUS) represents a significant breakthrough in sonography, permitting a noninvasive assessment in real-time of the liver perfusion throughout the different vascular phases has led to a dramatic improvement in diagnostic accuracy of ultrasound both in detection and characterization of FLLs, as well as in the guidance and evaluation of response of therapeutic procedures. In particular, in the late phase of contrast enhancement (3–5 min after injection), it is possible to classify solid FLL as benign (most of them appearing iso- or hyper-echoic) or malignant (appearing as hypoechoic). The technique is based on a new class of intravascular microbubble agents (SonoVue®, Bracco SpA, Milan, Italy), constituted of perfluoro gases instead of air combined with multipulse scanning modes, which are sensitive to nonlinear (harmonic) responses of the microbubbles and enable tissue signal suppression [2].
CT
The advent of the multislice technique and isotropic voxel, which permits multiplanar reconstructions, have improved the spatial resolution of CT, allowing the recognition of small FLLs in difficult areas (e.g., dome of the liver, subcapsular) [3]; however, it has not significantly improved technique specificity in characterizing FLLs. According to several authors, multislice CT has a sensitivity and specificity in the diagnosis of malignant FLLs of 63 and 64% [4], and 92 and 97%, respectively [5].
CT is an extremely important instrument in cirrhotic liver evaluation, especially in patients with high body mass index, ascites or who are unable to breath-hold, owing to its speed and robustness. In order to have a diagnostic examination the correct administration and timing of contrast media is crucial, especially in the case of cirrhotic patients, where the arterial phase is crucial to allow the identification of hypervascular hepatocellular carcinoma (HCC). Contrast media administration based on a patients weight (approximately 600 mg iodine/kg of bodyweight), high iodine content of the contrast media (350–400 mgI/ml) and high injection rate (4–5 ml/s) are crucial to achieve a good contrast enhancement [6–8]. Correct timing can be obtained within a region of interest in the abdominal aorta and a threshold of 100 Hounsfield units, with a delay of approximately 18 s after the threshold has been reached, giving better tumor-to-liver contrast in hypervascular FLLs such as HCC [9], while the optimal hepatic enhancement in the portal phase is reached approximately 50–60 s after the threshold [10].
Low tube voltage and high tube current with multidetector CT have a better performance in the detection of hypervascular liver lesions, with a significant reduction in the effective dose to the patient [11]. At a lower kVp (80 kVp) the median photon energy is 43.7 KeV. In this situation, the iodine is better able to interact with the photon, owing to a better interaction between the energy of the photon and the energy of the K-edge of iodine (33.2 KeV). Therefore, high iodine concentration (370–400 mgI/ml) and low kVp have a significant interaction for a better identification of hypervascular FLLs. The reduction in signal-to-noise ratio caused by the lower kVp is balanced by a better interaction with the K-edge of iodine, thus these techniques can be used at least in patients with normal BMI. With dual-source CT (Somatom FLASH, Siemens, Erlangen, Germany) it is possible to utilize a different voltage in the two sources, 140 kVp and 80 kVp, thus combining the high signal-to-noise ratio with high kVp with the high contrast owing to the interaction of iodine with low kVp (‘blended CT’). Furthermore, recent developments, such as dual-source and 128-slice (and over) scanners, enable CT organ perfusion evaluation. New reconstruction algorithms allow significant reduction of the dose to the patient.
Magnetic resonance
Owing to various modalities (T1 and T2 signal intensity, diffusion-weighted imaging [DWI], dynamic contrast-enhanced imaging and hepatobiliary phase studies) magnetic resonance (MR) provides information on FLLs enabling us to obtain high sensitivity and specificity.
Dynamic contrast-enhanced MRI is a highly accurate noninvasive modality for the detection and characterization of solid FLLs and is invariably the imaging method of choice for improved differential diagnosis in cases of equivocal or indeterminate lesions on ultrasound or CT [12]. However, it is not always possible to accurately diagnose the nature of a given lesion on conventional T1-weighted (T1w) dynamic phase imaging owing to enhancement/behavior patterns overlapping between different lesion types [13]. Moreover, the frequent atypical appearance of certain lesion types may further complicate the diagnosis. The development of CAs with liver-specific properties targeted to hepatocytes (gadobenate dimeglumine [Gd-BOPTA]: MultiHance®, Bracco Spa, Milano, Italy; Gd-EOB-DTPA: Primovist, Bayer-Schering, Berlin, Germany) or Kupffer cells (superparamagnetic iron oxide [SPIO]: Endorem®, Guerbet, France) has markedly improved the accuracy of MRI for the identification and characterization of FLLs [14].
Delayed hepatobiliary phase acquisition after Gd-BOPTA (1–3 h after the injection) is useful for the improved detection of metastatic or small satellite lesions [15], as well as for better characterization of equivocal or otherwise atypical lesions on routine dynamic phase imaging [16]. Compared with SPIO CA, Gd-BOPTA has a better performance in the detection of hepatic metastases [17].
A more recent CA with liver-specific properties, which permits a dynamic study in a similar way to Gd-BOPTA, is Gd-EOB-DTPA (Primovist, Bayer-Schering, Berlin, Germany); its advantage is the earlier uptake by hepatocytes when compared with Gd-BOPTA (20 min). According to recent studies, Gd-EOB-DTPA improves the sensitivity for detection of colorectal metastases smaller than 1 cm, compared with extracellular fluid (ECF) CA (87 vs 83%) [18,19].
Superparamagnetic iron oxide CA is based on iron, which shows a T1/T2* effect. However, when injected iron is taken up by Kupffer cells and clustered inside lysosomes, the T2* effect is much more evident, while the T1 effect is lacking. Yoo et al. compared triphasic CT scanning, dynamic MRI and SPIO-enhanced MRI, and demonstrated that SPIO significantly improved the sensitivity (78–96%) in the detection of HCCs of 2 cm or less [20]. However, the use of SPIO is limited owing to the lack of dynamic information, which constitutes an important element in the differential diagnosis of FLLs.
DWI
Diffusion is random, microscopic motion of water molecules caused by thermal energy and known as Brownian motion. MR-DWI allows the measurement of the degree of diffusion in biological tissues in vivo. As this phenomenon depends on many factors (e.g., diffusivity, pseudodiffusion, macroscopic motion), an apparent diffusion coefficient (ADC) presents a scalar quantification; on the ADC maps the signal analysis is performed by positioning a ROI on the lesion being studied [21]. Moreover, the degree of diffusion weighting required for better performances has not been clearly established. Most institutions use multiple b-value sequences, more often with three b-values: 0, a low b-value (0–100) and an intermediate b-value (300–800). The use of acquisitions with different b-values in different institutions does not make it possible to compare ADC values.
However, DWI is more likely to be useful for lesion detection than characterization, as there is a large overlap between solid benign lesions and malignant lesions, but the role of characterization is open in patients who have limitations in the use of contrast media.
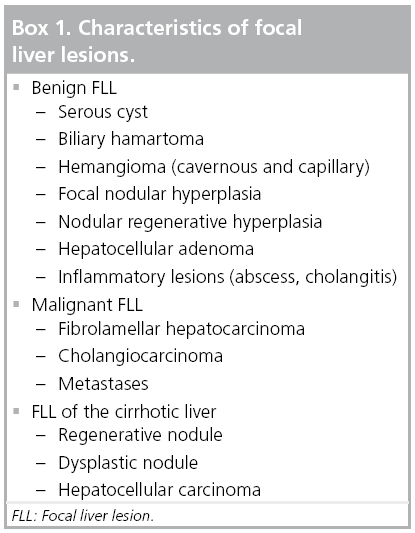
When a dynamic contrast-enhanced MR study is enriched with DWI, it provides an additional value in the detection of HCC, yielding a sensitivity of 95.2% (80.6% for conventional MR) and a specificity of 82.7% (65.4% for MR), and is most beneficial for lesions smaller than 2 cm [22]. A classification of FLL is presented in Box 1.
Cyst
Simple hepatic cysts are very common lesions, occurring more often in women. They arise from the bile duct epithelium and may be solitary or multiple. The radiological appearance is very characteristic: using ultrasound, they are visualized as anechoic/hypoechoic, thin wall lesions with posterior enhancement; using CT, they are observed as well-circumscribed, homogenous lesions with an attenuation value near to that of water, which after intravenous administration of CA does not enhance. On MR T1w cysts are hypointense, while on T2w they are markedly hyperintense. On DWI, cysts typically show low signal intensity at high b-values (i.e., influence of the gradient on the DWI), with unrestricted diffusion on an ADC map.
In patients with cirrhosis, a very common appearance is a peribiliary cyst. It results from cystic dilation of the obstructed periductal glands occurring adjacent to large intrahepatic and extrahepatic bile ducts and is usually asymptomatic. On CT scans they appear as tiny cystic structures as well as tubular ones paralleling the central portal veins. On MR they are best visualized on Gd-enhanced T1w or T2w, demonstrating the same appearance as on CT [23].
Biliary hamartoma
Biliary hamartoma is a rare lesion that consists of dilated bile ducts lined by biliary epithelium and a fibrous stroma. They are believed to arise from embryonic bile ducts that fail to involute [24] and are, typically, well-circumscribed but not encapsulated. Biliary hamartomas are usually discovered incidentally and might be mistaken for hepatic metastases. On ultrasound, they can appear as either hypo- or hyper-echoic. With CEUS the lesion does not enhance significantly and appears hypoechoic in latephase imaging, simulating a malignant lesion (Figure 1A & B). On CT they are typically depicted as multiple, round, small, hypoattenuating and nonenhancing areas without a distinctive distribution pattern. On MR they are hypointense on T1w and hyperintense on T2w (Figure 1C); hamartomas have quite a uniform size and a stronger signal on T2w than hepatic metastases. Typically, most of them do not enhance after CA administration; however, some of them may demonstrate rim enhancement (Figure 1D & E ) [25]. In the hepatobiliary phase, after administration of paramagnetic liver-specific CA they do not show uptake (Figure 1F).

Figure 1: Pathologically proven biliary hamartomas. B-mode image of the liver shows isoechoic lesions (A) without a significant contrast enhancement in the parenchymal phase at contrast-enhanced ultrasound evaluation (B). These lesions appear hyperintense on T2-weighted sequence (arrow in C). On T1-weighted sequence after contrast agent liver-specific (MultiHance®, Bracco SpA, Milan, Italy) administration during arterial phase (D) the lesion shows rim enhancement, with hypointense appearance during the venous phase (E) and in the hepatobiliary phase, 2 h after contrast agent administration (F).
Hemangioma (capillary and cavernous) is the most common benign tumor of the liver, with an incidence ranging from 1 to 20%, occurring more commonly in premenopausal women [26]. Hemangioma is usually well-circumscribed and blood filled and can range in size from a few millimeters to more than 20 cm. It is frequently a solitary tumor, although multiple hemangiomas occur in approximately 10–20% of cases. They may occur conjointly with focal nodular hyperplasia (FNH) (15–20%) [27].
Hemangiomas are usually asymptomatic and liver function tests are normal. Rarely, patients present with abdominal pain and, occasionally, inf lammatory syndrome with fever, leukocytosis or thrombocytopenia and fibrinopenia or cholestasis without jaundice, associated with intratumoral hemorrhage or thrombosis; spontaneous rupture is distinctly rare [28]. Asymptomatic hemangiomas should not be treated. Most hemangiomas can be managed conservatively.
At ultrasound, hemangiomas are typically hyperechoic with sharp margins; however, large hemangiomas may present internal hypoechoic areas caused by thrombosis or fibrous changes (Figure 2A) [29]. When hemangioma demonstrates a typical appearance in a patient with no previous history of liver or oncological disease, diagnosis is certain and no further examinations are required [30]. Unfortunately, liver steatosis gives hemangioma a hypoechoic appearance, thus making it indistinguishable from other FLLs and requiring more advanced examinations [31].

Figure 2: Cavernous hemangioma. An inhomogenous isoechoic lesion on ultrasound (A) shows an early arterial peripheral nodular enhancement on contrast-enhanced ultrasound (B), with a complete fill-in at late phase (C), thus appearing isoechoic. CT image during arterial phases (D) shows peripheral globular enhancement. On magnetic resonance, cavernous hemangioma appears as a well-defined homogeneously hyperintense lesion on T2-weighted sequence (E) and shows a signal higher than the liver on apparent diffusion coefficient (F). On precontrast T1-weighted sequence, the lesion is hypointense (G). T1-weighted sequence after contrast agent liverspecific (MultiHance®, Bracco SpA, Milan, Italy) administration shows a delayed centripetal fill-in (H & I). In the hepatobiliary phase, 2 h after contrast agent administration, cavernous hemangioma appears hypointense (J).
On CEUS, hemangiomas have a characteristic enhancement pattern, similar to that seen on CT or MR: early arterial peripheral nodular enhancement during the arterial phase with delayed centripetal fill-in, which is observed in 52–88% of cases (Figure 2B) [32], while sustained enhancement in the late phase has been reported in 83–100% of cases (Figure 2C) [32]. Sensitivity, specificity and accuracy of diagnosis of hemangioma based on CEUS patterns are 88.0, 99.4 and 97.8%, respectively [33].
On unenhanced CT images hemangioma appears as a hypoattenuating well-defined mass, and after intravenous CA administration, shows sequential opacification, beginning as a globular enhanced area on the periphery of the lesion (Figure 2D) and proceeding toward the center. Fibrotic areas within the lesion remain unopacified. The time for complete contrast ‘fill-in’ depends on hemangioma’s size, ranging from 1 min to longer than 20 min [34]. During the portal-venous phase of contrast enhancement capillary hemangiomas show an attenuation equivalent to that of the aorta, remaining hyperattenuated in the distribution phase.
On MRI, hemangiomas are hyperintense (Figure 2E), and the signal intensity increases on more heavily T2w imaging [35]. It could be helpful in differentiation from other hepatic masses, which demonstrate a relative decrease in signal intensity on more heavily T2w imaging. On DWI, hemangiomas show low signal intensity at high b-values and ADC higher than that of the liver (Figure 2F) [36].
On precontrast T1w, hemangioma is most commonly seen as a well-defined, slightly hypointense mass with lobulated borders (Figure 2G). After gadolinium injection the same globular centripetal pattern of enhancement is seen (Figure 2H & I ), which is highly specific for hemangioma, compared with rim enhancement noted in metastases [35,37].
In the delayed liver-specific phase, after paramagnetic liver-specific CA administration, hemangioma tends to be hypointense compared with the surrounding liver parenchyma (Figure 2J) [38]. Owing to the lack of Kupffer cells in hemangioma, after SPIO injection the iron remains in the slow flow of the vascular network, being able to maintain both a T1/T2* effect: hemangiomas lose signal on T2w (caused by the T2* effect), while on postcontrast T1w an increase of signal intensity is observed (caused by the T1 effect of SPIO) [39].
Capillary hemangiomas are rapidly filling hemangiomas, which are usually small in size (42% of hemangiomas <1 cm in diameter). On CEUS, CT and MRI, capillary hemangiomas show immediate homogeneous enhancement in the arterial phase, thus making differentiation from other hypervascular tumors difficult. According to Kim et al., up to 83% of the smaller hemangiomas (<3 cm) show isoattenuation compared with the arterial system in all three phases of enhanced scanning [40].
Focal nodular hyperplasia is the second most common benign liver lesion, occurring in 3–5% of the population, more frequently in young women [41], developing asymptomically and often discovered incidentally. The cellular structure of FNH is similar to that of normal hepatic parenchyma, with an abnormal biliary system. It frequently contains a central fibrous scar from which fibrous bands radiate peripherically. FNH is the result of congenital vascular malformation inducing a hyperplastic process [42].
In approximately 85% of cases only a single nodule of FNH is present, usually with welldefined margins and a size of less than 5 cm, although lesions of 10 cm can be found [43]. Given the low risk of rupture, hemorrhage and malignancy, FNH is frequently left untreated with regular follow-up examinations. [44]. High concordance exists between CEUS, CT and MRI in the diagnosis of FNH [45]. On ultrasound, the lesion is mostly isoechoic (Figure 3A), with a central scar which shows a vascular signal on ultrasound Doppler (Figure 3B & 4A). At CEUS, it shows diffused enhancement during the arterial phase (Figure 3C & 4B), persisting during the latter phases (Figure 3D & 4C) with a central, hypoechoic scar. On unenhanced CT scans, FNH appears as a homogeneous isoattenuating or slightly hypoattenuating mass (Figure 4D) and after CA administration it becomes hyperattenuated during the arterial phase, showing a central hypoattenuating scar (Figure 4E). The enhancement continues in the portal-venous phase (Figure 4F), while the scar shows delayed (5–10 min) enhancement (Figure 4G) [46]. On T2w, FNH appears slightly hyperintense (Figure 3E), with a signal intensity on DWI similar to that of the liver or slightly hyperintense (Figure 3F & G ), while it is iso- or slightly hypo-intense on T1w (Figure 3H) [47]. On dynamic MRI (Figure 3I–L), FNH is markedly enhanced in the arterial phase, persists slightly hyper- or iso-intense in the portal-venous and distribution phase, while the central scar appears hypointense in the arterial and portal-venous phase, becoming hyperintense in the distribution phase. Accurate characterization of FNH is not always possible owing to atypical features (calcification, heterogenous enhancement, prominent pseudocapsule), which can occur in 10–20% of cases, and can confound the interpretation [48]. In a study by Grazioli et al., the majority (86%) of small (<3 cm) FNH did not have a visible scar on unenhanced or enhanced dynamic phase scans [49]. While the absence of a scar in small FNH cannot be considered ‘atypical’, it does make it more difficult to distinguish FNH from other hypervascular neoplasms.

Figure 3: Focal nodular hyperplasia. Ultrasound examination reveals a well-defined, slightly homogeneus lesion in S8 (A) with the typical central scar vascularization on Doppler ultrasound (B) and an intense and homogeneous enhancement in the arterial phase on contrast-enhanced ultrasound (C), persisting in the late phase (D), thus appearing isoechoic. On magnetic resonance examination, focal nodular hyperplasia appears slightly hyperintense on T2-weighted sequence (E) and diffusion-weighted imaging sequence at b 800 (F): on the apparent diffusion coefficient map the signal intensity is similar to the liver (G). On T1-weighted image focal nodular hyperplasia appears slightly hypointense to the liver and shows a marked vascularization in the arterial phase with evidence of the hypointense central scar (I). The lesion persists homogeneously and is slightly hyperintense in the venous (J) and distribution phases (K). In the hepatobiliary phase, 2 h after contrast agent administration, focal nodular hyperplasia appears hyperintense with a ‘doughnut’ appearance (L).

Figure 4: Focal nodular hyperplasia. Homogeneous slightly hypoechoic lesion of S6 on ultrasound, with a peripheral and intranodular vascularization on Doppler ultrasound (A). On contrast-enhanced ultrasound, focal nodular hyperplasia appears homogeneously hyperechoic both in the arterial phase (B) and in the late phases (C). On CT images, focal nodular hyperplasia is isodense to the liver (D) but shows a marked enhancement in the arterial (E) and venous phases (F) and becomes isodense in the latter (G). Central scar is hypointense both in the arterial (E) and venous phase (F), but shows a slight hyperintensity in the distribution phase (G).
Hepatobiliary phase imaging after Gd-BOPTA injection has a high specificity in the diagnosis of FNH, with most of the lesions showing iso- or hyper-intensity caused by the active uptake of CA (Figure 3J) [49].
As Kupffer cells are usually observed within FNH, the uptake of SPIO is common, and the lesions show significant decreases in signal intensity using SPIO enhanced-MRI [50]. However, in a comparison of 55 FNH, studied both with Gd-BOPTA and SPIO overall, typical behavior was observed for 52 out of 55 (94.5%) lesions after Gd-BOPTA and for 24 out of 39 (61.5%) visible lesions after SPIO [51].
Nodular regenerative hyperplasia (NRH) of the liver does not represent a specific entity, but is a secondary and nonspecific tissue adaptation to heterogeneous distribution of blood flow, characterized by multiple monoacinar regenerative nodules without fibrous septa. These lesions can be imaged when the nodules become confluent. NRH has an increased frequency in patients with autoimmune processes, myeloproliferative disease, massive tumor infiltration and mineral oil deposition. Clinically, NRH presents primarily with noncirrhotic portal hypertension in approximately 50% of the patients, thus management is directed primarily to portal hypertension and varicoceal bleeding. Liver failure is uncommon owing to satisfactory preservation of liver function [52]. Malignant transformation of the nodules has never been reported. On ultrasound, NRH may appear as a hyper- (53%), iso- (10%) or hypo-echoic (38%) lesion. On native CT, NRH usually appears as a homogenous iso- or hypo-attenuated lesion. After intravenous CA administration, it shows a marked enhancement on both arterial- and portal-venous phases [53].
On unenhanced MRI, NRH is hyperintense on T1w and hypo- to iso-intense on T2w. After intravenous administration of ECF CA the lesion appears hyperintense during the arterial phase and iso- or slightly hyper-intense in the portal and equilibrium phases [54], while during the liver-specific phase after Gd-BOPTA or Gd-EOB-DPTA administration it shows hyperintensity and prolonged enhancement [53].
Hepatocellular adenoma (HA) is a benign neoplasm that is typically found in women with a history of oral contraceptive use, men receiving anabolic steroid therapy or patients with storage disease [55,56]. It consists of plates or cords of cells that are larger than normal hepatocytes and contain large amounts of glycogen and lipid. Evidence of lipids on CT or MRI can be suggestive in diagnosing HA. The plates are separated by dilated sinusoids, which are thin-walled capillaries perfused by arterial pressure, while a portal-venous supply is lacking. A tumor capsule is absent or incomplete. Kupffer cells are often found, but in reduced numbers and with little or no function. Even though HA have functioning hepatocytes, they lack bile ducts, a key histologic feature that helps distinguish HA from FNH [57].
Most patients are asymptomatic with normal liver function. Large HA may cause a sensation of right upper quadrant fullness or discomfort. The classic clinical manifestation of HA is spontaneous rupture or hemorrhage, especially when there are large and multiple adenomas, leading to acute abdominal pain and possibly progressing to hypotension or even death [58], thus giving clinical indication to surgical resection when HA is larger than 5 cm. It is reported that 5% of HA transform to HCC [59].
Under diagnostics imaging, HA have a wide variety of appearances. On ultrasound they appear as well-defined solitary or multiple masses showing variable echogenicity (iso- to hypo-) depending on the size and lipid content. When large, they can be inhomogeneous owing to the presence of hemorrhage and necrosis (Figure 5A) [60]. CEUS characteristics are relatively nonspecific, however, smaller lesions are likely to have homogeneous enhancement whereas the larger ones present an inhomogeneous pattern (Figure 5B) [61]. A third have a peripheral rim corresponding to a fibrous capsule [62]. In the late phase after SonoVue administration approximately two-thirds of adenomas show a slight hypoechogenicity (Figure 5C) [63].

Figure 5: Pathologically proven hepatocellular adenoma. An ill-defined hypoechoic mass in S2/S3 with slight contrast enhancement after administration of a contrast agent on contrast-enhanced ultrasound in the periphery of the lesion during the arterial phases (A), which increases in the portal (B) and late phase (C). A central hypoechoic component can be appreciated owing to previous hemorrhage. The hemorrhage is hyperintense on the T2-weighted sequence, while the periphery of the lesion is isointense (D). On diffusion-weighted imaging at b 0 (E) and the apparent diffusion coefficient map (F), hepatocellular adenoma shows a different signal intensity caused by the different hemorrhagic components. On T1-weighted unenhanced images, hepatocellular adenoma is slightly hypointense in the periphery while the central hemorrhagic component has a different signal intensity (hyper or hypo), caused by the different hemorrhagic components (G). After injection of liver-specific paramagnetic contrast agents (MultiHance®, Bracco SpA, Milan, Italy), the periphery of the lesion is markedly hypervascular in the arterial phase (H), with a washout in the portal phase (I). In the hepatobiliary phase, 2 h after contrast agent administration, the hepatocellular adenoma appears hypointense (J).
On native CT images, adenomas show hypodensity, variable hyperattenuation in arterial phase and isoattenuation on portal-venous and delayed-phase images. Both CT and MRI correlate well with pathological appearances of HA [55], demonstrating fat component (10% identified by CT vs 35–77% by MRI) and hemorrhage when present [55]. On T2w 47–74% of HA are predominantly hyperintense, while the rest are iso- or hypo-intense. Most lesions are heterogeneous, demonstrating a combination of hyper- and hypo-intensity on T2w relative to hemorrhage and necrosis (Figure 5D). At DWI, HA show a signal intensity that varies from isointensity of the cellular component to high hyperintensity owing to necrosis or hemorrhage (Figure 5E & F). On T1w, small lesions have a slight hypointensity, while larger lesions show an inhomogeneous pattern caused by necrosis or hemorrhage (Figure 5G). Dynamic Gd-enhanced MRI, whether performed with ECF agents or liver-targeted agents, can demonstrate early arterial enhancement (although this is usually less marked than in cases of FNH), becoming iso- or hypo-intense in the portal-venous phase. In the case of previous hemorrhage, the arterial enhancement can be inhomogeneous (Figure 5H & I ). Hypointensity of the HA on delayed-phase images provides greater accuracy in the differential diagnosis between FNH and HA (Figure 5J); Grazioli et al. reported a sensitivity, specificity and accuracy of 96.9, 100 and 98.3%, respectively, on the differential diagnosis between FNH and HA assessing the hepatobiliary phase after Gd-BOPTA administration [51]. The reasons for the different behavior of HA after liver-specific paramagnetic contrast agent administration are not clear; however, as HA lack bile ducts [57], it can be supposed that such CA are not allowed to enter the HA cells owing to the incapacity of these cells to metobolize the CA to be eliminated with the bile, thus with a negative feedback to their entry mechanism, similar to that of bilirubin. On the contrary, other liver-specific paramagnetic CA, such as manganese (Teslascan®, GE Healthcare, Princeton, NJ, USA), are able to enter the HA cells [64], as they use other entry mechanisms, such as ion channels, which are not inhibited as they are necessary for the survival of the cell.
Finally, HA do not usually show uptake of SPIO particles, resulting in an increased tumor–liver contrast-to-noise ratio on T2w. They may show some degree of uptake [50] with a heterogeneous signal drop whose entity is usually lesser than in FNH; however, in several cases, no significant difference of signal loss was observed between FNH and HA [65].
Inflammatory lesions
Numerous inflammatory diseases of the liver are reported, showing a wide variety of radiological appearance; however, the most common inflammatory lesions are abscesses, which can be pyogenic or nonpyogenic.
A solitary pyogenic abscess has no clearcut predisposing cause, but when multiple are caused by hematogenous dissemination of either disseminated gastrointestinal infection, ascending cholangitis or superinfection of necrotic tissue. The most common bacterium is Escherichia coli, but other aerobic and anaerobic organisms can be a causative factor [66–68]. Patients may present with high fever, rigors and severe rightsided abdominal pain, or may have clinically occult (‘cold’) abscesses that manifest only as weight loss and vague abdominal pain. Hepatic biochemical abnormalities are nonspecific, including slightly elevated total bilirubin, aminotransferase levels and hypoalbuminemia.
Abscesses can differ in size: those less than 5 cm in diameter can be successfully treated with antibiotics, whereas those larger than 5 cm require image-guided percutaneous drainage. At histopathological analysis, multiple locules filled with purulent material can be observed in the abscess cavity, which is lined by pale fibrous tissue. The edges of the cavity are composed of chronic inflammatory infiltrate [69].
Ultrasound and CT examination can reliably detect more than 90% of pyogenic abscesses. On ultrasound, pyogenic microabscesses may manifest as either discrete hypoechoic nodules or areas of distorted hepatic echogenicity. Large abscesses may present heterogenous echogenicity ranging from hypo- to hyper-echoic. On CEUS, early (solid-appearing) lesions usually enhance diffusely, but heterogeneously. Mature lesions with fluid show an enhancing rim. The enhancement appears early and usually persists during the portal and late phases, with no contrast enhancement seen in the liquefied portions The internal septations also show enhancement, giving the lesion a honeycomb appearance. [61]. On contrast-enhanced CT, they appear as multiple small, well-defined hypoattenuating lesions. Abscesses typically show features of rim enhancement, enhanced internal septa, nonenhanced central necrotic areas and transient hyperenhanced liver parenchyma around the lesions (Figure 6A–C) [70]. On MRI they present variable signal intensity on T1w and T2w, depending on their protein content. Perilesional edema, characterized by subtly increased signal intensity, can be seen on T2w (Figure 6D–G) [70].

Figure 6: Pathologically proven hepatic abscess. On CT images, a pyogenic abscess appears hypodense before (A) and after administration of contrast agents with a rim enhancement in the arterial phases (B) that disappears in late phases (C). On magnetic resonance acquisition, it is hyperintense in the T2-weighted sequence with perilesional edema (D), hypointense in the T1-weighted sequence before (E) and after administration of contrast agents with evident rim enhancement (F & G).
Fibrolamellar hepatocarcinoma is a sharply defined, lobulated and nonencapsulated tumor, whose characteristic microscopic features include fibrolamellar bands of collagen and fibrocytes arranged in a lamellar pattern and in delicate bands between nets of tumor cells, which often form a central scar [71]. Typically, fibrolamellar hepatocarcinoma occurs in a noncirrhotic liver, primarily in young adults, with no clear sex predominance [72]. The a-fetoprotein (AFP) level is normal.
Using ultrasound, a large inhomogeneous hypoechoic mass with a central scar and calcifications in 40–70% can be observed. After CEUS, an inhomogeneous enhancement in the arterial phase with washout in the portal-venous phase and a hypoechoic aspect in the late phase can be appreciated [60].
On CT and MRI the majority of fibrolamellar hepatocarcinoma appear inhomogeneous, hypervascular and with a central scar in approximately 71% of the cases, with absent or minimal contrast enhancement. Calcifications are found in 68% of lesions by CT, almost always within the central scar, while hemorrhage and necrosis are rarely found. The fibrous tissue within the scar and radial septa demonstrate persistent enhancement on contrast-enhanced CT and MRI obtained 10–20 min after CA administration [71]. The hepatobiliary phase after Gd-BOPTA or Gd-EOB-DTPA administration shows an absence of uptake, with a hypointense appearance.
Cholangiocellular carcinoma (CCC) is a malignant tumor of the biliary epithelium, the second most common form of primary hepatic malignancy in adults [43]. Many patients have none of the evident etiological factors; however, CCC is associated with intrahepatic stone disease, choledochal cyst, Caroli disease and primary sclerosing cholangitis [73]. Most of these risk factors have in common a long-standing inflammation and bile duct epithelium injury. Cholangiocarcinoma is usually divided into ‘intrahepatic’ and ‘extrahepatic’, depending on the site of origin.
Intrahepatic cholangiocarcinoma (ICC) is an adenocarcinoma arising from the intrahepatic bile duct epithelium and represents 10% of all CCCs. The remaining 90% is accounted for by hilar (Klatskin’s) and main bile duct CCCs [43]. It is usually a large, firm lesion and in 10–20% of cases there are several satellite nodules around the main mass. Examination of the cut section reveals large amounts of whitish fibrous tissue and a central necrosis may be observed [74]. Microscopically, ICC has a glandular appearance, sometimes with mucin and calcification. A large desmoplastic reaction is typical for CCC [75]. Clinical signs and symptoms are usually vague before the tumor is far advanced, patients present with abdominal pain and a palpable mass in the upper abdomen. Jaundice is rarely a symptom in ICC, whereas it is common with hilar or ductal cholangiocarcinoma [75]. ICC remains a relatively uncommon tumor with an insidious onset and late presentation contributing to poor survival. Surgical resection remains the only therapeutic option. Long-term survival after resection is significantly associated with less advanced tumor stages [75].
On ultrasound scans ICC has mixed echogenicity and indefinite margins caused by infiltration. On CEUS it shows inhomogeneous enhancement, with peripheric rim and hypovascular aspects during the late phases (Figure 7A–C) [59]. On CT (Figure 7D–G), ICC shows hypoattenuation with lobular margins and mild early peripheral enhancement with inhomogeneous centripetal enhancement and pooling of CA within the lesion in delayed phase [76]. This characteristic enhancement pattern is caused by the presence of large amounts of interstitial space in the tumor’s extensive fibrous stroma. Slow diffusion of CA from the vascular space results in delayed and prolonged enhancement of the tumor, best seen 10–20 min after CA administration. Satellite nodules and biliary ductal dilation peripheral to the tumor are common features [77].

Figure 7: Pathologically proven intrahepatic cholangiocellular carcinoma. A large inhomogenous mass on ultrasound with inhomogenous enhancement in the arterial phase (A), peripherical rim and inhomogenous hypoechoic aspect in portal and late phases (B & C). The quality of ultrasound is excellent despite the high subcutaneous fat, as can be appreciated on the CT image. Intrahepatic cholangiocellular carcinoma is slightly hypodense on unenhanced CT with ill-defined margins (D), inhomogenous rim enhancement after administration of contrast agents in the arterial phase (E), which becomes isodense in the portal phase (F). The central fibrous stroma shows enhancement in the distribution phase caused by pooling of contrast agents (G). On the magnetic resonance images intrahepatic cholangiocellular carcinoma is inhomogeneously hyperintense on T2 (H) and hypointense on T1 (I). During paramagnetic contrast agent injection the lesion shows a similar pattern of contrast enhancement: peripheral enhancement in the arterial phase (J) with progressive central fill-in in the fibrotic areas during portal (K) and distribution phase (L). In the hepatobiliary phase, 2 h after administration of liver-specific paramagnetic contrast agents (MultiHance®, Bracco SpA, Milan, Italy), the periphery of the lesion is hypointense (M), while the central fibrotic areas still show contrast uptake caused by pooling.
Using MRI (Figure 7H–M), ICC has a nonspecific appearance: on T2w the signal intensity ranges from markedly increased to mildly increased relative to liver; tumors with high fibrous content tend to be hypointense on T2w. Precontrast T1w is iso- to hypo-intense [74]. The enhancement pattern is similar to that seen on CT: minimal or moderately incomplete rim enhancement at the tumor periphery on the early images with progressive central contrast enhancement in later phases [78]. Dynamic imaging with Gd-BOPTA is similar to nonspecific ECF Gd-based CA, but in the hepatobiliary phase the lesion shows contrast enhancement in the fibrotic area, with hypointensive appearance in the peripheral (vital) component of the tumor. Occasionally, some small peripheral cholangiocarcinoma with a large number of tumor cells and few interstitial fibrous tissues on dynamic MRI reveal strong enhancement of the whole tumor in the early phase [79]; owing to the presence of a desmoplastic component, even these small tumors do not show washout in the portal and interstitial phase of contrast enhancement, making differentiation from other hypervascular hepatic tumors difficult [80]. No significant uptake is observed after SPIO administration owing to the absence of Kuppfer cells [81].
Hepatic metastases are the most frequent malignancies of the liver. Lesion detection is size related, with an accepted lower threshold for detection of approximately 1 cm [82]. Unfortunately, a post-mortem assessment of their size has shown that the ratio between metastases larger than 1 cm and those smaller than 1 cm is approximately 1:1.6 for metastases of colorectal adenocarcinoma and 1:4 for other liver metastases [83]. Thus, there is a clinical need to improve the sensitivity of the different imaging techniques; however, the fact that even in oncological patients small (<1 cm) FLLs are mostly benign lesions [84], means that there is also a need to improve the specificity of the different imaging techniques, in order to avoid inappropriate management of these patients.
On ultrasound, metastases are typically hypoechoic, with an inhomogeneous appearance caused by the presence of necrosis (if large) or calcifications (e.g., colorectal metastases).
According to their pattern of enhancement after CA administration, metastases can be divided in to hypervascular (Figure 8A–K) (e.g., melanoma, sarcoma, renal cancer, breast cancer, gastrointestinal stromal tumor, thyroid cancer, carcinoid, pheochromocytoma) and hypovascular (Figure 9A–E) (prostate cancer, colorectal cancer and lung cancer). Hypervascular metastases show early intense enhancement, while in the portal phase all metastasis (hyperand hypo-vascular) show contrast washout appearing as enhancement defects on late-phase scans [61,85], although hypervascular metastases can still have visible enhancement even in the portal and distribution phase. However, recent publications have shown that with the secondgeneration ultrasound CA, more than 85% of metastases (even lesions considered hypovascular with other imaging techniques) show some early peripheral arterial enhancement, often not recognized on multiphasic CT or MRI [85,86]. On late-phase CEUS scans metastases consistently appear as marked hypoechoic lesions, making this phase the most suitable for lesion detection. In a comparative study on the detection of metastatic disease, Dietrich et al. reported that CEUS was statistically significantly superior to native ultrasound and CT in metastases detection and had a specificity of 94.4%, proving the absence of the lesion, at 3–6 month follow-up in patients with primary extrahepatic tumors [87]. Thus, a negative CEUS examination can be considered reliable to exclude the presence of metastases.

Figure 8: Pathologically proven hypervascular hepatic metastasis from kidney carcinoma. On contrast-enhanced ultrasound an early intense enhancement is evident in the arterial phase (A) with lack of washout in the portal phase (B). In the late phase (C) a complete washout can be observed, with the lesion appearing markedly hypoechoic. The lesion is slightly hyperintense on T2-weighted (D), with increasing signal intensity from a low (b = 0) (E) to high (b = 600) b-value (F). The lesion is isointense on T1-weighted fat saturation (G). During paramagnetic contrast agent injection the lesion shows a significant enhancement in the arterial phase (H) with lack of washout during the portal (I) and distribution phase (J). In the hepatobiliary phase, 2 h after administration of liver-specific paramagnetic contrast agents (MultiHance®, Bracco SpA, Milan, Italy), the lesion is hypointense (K).

Figure 9: Pathologically proven hypovascular hepatic metastasis from colon carcinoma. On contrast-enhanced ultrasound the lesion appears hypoechoic both in early (A) and late contrastografic phases (B). The lesion is slightly hypodense on unenhanced CT (C) and no significant contrast enhancement can be appreciated after administration of contrast agents both in the arterial (D) and portal phase (E).
On unenhanced CT scans, most metastases appear either hypo- or iso-attenuated relative to the surrounding normal liver. After CA administration, they may display slight peripheral enhancement with a hypoattenuating center. On the portal-venous phase, some highly vascular primary tumors may appear isoattenuated compared with normal liver.
On unenhanced MR images, metastases are usually hypointense on T1w and slightly hyperintense and/or heterogeneous on T2w images. Some hypervascular metastases tend to have higher signal intensity on T2w and may mimic hemangiomas [88]. On dynamic MRI, hypervascular lesions show a significant enhancement during the arterial phase, whereas hypovascular lesions are best imaged during the portal phase. In the portal phase these lesions usually show some rapid washout, which renders them lower in signal intensity than the surrounding normal liver parenchyma. Dynamic MRI with Gd-BOPTA or Gd-EOB-DTPA is superimposable to the patterns seen with ECF Gd-based CA. However, in the late hepatobiliary phase all metastases appear hypointense to the surrounding hyperintense liver parenchyma. There is no significant uptake of SPIO, thus the lesion appears hyperintense on T2w.
FLLs of the cirrhotic liver
Cirrhotic liver can be affected by all the lesions previously described; however, some lesions are found typically in these patients owing to the process of regeneration and degeneration of the liver tissue.
Regenerative nodules (RNs) are benign lesions that represent a response to necrosis or altered circulation, and generally have normal hepatocytes function. RNs are usually numerous and diffused throughout the liver, and are round with sharp margins; they may contain lipids or iron, thus have a different signal, especially on MR, compared with liver parenchyma.
Dysplastic nodules (DNs) show cytologic atypia, mainly as large cell changes, suggesting a genetic alteration, but do not meet the criteria for malignancy or invasion; they may be described as low-grade or high-grade according to the degree of dysplasia. These lesions may transform into HCCs. On gross section, they may be indistinguishable from RNs. According to the latest guidelines from the American Association for the Study of Liver Diseases, DNs should not be treated or managed as cancers, and patients with known or suspected DNs should not be monitored more aggressively than patients without such nodules [89].
Hepatocellular carcinoma is the most frequent primary liver tumor (80–90%) and represents more than 5% of all cancers. HCC is the end point of a serial transformation beginning from a DN, often triggered by chronic liver inflammation and cirrhosis. Other risk factors include hemochromatosis and primary biliary cirrhosis [90]. The progression from DN to HCC implies not only morphological changes, but also vascular transformations, with the process of neoangiogenesis leading to an increased number of unpaired arteries, progressive reduction of hepatocellular function and reduction of Kupffer cell density [91]. All these changes can be visualized with modern imaging techniques. Unfortunately, such factors tend to vary from patient to patient, often making the behavior of HCC lesions difficult to predict.
On ultrasound RNs appear as discernible, small, hypoechoic FLL and after application of ultrasound CA they do not enhance or present an enhancement on spots in the arterial phase (Figure 10A–C). However, RNs greater than 2 cm in diameter might demonstrate a diffuse enhancement [60]. DNs appear hypoechoic on ultrasound; however, iso- and hyper-choic appearances have been reported. These nodules, on CEUS during the arterial phase, may demonstrate isoenhancement (Figure 11A–D), or slight hyperenhancement (Figure 12A–D) during the arterial phase, making differential diagnosis of DN and HCC difficult [92]. On unenhanced ultrasound scans small HCC appear hypoechoic, while larger ones tend to have mixed echogenicity. On CEUS, during the arterial phase, HCCs demonstrate diffused enhancement or inhomogeneous enhancement in large lesions caused by the presence of necrosis and/or hemorrhage (Figure 13A–D). At late phase a washout can be appreciated, with an hypoechoic appearance of the lesion; however, an isoechoic appearance has been described, making differential diagnosis of HCC and benign lesions difficult (Figure 14A & B).

Figure 10: Pathologically proven regenerative nodule in a cirrhotic liver. Hypoechoic lesion on B-mode (A), with slight and inhomogeneus contrast enhancement in arterial phase on contrastenhanced ultrasound (B). During the venous phases (C), the lesion shows a homogeneous enhancement with the liver. The lesion was stable at 2 years follow-up (not shown).

Figure 11: Pathologically proven low-grade displastic nodule in a cirrhotic liver. Low-grade displastic nodules appear as iso- or hypo-echoic lesions with irregular margins on B-mode (A), with a poor inhomogeneus contrast enhancement on contrast-enhanced ultrasound both in the arterial (B) and venous phase (C). In the late phase (D), the lesion persists slightly hypoechoic.

Figure 12: Pathologically proven high-grade displastic nodules in a cirrhotic liver. High-grade displastic nodules appear as slightly iso- or hypo-echoic lesions on B-mode (A), with intense and early contrast enhancement on contrast-enhanced ultrasound in the arterial phase (B), lack of washout in the venous phase (C) and homogeneous signal intensity with the liver parenchyma during the late phase (D).

Figure 13: Pathologically proven hepatocellular carcinoma in a cirrhotic liver. Hypoechoic lesion at B-mode (A) with an intense contrast enhancement in the arterial phases on contrast-enhanced ultrasound (B) and a contrast washout in the late phase (C & D). On native CT images, hepatocellular carcinoma appears as a mass isodense to the liver (E). After administration of contrast agents, there is an early homogenous contrast enhancement (F), with a central necrosis, and a washout in the late phase (G & H).

Figure 14: Hepatocellular carcinoma in a cirrhotic liver. Small hypoechoic lesion on ultrasound (A) with an intense contrast enhancement in the arterial phases on contrast-enhanced ultrasound (B) without contrast washout in the late phase (C). On native CT images (D), hepatocellular carcinoma appears as an isodense lesion with slight contrast enhancement after contrast agents (E), better appreciated in the portal phase (F). On magnetic resonance images, hepatocellular carcinoma is moderately hyperintense in T2 (G) and hypointense on T1 (H), with an increasing signal intensity on diffusion-weighted imaging from a low (b = 0) (I) to high (b = 600) (J) b-value. During paramagnetic contrast agent injection the lesion shows a significant enhancement in the arterial phase (K) with a washout and pseudocapsule enhancement during the portal (L) and distribution phase (M). In the hepatobiliary phase, 2 h after administration of liver-specific paramagnetic contrast agents (MultiHance®, Bracco SpA, Milan, Italy), the lesion is hypointense (N).
On enhanced CT RNs appear as hypoattenuated and after CA administration demonstrated enhancement similar to that of liver parenchyma, with hyperattenuated fibrous septa, when present [93]. DNs show slight hypoattenuation on unenhanced scans and after CA administration show an enhancement similar to the surrounding liver parenchyma. The typical appearance of HCC is an early enhancing mass and rapid washout in late phase (Figure 13F–H). However, small well-differentiated HCC may not show a washout in the late phase (Figure 14D–F). A capsule, if present, shows late enhancement (Figure 13H).
on T1w MRI, RNs present various signal intensities, while on T2w they are hypointense. After Gd CA injection, they show an enhancement similar to that of liver parenchyma; however, occasionally they may appear hyperintense. After SPIO administration, RNs show signal hypointensity caused by the presence of Kupffer cells. DNs demonstrate variable signal intensity on T1w (hypo, iso and hyper) and hypointensity on T2w (low grade) or slightly higher signal intensity (high grade) [91]. On Gd-enhanced MRI lowgrade DNs show enhancement similar to that of liver parenchyma (being indistinguishable from RNs), while high-grade nodules behave in a similar manner to HCCs. On T2w (Figure 14G–M) HCCs are mild to moderately hyperintense. On T1w images HCCs show a slight hypointensity, whereas increased signal intensity correlates with a more well-differentiated histologic grade [91].
Hyperintensity on T1w is related to several factors, such as fatty metamorphosis, glycogen, clear cells and copper [94]. On DWI, the lesion usually shows an increase of signal intensity at high b-values owing to the cellularity of the lesion with restricted diffusion. Dynamic T1w during the arterial phase is of utmost importance for the detection of small HCCs [92]. Typically, HCCs demonstrate arterial enhancement and venous washout, showing later hypointensity. Dynamic imaging of HCCs with Gd-BOPTA or Gd-EOBDTPA is similar to that observed with conventional CA, while delayed hepatobiliary phase imaging reveals a number of different enhancement patterns, with iso-, hypo- and hyper-intense patterns possible. With SPIO, well-differentiated HCCs may be iso- or hypo-intense compared with the surrounding liver, while poorly differentiated HCCs appear to have relatively high signal intensity, caused by the low accumulation of SPIO by HCC compared with liver parenchyma [91].
Practical guidelines
According to the most recent recommendations [95], if nodules found on ultrasound surveillance are smaller than 1 cm they should be followed with ultrasound at 3–6 month intervals, reverting to routine surveillance (6 months) if there has not been growth over a period of up to 2 years. If nodules are larger than 1 cm, further investigation with contrast-enhanced CT or MRI should be performed. The presence of typical imaging characteristics for HCC (i.e., hypervascular lesion in the arterial phase with a washout in the portal or delayed phase) make an automatic diagnosis of HCC without the need for histological confirmation, and the lesion should be treated accordingly. In the case of atypical imaging findings (i.e., hypovascularity or lack of washout), another contrast-enhanced technique should be used or a biopsy should be performed. In the case of negative findings for HCC at histology, the lesion should be followed using imaging at 3–6 month intervals until it disappears, becomes enlarged or displays imaging characteristics suggestive of HCC. If the lesion enlarges but remains atypical for HCC, a repeated biopsy is recommended.
Monitoring response to treatment
A correct approach to the treatment of HCC has to take into account not only the tumor stage (number and size of the lesions), but also liver function and physical status. According to this comprehensive staging system, many possibilities for HCC treatment are available, some of them with curative intent (surgical resection, orthotopic liver transplantation, percutaneous ablation), and others with a palliative (transarterial chemoembolization and sorafenib) or symptomatic purpose. Imaging techniques are the most useful tool in order to evaluate the response to treatment.
In the case of treatment with curative or even palliative intent, the major landmark imaging feature of HCC is the hypervascularity, and effective treatment is usually indicated by lack of vascular enhancement in the treated lesion [95]. All contrast-enhanced techniques (CEUS, CT and MR) are suitable in the assessment of tumor response; the major advantage of CEUS being that it can be performed at the bedside of the patients, soon after the ablative treatment, in order to assess if some persistence of disease is present, which can be corrected immediately [96]. In the case of multifocal disease, more panoramic techniques such as contrast-enhanced CT or MRI must be performed [95]. New techniques such as DWI have been suggested, although the dynamic enhanced with subtraction technique seems to be more accurate [97].
Comparison of different imaging techniques
It is reported that CEUS significantly improves the detection of FLLs with a sensitivity of 93% and specificity of 75% compared with unenhanced ultrasound (sensitivity 49% and specificity 25%) [98] and improved diagnostic accuracy from 37.7 and 50.9% to 85 and 79.6% for two readers compared with native ultrasound [99], therefore, decreasing recommendations for further imaging from 88 and 99.4% (two readers, ultrasound) to 3 and 18% (two readers, CEUS) [99]. Furthermore, CEUS demonstrates values similar to that of more sophisticated techniques with a sensitivity ranging from 89 to 95.5% and a specificity from 83.1 to 100% [100–102]. Thus, these data suggest that CEUS should be the initial examination in the characterization of FLLs [102]. CEUS allows us to easily classify FLLs into benign and malignant, according to their behavior in the late phase after CA administration: an iso- or hyper-echoic appearance is most likely to be observed in benign lesions (e.g., hemangioma, FNH and HA) while a hypoechoic appearance is most likely to be found in malignant lesions (CCC, metastases, HCC). Diagnostic accuracy of CEUS has been reported as 83.1% for benign lesions and 95.8% for malignant ones; with regard to single lesion characterization, values of 82.2% for hemangioma, 87.1% for FNH, 91.4% for liver metastases and 84.9% for HCCs have been reported [103]. In a multicenter approach under routine clinical conditions, CEUS was demonstrated to be of equal rank to CT scans with regard to the assessment of tumor differentiation and specification [104,105]. Other studies have shown a better performance of MRI in FLL characterization compared with multislice CT [4,106], although other authors have reported a better performance of MRI for detection, but not for characterization [107]. The use of liver-specific CA [108,109] improves the management of FLLs with a better performance in the differential diagnosis in comparison to CT both for Gd-BOPTA and Gd-EOB-DTPA.
Optimal imaging of FLL
The best approach to FLLs depends on to the clinical history of the patient.
Patients with incidental FLLs
Incidental FLLs are more and more frequently encountered in patients during workup for unrelated pathology, owing to increasing sensitivity of recent imaging techniques. The frequency of incidental FLLs is directly related to the incidence of liver tumors in the general population. After detection of an incidental FLL, the goal is to assess if diagnosis can be made based on imaging features alone or whether biopsy is required. Incidental solid FLLs are typically benign; however, a malignant one, HCC and metastases could also be detected. The most frequent benign incidental solid liver lesions are hemangioma, FNH and HA. In a study of incidental FLLs in patients with fatty liver, undetermined on native ultrasound, CEUS increased sensitivity (91.7%) and specificity (90.9%) [110]. In another study that compared the use of MRI with CEUS in incidental FLLs, sensitivity and specificity for hemangioma with MRI were 100 and 100%, respectively, and 89 and 100% with CEUS, respectively. The sensitivity and specificity for FNH was 88 and 96% with MRI, respectively, and 74 and 88% with CEUS, respectively [111]. Both CEUS and MRI have the advantage of sparing radiation exposure to patients, thus being indicated especially in young patients and women of childbearing age. Moreover, the routine use of CEUS for the characterization of FLLs provides significant cost savings [112] and is indicated in patients with low glomerular filtration rates, where the use of other CA, either iodine based or gadolinium based, must be considered as a potential risk for the patient. However, patients with high BMI can be difficult to evaluate with ultrasound, thus more robust and patient-independent techniques can be required, such as CT (in the case of older patients) or MRI (in younger patients).
Patients with oncological history
In oncologic patients, the liver is the most common target of metastatic disease and accurate detection and characterization of FLLs is prognostically fundamental during the initial staging as well as before and after preoperative chemotherapy, as it can help to identify patients who are most likely to benefit from liver surgery. As many FLLs in these patients are benign, especially if small [113], a precise and preferably noninvasive method of differentiation from malignant metastatic nodules is needed. Moreover, the continuous follow-up of cancer patients requires an easily available, reliable and cost-effective diagnostic tool for the detection and characterization of FLLs. The first step in the follow-up is still B-mode ultrasound, followed by CEUS when a focal lesion is discovered. Moreover, the high sensitivity of CEUS is able to exclude other focal lesions during the scan of the liver in the late phase, giving the technique a high negative predictive value [87]. Even if contrast-enhanced CT, owing to its wide diffusion and good sensitivity and specificity, is still the method of choice for the evaluation of oncologic patients, MRI should be considered the imaging modality of choice when characterization of FLLs is crucial for therapeutic decisions, especially when a benign liver lesion in suspected in a patient with cancer, owing to its high specificity derived from multimodality MRI (dynamic contrast imaging, liver-specific CA delayed imaging and DWI) (Figure 15A–M) [22,109].

Figure 15: Hypovascular hepatic metastasis from colon carcinoma. On ultrasound a small hypoechoic lesion can be appreciated in the left lobe (A). Both on contrast-enhanced ultrasound (B & C) and CT (D), there is no significant enhancement after administration of contrast agents. The CT image shows another small hypodense lesion in the right lobe, too small to be characterized. On magnetic resonance images the lesion in the left lobe is slightly hyperintense on T2 (E) and on the diffusion-weighted imaging images at a high b-value (b = 600) (F). The lesion is hypointense on T1 (G) and shows absent contrast enhancement after administration of contrast agents (H). The lesion in the right lobe is not clearly appreciated both on T2 (I) and diffusion-weighted images at a high b-value (b = 600) (J). The lesion is hypointense on T1 (K), does not show enhancement after contrast agent injection in the portal phase (L), but shows a homogeneous enhancement during the distribution phase (M). The lesion was interpreted as a small fibrotic hemangioma and was stable at follow-up (not shown).
Patients with cirrhosis
In patients with cirrhosis imaging protocols should be designed to show the difference in the vascular supply to the lesion to distinguish benign from malignant lesions. The most frequently used examination is conventional ultrasound; however, it is accepted that dynamic contrast-enhanced imaging techniques can establish the diagnosis of HCC in nodular lesions larger than 1 cm, demonstrating arterial hypervascularization with venous washout [114]. Thus, for better visualization and further characterization CEUS should be used as it has high sensitivity and specificity in FLL detection. It has been reported that accuracy of CEUS in the characterization of FLLs in cirrhotic patients is 96.6% (sensitivity of 96.2% and specificity of 96%), which is higher than for ultrasound (72%), Doppler ultrasound (70%), AFP levels (65.7%), combined ultrasound and Doppler ultrasound (70%) and combined ultrasound and AFP levels (90.3%) [115]. CEUS, however, does not provide a panoramic, overall view of the liver and other abdominal organs or information that is fundamental in planning the therapeutic options in a patient with HCC. In such situations, CT should be applied, which gives useful information on proper treatment and management when the lesion appearance is not questionable and definite diagnosis can be made. MRI in combination with liverspecific CA, including hepatocyte-targeted and reticuloendothelial system-targeted agents, is useful to clarify equivocal cases, owing to its ability to show changes in hepatobiliary function or Kuppfer cell content associated with malignancy. However, even optimized imaging techniques remain relatively insensitive for the detection of tiny satellite nodules associated with the main tumor [114].
Conclusion
Modern diagnostic imaging allows an accurate definition of the different FLLs. Owing to the different costs and availability of the imaging techniques, their correct utilization permits a precise, accurate and fast way to reach the most significant information, thus allowing correct management of different patients.
Future perspective
Taking a 5-year view the role of CEUS in the management of HCC will be more established and accepted, with regard to CT, more efficient low-dose protocols will enable dose-saving image studies. Furthermore, dual energy with iodine mapping as well as perfusion imaging will offer new information for a more targeted treatment of FLLs. Finally, with regard to MRI, the role of DWI will be more established, with a clearer separation between perfusion and diffusion. Furthermore, new MRI sequences, such as perfusion imaging, will enable us to obtain new information.
Financial & competing interests disclosure
The authors have no relevant affiliations or financial involvement with any organization or entity with a financial interest in or financial conflict with the subject matter or materials discussed in the manuscript. This includes employment, consultancies, honoraria, stock ownership or options, expert testimony, grants or patents received or pending, or royalties.
No writing assistance was utilized in the production of this manuscript.
References
- Morana G, Cugini C, Pozzi Mucelli R: Small liver lesions in oncologic patients: characterization with CT, MRI and contrast-enhanced US. Cancer Imaging 8(Spec No A), S132–S135 (2008).
- Dill-Macky MJ, Burns PN, Khalili K, Wilson SR: Focal hepatic masses: enhancement patterns with SH U 508A and pulse-inversion US. Radiology 222, 95–102 (2002).
- Catalano C, Laghi A, Fraioli F et al.: Pancreatic carcinoma: the role of highresolution multislice spiral CT in the diagnosis and assessment of resectability. Eur. Radiol. 13, 149–156 (2003).
- Balci NC, Befeler AS, Leiva P et al.: Imaging of liver disease: comparison between quadruple-phase multidetector computed tomography and magnetic resonance imaging. J. Gastroenterol. Hepatol. 23(10), 1466–1468 (2008).
- Marques RM, Mendonça P, Cordeiro A et al.: Focal malignant liver lesions: diagnosis by dynamic incremental CT, early phase. Eur. Radiol. 6(4), 433–438 (1996).
- Yanaga Y, Awai K, Nakaura T et al.: Optimal contrast dose for depiction of hypervascular hepatocellular carcinoma at dynamic CT using 64-MDCT. AJR Am. J. Roentgenol. 190, 1003–1009 (2008).
- Schima W, Hammerstingl R, Catalano C et al.: Quadruple-phase MDCT of the liver in patients with suspected hepatocellular carcinoma: effect of contrast material flow rate. AJR Am. J. Roentgenol. 186, 1571–1579 (2006).
- Luboldt W, Straub J, Seemann M et al.: Effective contrast use in CT angiography and dual-phase hepatic CT performed with a subsecond scanner. Invest. Radiol. 34, 751–760 (1999).
- Sultana S, Awai K, Nakayama Y et al.: Hypervascular hepatocellular carcinomas: bolus tracking with a 40-detector CT scanner to time arterial phase imaging. Radiology 243, 140–147 (2007).
- Chung YE, Kim KW, Kim JH et al.: Optimal delay time for the hepatic parenchymal enhancement at the multidetector CT examination. J. Comput. Assist. Tomogr. 30, 182–188 (2006).
- Schindera ST, Nelson RC, Mukundan S Jr et al.: Hypervascular liver tumors: low tube voltage, high tube current multi-detector row CT for enhanced detection – phantom study. Radiology 246, 125–132 (2008).
- Oliva MR, Saini S: Liver cancer imaging: role of CT, MRI, US and PET. Cancer Imaging 4(Spec No A), S42–S46 (2004).
- Hamm B, Thoeni RF, Gould RG et al.: Focal liver lesions: characterization with nonenhanced and dynamic contrast material enhanced MR imaging. Radiology 190, 417–423 (1994).
- Morana G, Grazioli L, Testoni M et al.: Contrast agents for hepatic magnetic resonance imaging. Top. Magn. Reson. Imaging 13, 117–150 (2002).
- Kim YK, Lee JM, Kim CS: Gadobenate dimeglumine-enhanced liver MR imaging: value of dynamic and delayed imaging for the characterization and detection of focal liver lesions. Eur. Radiol. 14, 5–13 (2004).
- Petersein J, Spinazzi A, Giovagnoni A et al.: Evaluation of the efficacy of gadobenate dimeglumine in MR imaging of focal liver lesions: a multicenter Phase III clinical study. Radiology 215, 727–736 (2000).
- Kim YK, Lee JM, Kim CS et al.: Detection of liver metastases: gadobenate dimeglumine-enhanced three-dimensional dynamic phases and one-hour delayed phase MR imaging versus superparamagnetic iron oxide-enhanced MR imaging. Eur. Radiol. 15, 220–228 (2005).
- Seale M, Catalano OA, Saini S et al.: Hepatobiliary-specific MR contrast agents: role in imaging the liver and biliary tree. Radiographics 29, 1725–1748 (2009).
- Zech CJ, Herrman KA, Reiser MF, Schoenberg SO: MR imaging in patients with suspected liver metastases: value of liver-specific contrast agent Gd-EOB-DTPA. Magn. Reson. Med. Sci. 6, 43–52 (2007).
- Yoo HJ, Lee JM, Lee JY et al.: Additional value of SPIO-enhanced MR imaging for the noninvasive imaging diagnosis of hepatocellular carcinoma in cirrhotic liver. Invest. Radiol. 44(12), 800–807 (2009).
- Colagrande S, Belli G, Politi SL et al.: The influence of diffusion- and relaxationrelated factors on signal intensity: an introductive guide to magnetic resonance diffusion-weighted imaging studies. J. Comput. Assist. Tomogr. 32, 463–474 (2008).
- Vandecaveye V, De Keyzer F, Verslype C et al.: Diffusion-weighted MRI provides additional value to conventional dynamic contrast-enhanced MRI for detection of hepatocellular carcinoma. Eur. Radiol. 19(10), 2456–2466 (2009).
- Terayama N, Matsui O, Hoshiba K et al.: Peribiliary cysts in liver cirrhosis: US, CT and MR findings. J. Comput. Assist. Tomogr. 19(3), 419–423 (1995).
- Mortele KJ, Ros PR: Cystic focal liver lesions in the adult: differential CT and MR features. Radiographics 21, 895–910 (2001).
- Semelka RC, Hussain SM, Marcos HB, Woosley JT: Biliary hamartomas: solitary and multiple lesions shown on current MR techniques including gadolinium enhancement. J. Magn. Reson. Imaging 10(2), 196–201 (1999).
- Ros PR: Benign liver lesion. In: Texbook Of Gastrointestinal Radiology.Gore RM, Levin MS, Laufer I (Eds). WB Saunders, Philadelphia, PA, USA, 1861–1896 (1994).
- Mergo PJ, Ros PR: Benign lesions of the liver. Radiol. Clin. North Am. 36(2), 319–331 (1998).
- Vilgrain V, Boulos L, Vullierme MP et al.: Imaging of atypical hemangiomas of the liver with pathologic correlation. Radiographics 20(2), 379–397 (2000).
- Park SM, Shin SM, Seo HE et al.: [A case of sclerosed hemangioma mimicking intrahepatic cholangiocarcinoma] Korean J. Gastroenterol. 54, 399–403 (2009).
- Leifer DM, Middleton WD, Teefey SA et al.: Follow-up of patients at low risk for hepatic malignancy with a characteristic hemangioma at US. Radiology 214(1), 167–172 (2000).
- Bartolotta TV, Taibbi A, Galia M et al.: Characterization of hypoechoic focal hepatic lesions in patients with fatty liver: diagnostic performance and confidence of contrast-enhanced ultrasound. Eur. Radiol. 17(3), 650–661 (2007).
- Wilson SR, Burns PN: An algorithm for the diagnosis of focal liver masses using microbubble contrast-enhanced pulseinversion sonography. AJR Am. J. Roentgenol. 186(5), 1401–1412 (2006).
- Isozaki T, Numata K, Kiba T et al.: Differential diagnosis of hepatic tumors by using contrast enhancement patterns at US. Radiology 229(3), 798–805 (2003).
- Quinn SF, Benjamin GG: Hepaticcavernous hemangiomas: simple diagnostic sign with bolus CT. Radiology 182, 545–548 (1992).
- Semelka RC, Brown ED, Ascher SM et al.: Hepatic hemangiomas: a multi-institutional study of appearance on T2-weighted and serial gadolinium-enhanced gradient-echo MR images. Radiology 192, 401–406 (1994).
- Parikh T, Drew SJ, Lee VS et al.: Focal liver lesion detection and characterization with diffusion weighted MR-imaging: comparison with standard breath-hold T2 weighted imaging. Radiology 246, 812–822 (2008).
- Soyer P, Gueye C, Somveille E et al.: MR diagnosis of hepatic metastases from neuroendocrine tumors versus hemangiomas: relative merits of dynamic gadolinium chelate-enhanced gradientrecalled echo and unenhanced spin-echo images. AJR Am. J. Roentgenol. 165(6), 1407–1413 (1995).
- Petersein J, Spinazzi A, Giovagnoni A et al.: Focal liver lesions: evaluation of the efficacy of gadobenate dimeglumine in MR imaging – a multicenter phase III clinical study. Radiology 215(3), 727–736 (2000).
- Grangier C, Tourniaire J, Mentha G et al.: Enhancement of liver hemangiomas on T1-weighted MR SE images by superparamagnetic iron oxide particles. J. Comput. Assist. Tomogr. 18(6), 888–896 (1994).
- Kim T, Federle MP, Baron RL et al.: Discrimination of small hepatic hemangiomas from hypervascular malignant tumors smaller than 3 cm with three-phase helical CT. Radiology 219, 699–706 (2001).
- Nguyen BN, Flejou JF, Terris B et al.: Focal nodular hyperplasia of the liver: a comprehensive pathologic study of 305 lesions and recognition of new histologic forms. Am. J. Surg. Pathol. 23(12), 1441–1454 (1999).
- Wanless IR, Mawdsley C, Adams R: On the pathogenesis of the focal nodular hyperplasia of the liver. Hepatology 5(6), 1194–1200 (1985).
- Craig JR, Peters RL, Edmonson HA: Tumors of the Liver and Intrahepatic Bile Ducts: Atlas of Tumor Pathology. Armed Forced Institute of Pathology, Washington, DC, USA (1989).
- Cherqui D, Rahmouni A, Charlotte F et al.: Management of focal nodular hyperplasia and hepatocellular adenoma in young women: a series of 41 patients with clinical, radiological, and pathological correlations. Hepatology 22(6), 1674–1681 (1995).
- Burns PN, Wilson SR: Focal liver masses: enhancement patterns on contrast enhanced images-concordance of US scans with CT scans and MR images. Radiology 242(1), 162–174 (2007).
- Mathieu D, Bruneton JN, Drouillard J et al.: Hepatic adenomas and focal nodular hyperplasia: dynamic CT study. Radiology 160, 53–58 (1986).
- Mathieu D, Rahmouni A, Anglade MC et al.: Focal nodular hyperplasia of the liver: assessment with contrast-enhanced TurboFLASH MR imaging. Radiology 180(1), 25–30 (1991).
- Hussain SM, Terkivatan T, Zondervan PE et al.: Focal nodular hyperplasia: findings at state of the art MR imaging, US, CT and pathologic analysis. Radiographics 24, 3–17 (2004).
- Grazioli L, Morana G, Federle MP et al.: Focal nodular hyperplasia: morphologic and functional information from MR imaging with gadobenate dimeglumine. Radiology 221(3), 731–739 (2001).
- Paley MR, Mergo PJ, Torres GM, Ros PR: Characterization of focal hepatic lesions with ferumoxides-enhanced T2-weighted MR imaging. AJR Am. J. Roentgenol. 175(1), 159–163 (2000).
- Grazioli L, Morana G, Kirchin MA et al.: MRI of focal nodular hyperplasia (FNH) with gadobenate dimeglumine (Gd-BOPTA) and SPIO (ferumoxides): an intra-individual comparison. J. Magn. Reson. Imaging 17(5), 593–602 (2003).
- Arvanitaki M, Adler M: Nodular regenerative hyperplasia of the liver. A review of 14 cases. Hepatogastroenterology 48(41), 1425–1429 (2001).
- Federle M, Jeffery B, Woodward P: Diagnostic Imaging: Abdomen. Amirsys, UT, USA , 52–56 (2004).
- Casillas C, Marti-Bonmati L, Galant J: Pseudotumoral presentation of nodular regenerative hyperplasia of the liver: imaging in five patients including MR imaging. Eur. Radiol. 7(5), 654–658 (1997).
- Grazioli L, Federle MP, Brancatelli G et al.: Hepatic adenomas: imaging and pathologic findings. Radiographics 21(4), 877–892; discussion 892–894 (2001).
- Labrune P, Trioche P, Duvaltier I et al.: Hepatocellular adenomas in glycogen storage disease type I and III: a series of 43 patients and review of the literature. J. Pediatr. Gastroenterol. Nutr. 24(3), 276–279 (1997).
- Boulahdour H, Cherqui D, Charlotte F et al.: The hot spot hepatobiliary scan in focal nodular hyperplasia. J. Nucl. Med. 34(12), 2105–2110 (1993).
- Leese T, Farges O, Bismuth H: Liver cell adenomas. A 12-year surgical experience from a specialist hepatobiliary unit. Ann. Surg. 208(5), 558–564 (1988).
- Colli A, Fraquelli M, Massironi S et al.: Elective surgery for benign liver tumours. Cochrane Database Syst. Rev. 24(1), CD005164 (2007).
- Mezzi Di Contrasto in Ecografia: Applicazioni Addominali. Quaia E (Ed.). Springer-Verlag Italia, Milan, Italy (2007).
- Morin S, Lim A, Cobbold J, Taylor-Robinson S: Use of second generation contrast enhanced ultrasound in the assessment of focal liver lesions. World J. Gastroenterol. 13(45), 5963–5970 (2007).
- Arrive L, Flejou JF, Vilgrain V et al.: Hepatic adenoma: MR findings in 51 pathologically proved lesions. Radiology 193(2), 507–512 (1994).
- Ricci P, Cantisani V, D’Onofrio M et al.: Behavior of hepatocellular adenoma on real-time low-mechanical index contrastenhanced ultrasonography with a secondgeneration contrast agent. J. Ultrasound Med. 27(12), 1719–1726 (2008).
- Sahani DV, O’Malley ME, Bhat S, Hahn PF, Saini S: Contrast-enhanced MRI of the liver with mangafodipir trisodium: imaging technique and results. J. Comput. Assist. Tomogr. 26, 216–222 (2002).
- Grandin C, Van Beers BE, Robert A et al.: Benign hepatocellular tumors: MRI after superparamagnetic iron oxide administration. J. Comput. Assist. Tomogr. 19(3), 412–418 (1995).
- Barnes PF, DeCock KM, Reynolds TN, Ralls PW: A comparison of amebic and pyogenic abscess of the liver. Medicine 66, 472–483 (1987).
- McDonald MI, Corey RG, Gallis HA, Durack DT: Single and multiple pyogenic liver abscesses: natural history, diagnosis and treatment with emphasis on percutaneous drainage. Medicine 63, 291–302 (1984).
- Liu GJ, Lu MD, Xie XY et al.: Real-time contrast-enhanced ultrasound imaging of infected focal liver lesions. J. Ultrasound Med. 27(4), 657–666 (2008).
- Lublin M, Bartlett DL, Danforth DN et al.: Hepatic abscess in patients with chronic granulomatous disease. Ann. Surg. 235, 383–391 (2002).
- Mortele K, Segatto E, Ros PR: The infected liver: radiologic-pathologic correlation. Radiographics 24, 937–955 (2004).
- Ichikawa T, Federle MP, Grazioli L et al.: Fibrolamellar hepatocellular carcinoma: imaging and pathologic findings in 31 recent cases. Radiology 213(2), 352–361 (1999).
- McLarney JK, Rucker PT, Bender GN et al.: Fibrolamellar carcinoma of the liver: radiologic–pathologic correlation. Radiographics 19(2), 453–471 (1999).
- Sherlock S, Dooley J: Disease Of The Liver And Biliary System. Blackwell, London, UK (1997).
- Vilgrain V, Van Beers BE, Flejou JF et al.: Intrahepatic cholangiocarcinoma: MRI and pathologic correlation in 14 patients. J. Comput. Assist. Tomogr. 21(1), 59–65 (1997).
- Klempnauer J, Ridder GJ, Werner M et al.: What constitutes long-term survival after surgery for hilar cholangiocarcinoma? Cancer 79(1), 26–34 (1997).
- Honda H, Onitsuka H, Yasumuri K et al.: Intrahepatic peripheral cholangiocarcinoma: two-phased dynamic incremental CT and pathologic correlation. J. Comput. Assist. Tomogr. 17, 397–402 (1993).
- Ros PR, Buck JL, Goodman ZD et al.: Intrahepatic cholangiocarcinoma: radiologic-pathologic correlation. Radiology 167, 689–693 (1988).
- Murakami T, Nakamura H, Tsuda K et al.: Contrast-enhanced MR imaging of intrahepatic cholangiocarcinoma: pathologic correlation study. J. Magn. Reson. Imaging 5(2), 165–170 (1995).
- Maetani Y, Itoh K, Watanabe C et al.: MR imaging of intrahepatic cholangiocarcinoma with pathologic correlation. AJR Am. J. Roentgenol. 176(6), 1499–1507 (2001).
- Yoshida Y, Imai Y, Murakami T et al.: Intrahepatic cholangiocarcinoma with marked hypervascularity. Abdom. Imaging 24(1), 66–68 (1999).
- Vogl TJ, Hammerstingl R, Schwarz W et al.: Magnetic resonance imaging of focal liver lesions. Comparison of the superparamagnetic iron oxide resovist versus gadolinium-DTPA in the same patient. Invest. Radiol. 31(11), 696–708 (1996).
- Wernecke K, Rummeny E, Bongartz G et al.: Detection of hepatic masses in patients with carcinoma: comparative sensitivities of sonography, CT, and MR imaging. AJR Am. J. Roentgenol. 157(4), 731–739 (1991).
- Schulz W, Borchard F: [The size of the liver metastases in a low metastatic count. A quantitative study of postmortem livers]. Rofo 156(4), 320–324 (1992).
- Schwartz L, Brody L, Brown K et al.: Prospective, blinded comparison of helical CT and CT arterial portography in the assessment of hepatic metastasis from colorectal carcinoma. World J. Surg. 30(10), 1892–1899 (2006).
- Quaia E, Calliada F, Bertolotto M et al.: Characterization of focal liver lesions with contrast-specific US modes and a sulfur hexafluoride-filled microbubble contrast agent: diagnostic performance and confidence. Radiology 232, 420–430 (2004).
- Jang HJ, Kim TK, Wilson SR: Imaging of malignant liver masses: characterization and detection. Ultrasound Q. 22, 19–29 (2006).
- Dietrich CF, Kratzer W, Strobel D et al.: Assessment of metastatic liver disease in patients with primary extrahepatic tumors by contrast-enhanced sonography versus CT and MRI. World J. Gastroenterol. 12, 1699–1705 (2006).
- Larson RE, Semelka RC, Bagley AS et al.: Hypervascular malignant liver lesions: comparison of various MR imaging pulse sequences and dynamic CT. Radiology 192(2), 393–399 (1994).
- Bruix J, Sherman M: Management of hepatocellular carcinoma. Hepatology 42, 1208–1236 (2005).
- Bruix J, Sherman M, Llovet JM et al.: Clinical management of hepatocellular carcinoma. Conclusions of the Barcelona-2000 EASL conference. European Association for the Study of the Liver. J. Hepatol. 35(3), 421–430 (2001).
- Hanna RF, Aguirre DA, Kased N et al.: Cirrhosis-associated hepatocellular nodules: correlation of histopathologic and MR Imaging features. Radiographics 28(3), 747–769 (2008).
- Krinsky GA, Lee VS, Theise ND et al.: Hepatocellular carcinoma and dysplastic nodules in patients with cirrhosis: prospective diagnosis with MR imaging and explantation correlation. Radiology 219(2), 445–454 (2001).
- Lim JH, Kim EY, Lee WJ et al.: Regenerative Nodules in liver cirrhosis: findings at CT during arterial portography and CT hepatic arteriography with histopathologic correlation. Radiology 210(2), 451–458 (1998).
- Marti-Bonmati L: MR imaging characteristics of hepatic tumors. Eur. Radiol. 7(2), 249–258 (1997).
- Bruix J, Sherman M: Management of Hepatocellular carcinoma: an update. Hepatology (2010) (In Press).
- Kim SK, Lim HK, Kim YH et al.: Hepatocellular carcinoma treated with radio-frequency ablation: spectrum of imaging findings. Radiographics 23, 107–121 (2003).
- Mannelli L, Kim S, Hajdu CH et al.: Assessment of tumor necrosis of hepatocellular carcinoma after chemoembolization: diffusion-weighted and contrast-enhanced MRI with histopathologic correlation of the explanted liver. AJR Am. J. Roentgenol. 193, 1044–1052 (2009).
- Wang WP, Wu Y, Luo Y et al.: Clinical value of contrast-enhanced ultrasonography in the characterization of focal liver lesions: a prospective multicenter trial. Hepatobiliary Pancreat. Dis. Int. 8(4), 370–376 (2009).
- Wilson SR, Jang HJ, Kim TK, Burns PN: Diagnosis of focal liver masses on ultrasonography: comparison of unenhanced and contrast-enhanced scans. J. Ultrasound Med. 26(6), 775–787 (2007).
- Bartolotta TV, Taibbi A, Midiri M et al.: Characterisation of focal liver lesions undetermined at grey-scale US: contrastenhanced US versus 64-row MDCT and MRI with liver-specific contrast agent. Radiol. Med. 115(5), 714–731 (2010).
- Strobel D, Seitz K, Blank W et al.: Contrastenhanced ultrasound for the characterization of focal liver lesions – diagnostic accuracy in clinical practice (DEGUM multicenter trial). Ultraschall. Med. 29(5), 499–505 (2008).
- Beaton C, Cochlin D, Kumar N: Contrast enhanced ultrasound should be the initial radiological investigation to characterise focal liver lesions. Eur. J. Surg. Oncol. 36(1), 43–46 (2010).
- Strobel D, Seitz K, Blank W et al.: Tumorspecific vascularization pattern of liver metastasis, hepatocellular carcinoma, hemangioma and focal nodular hyperplasia in the differential diagnosis of 1,349 liver lesions in contrast-enhanced ultrasound (CEUS). Ultraschall Med. 30(4), 376–382 (2009).
- Seitz K, Strobel D, Bernatik T et al.: Contrast-enhanced ultrasound (CEUS) for the characterization of focal liver lesions – prospective comparison in clinical practice: CEUS vs. CT (DEGUM multicenter trial). Parts of this manuscript were presented at the Ultrasound Dreiländertreffen 2008, Davos. Ultraschall. Med. 30(4), 383–389 (2009).
- Li R, Guo Y, Hua X et al.: Characterization of focal liver lesions: comparison of pulseinversion harmonic contrast-enhanced sonography with contrast-enhanced CT. J. Clin. Ultrasound 35(3), 109–117 (2007).
- Halavaara J, Breuer J, Ayuso C et al.: Liver tumor characterization: comparison between liver-specific gadoxetic acid disodiumenhanced MRI and biphasic CT – a multicenter trial. J. Comput. Assist. Tomogr. 30(3), 345–354 (2006).
- Ichikawa T, Saito K, Yoshioka N et al.: Detection and characterization of focal liver lesions: a Japanese Phase III, multicenter comparison between gadoxetic acid disodium-enhanced magnetic resonance imaging and contrast-enhanced computed tomography predominantly in patients with hepatocellular carcinoma and chronic liver disease. Invest. Radiol. 45, 133–141 (2010).
- Hammerstingl R, Huppertz A, Breuer J et al.: Diagnostic efficacy of gadoxetic acid (Primovist)-enhanced MRI and spiral CT for a therapeutic strategy: comparison with intraoperative and histopathologic findings in focal liver lesions. Eur. Radiol. 18(3), 457–467 (2008).
- Lee HY, Lee JM, Kim SH et al.: Detection and characterization of focal hepatic lesions: comparative study of MDCT and gadobenate dimeglumine-enhanced MR imaging. Clin. Imaging 32(4), 287–295 (2008).
- Wang ZL, Tang J, Weskott HP et al.: Undetermined focal liver lesions on gray-scale ultrasound in patients with fatty liver: characterization with contrast-enhanced ultrasound. J. Gastroenterol. Hepatol. 23(10), 1511–1519 (2008).
- Soussan M, Aubé C, Bahrami S et al.: Incidental focal solid liver lesions: diagnostic performance of contrast-enhanced ultrasound and MR imaging. Eur. Radiol. 20(7), 1715–1725 (2010).
- Romanini L, Passamonti M, Aiani L et al.: Economic assessment of contrast-enhanced ultrasonography for evaluation of focal liver lesions: a multicentre Italian experience. Eur. Radiol. 17(Suppl. 6), F99–F106 (2007).
- Schwartz LH, Gandras EJ, Colangelo SM et al.: Prevalence and importance of small hepatic lesions found at CT in patients with cancer. Radiology 210(1), 71–74 (1999).
- Lencioni R, Crocetti L, Della Pina MC, Cioni D: Guidelines for imaging focal lesions in liver cirrhosis. Expert Rev. Gastroenterol. Hepatol. 2(5), 697–703 (2008).
- D’Onofrio M, Faccioli N, Zamboni G et al.: Focal liver lesions in cirrhosis: value of contrast-enhanced ultrasonography compared with Doppler ultrasound and a-fetoprotein levels. Radiol. Med. 113(7), 978–979 (2008).


