Review Article - Imaging in Medicine (2012) Volume 4, Issue 6
FDG-PET/CT imaging biomarkers in head and neck squamous cell carcinoma
Vasavi Paidpally1, Alin Chirindel1, Stella Lam1, Nishant Agrawal2, Harry Quon2,3,4 & Rathan M Subramaniam*11Russel H Morgan Department of Radiology & Radiology Science, Johns Hopkins Medical Institutions, 601 North Caroline Street/JHOC 3235, Baltimore, MD 21287, USA
2Department of Otolaryngology-Head & Neck Surgery, Johns Hopkins School of Medicine, Baltimore, MD, USA
3Department of Radiation Oncology & Molecular Radiation Sciences, Johns Hopkins School of Medicine, Baltimore, MD, USA
4Department of Oncology, Johns Hopkins School of Medicine, Baltimore, MD, USA
- Corresponding Author:
- Rathan M
Subramaniam
Russel H Morgan Department of Radiology & Radiology Science
Johns Hopkins Medical Institutions
601 North Caroline Street/JHOC 3235
Baltimore, MD 21287, USA
Tel: +1 410 502 3956
Fax: +1 443 287 2933
E-mail: rsubram4@jhmi.edu
Abstract
This article discusses the value of 18F-fluoro-2-deoxyglucose PET/CT imaging biomarkers in head and neck squamous cell carcinoma. 18F-fluoro-2-deoxyglucose PET/CT is valuable at baseline staging, radiotherapy planning, therapy response assessment and in the follow-up of patients with head and neck squamous cell carcinoma. Maximum and peak standardized uptake value (SUVmax and SUVpeak), metabolic tumor volume and total lesion glycolysis are the common 18F-fluoro-2-deoxyglucose quantitative parameters that have been studied, along with qualitative assessments. These parameters will be evaluated with respect to their established or potential role as noninvasive biomarkers for patient risk stratification, treatment response and survival outcome.
Keywords
FDG ▪ head and neck squamous cell carcinoma ▪ imaging biomarkers ▪ PET/CT
Head and neck cancer is the sixth most common type of cancer, representing approximately 6% of all cases and accounting for an estimated 650,000 new cancer cases and 350,000 cancer deaths worldwide each year [1]. Cancers of the head and neck arise from the mucosa lining the oral cavity, oropharynx, hypopharynx, larynx, sinonasal tract and nasophaynx. By far the most common histological type is squamous cell carcinoma (SCC) , accounting for 95% of cases [2]. The remaining 5% are collectively referred to as non-SCCs [3]. The clinical presentation of these lesions, their treatment and prognosis are highly variable. They will depend on the tumor type, histological variant and grade, and are influenced by many clinical factors [4], including the human papillomavirus (HPV) status [5]. The overall 5-year survival for all stages is approximately 60%.
18F-fluoro-2-deoxyglucose (FDG) PET/CT is sensitive for the diagnosis and initial staging of several types of malignancies [2]. In the USA, it has become a useful diagnostic study in head and neck carcinomas since 2005 and is Medicare-approved for both for initial staging and restaging after treatment [6,7]. Combined PET/CT has improved sensitivity and specificity compared with MRI or CT alone in head and neck cancer imaging [8–10]. Moreover, various parameters derived from the extent, distribution and intensity of FDG uptake are emerging as valuable predictive factors for patient outcome in various cancers, including those originating in the lung, breast and esophagus [11,12]. In many head and neck squamous cell carcinoma (HNSCC) studies, PET/CT markers (standardized uptake value [SUV] and volumetric parameters) have been identified as valuable imaging biomarkers to assess treatment response and long-term survival [4,5, 13–16]. Accumulated data suggest that FDGPET/ CT may serve as a noninvasive method that can indirectly measure the expression of various biologic markers of tumor aggressiveness [4,17–20]. The objective of this review is to summarize the evidence for various FDG-based imaging biomarkers/parameters predicting patient outcome and therapy response in HNSCC.
Standardized uptake value
SUV is a semiquantitative measure of the normalized concentration of radioactivity in a tumor or lesion. As FDG is the most common radiotracer used clinically and reflects tumor glucose metabolism, SUV is used as a surrogate marker for tumor metabolism. The association between FDG uptake and tumor burden or stage has been well documented [21–23]. While advanced tumors tend to have higher FDG uptake (and thus higher SUV values), the impact of the SUV on treatment outcome has been observed even within a given tumor stage [21,22]. In a multivariate analysis of 58 patients with HNSCC, Halfpenny et al. demonstrated that primary tumor SUVmax >10 predicted survival, independent of the tumor stage and diameter (p = 0.002). This suggests that FDG uptake not only reflects tumor burden/stage but also expresses, at least in part, some intrinsic biologic characteristic(s) of the tumor [22].
To measure the SUV, a 2D region of interest (ROI) or 3D volume of interest (VOI) is placed over the tumor or lesion. The measured radioactivity within the ROI is normalized to the average radioactivity concentration in the body, which is approximated as the injected dose divided by patient body size, body weight or body surface area [24].
The SUV is defined as the ratio of tissue radioactivity concentration and the injected activity (at the time of injection) divided by the body weight. Some authors prefer to use lean body weight or body surface area instead of the body weight.
There are two common ways of reporting the SUV: the mean or maximum SUV of all voxels within the ROI or VOI (SUVmean and SUVmax, respectively) of a tumor.
SUVmax
SUVmax reflects the highest voxel value within the ROI or VOI. It is the most widely used parameter to measure metabolic tumor activity in oncologic FDG-PET/CT imaging. SUVmax is most conveniently measured by surrounding the target lesion with a 3D VOI. Alternatively, 2D ROIs can be drawn on multiple axial slices and interpolated to determine the highest activity within the target volume. In this way, SUVmax is independent of ROI definition but more susceptible to artifacts such as noise [25]. Currently, SUVmax is more commonly used than SUVmean, because it is less observer-dependent and more reproducible [24,26,27].
SUVmax has been extensively studied at various stages in the management of HNSCC. These include at baseline, during therapy, early and late post-therapy, and in the follow up of patients.
■ Baseline SUVmax
FDG-PET SUVmax remains a significant predictor of outcome in the modern era of multimodal therapy. The data have been relatively consistent over various studies. Many studies in the literature have shown that SUVmax is appreciably associated with advanced stage, large tumor size and poor differentiation [13,18,21–23,28–30]. However, other studies on HNSCC did not find a correlation between pretreatment SUVmax and tumor recurrence [31,32].
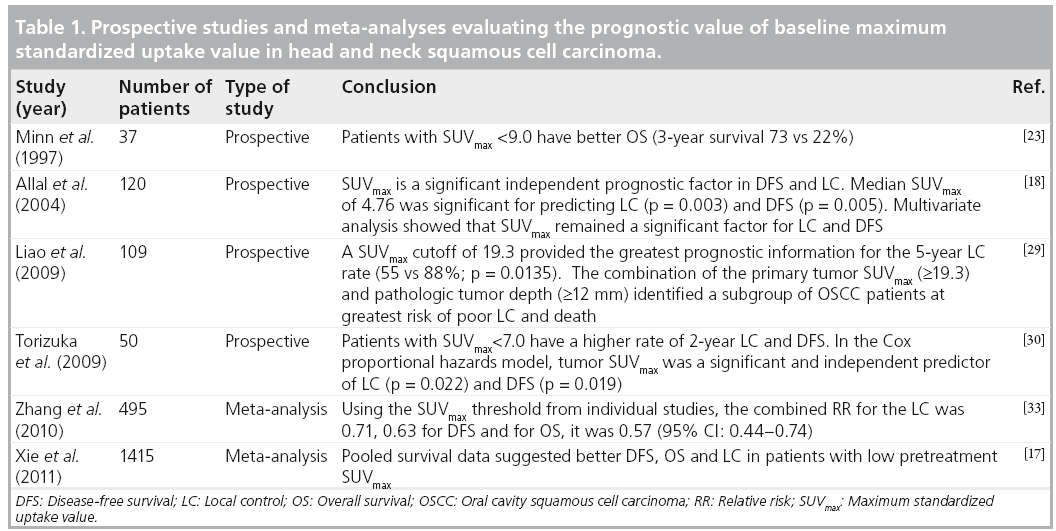
One of the earliest studies of SUVmax, as a predictor of outcome was conducted by Minn et al. [23]. They prospectively reviewed results from 37 patients with HNSCC, all of whom were treated with radiotherapy ± surgery (without chemotherapy). Results from univariate analysis showed a significant difference in survival using a SUV cutoff value of 9.0. The 3‑year diseasefree survival (DFS) was 53% for patients with SUV <9.0 compared with a 3‑year DFS of 24% for patients with SUV >9.0. In another prospective study, Allal et al. suggested that treatment of tumors with high FDG uptake (SUV >5.5) was at greater risk of failure in 63 patients treated by radiotherapy with or without chemotherapy [21]. These investigators obtained similar findings in a larger study population (n = 120) of patients who underwent radiotherapy-based treatment (n = 73). Those who underwent surgical resection (n = 47) were analyzed separately. The median follow-up time of all surviving patients was 48 months [18]. Similarly, Machtay et al. analyzed the baseline SUV in a retrospective study of 60 HNSCC patients who received radiotherapy ± chemotherapy. In their patient population, the 2‑year DFS rates were 76% in patients with SUVmax <9.0 versus 37% in those with SUVmax ≥9.0 (p = 0.007). The differences in outcome between patients with ‘low’ and ‘high’ SUV values were as dramatic as the differences seen with respect to the tumor, node and metastasis stage, suggesting that FDGPET SUVmax can potentially serve as a valuable biomarker (Figures 1 & 2) that can be used to help guide the aggressiveness of therapy in future practice [13].

Figure 1: Left base of tongue squamous cell carcinoma, stage T4N2cM0. A 62-year-old male with left base of tongue squamous cell carcinoma, infiltrating the oropharyngeal wall and left pterygoid muscle and with bilateral nodal metastases. The patient received concurrent chemoradiation therapy with complete metabolic response on follow-up 18F-fluoro-2-deoxyglucose PET/CT scans and no evidence of recurrent disease in 5 years. Staging PET/CT (A) maximum intensity projection (B) fused PET/CT demonstrates heterogeneously intense metabolic activity in the left base of tongue/oropharynx (standardized uptake value normalized to lean body mass of 5.8 and maximum standardized uptake value of 7.5) compatible with infiltrating primary tumor, as well as several additional foci of 18F-fluoro-2-deoxyglucose uptake (standardized uptake value normalized to lean body mass of 2.5 and maximum standardized uptake value of 3.3) corresponding to bilateral nodal metastases and (C) CT and volumetric PET images with standardized uptake value normalized to lean body mass of 3.0 threshold demonstrate primary metabolic tumor volume of 4.3 ml without quantifiable nodal volume for the threshold.

Figure 2: Glottic squamous cell carcinoma, stage T4aN2bM0. A 49‑year-old male presenting with hoarseness and weight loss. Direct inspection showed irregular appearing laryngeal mucosa, concerning for malignancy. The biopsy was consistent with squamous cell carcinoma, stage T4aN2bM0. The patient expired, despite treatment with neoadjuvant chemoratiation therapy. Staging PET/CT (A) maximum intensity projection (B) fused PET/CT images demonstrate an area of intense metabolic activity (standardized uptake value normalized to lean body mass of 8.7 and maximum standardized uptake value of 10.9) corresponding to an infiltrating soft tissue lesion involving both vocal cords and extending from the epiglottis down to the thyroid cartilage, consistent with a primary tumor. In addition, focal 18F-fluoro-2-deoxyglucose uptake is noted in the right neck (standardized uptake value normalized to lean body mass of 4.0 and maximum standardized uptake value of 4.2) fusing to metastatic lymphadenopathy, levels 2 and 4. (C) Fused CT and volumetric PET images (standardized uptake value normalized to lean body mass of 3.0 threshold) shows large primary metabolic tumor volume (32.9 ml) with measurable node volume of 0.9 ml.
Several studies suggest that primary tumor baseline SUVmax also has predictive value in assessing the tumor burden, lymph node involvement and local extension. In a prospective study looking at the predictive capability of SUVmax, Torizuka et al. analyzed 50 patients with head and neck cancer. When tumor SUVmax was correlated with T stage, T1–T2 tumors had significantly lower median SUVmax values than T3–T4 tumors (4.77 vs 12.54, respectively; p = 0.001). There was a significant difference between the median SUVmax of N0, compared with N1–N3 diseases (4.77 vs 11.40; p = 0.027). They also reported that patients with low SUVs (≤7.0) had significantly higher rates of local control (LC; 91 vs 55%, respectively; p = 0.0067) and DFS (91 vs 55%; p = 0.0051) at 2 years than patients with high SUVs (>7.0) [30]. Similarly, in another prospective study by Liao et al., a total of 109 HNSCC patients with pathologically positive lymph nodes were investigated [29]. The median follow-up for all patients was 26 months. They reported that primary tumor SUVmax ≥19.3 was significantly associated with poor tumor differentiation (p = 0.008), skin invasion (p = 0.047), extracapsular spread (p = 0.029) and the absence of perineural invasion (p = 0.004). The predictive value of nodal SUVmax has also been evaluated in a single-center retrospective study of 212 patients. The authors reported that primary tumor SUVmax >8.0 was predictive of worse overall survival (OS) rates (p < 0.045), while nodal SUVmax was predictive of distant recurrence at 1 year. The mean SUVmax value was 10.4 for patients with distant failure, versus 7.0 in those without (p < 0.05). Furthermore, they also observed that the lymph nodes with extracapsular extension had higher SUVs than nodes without extracapsular extension (11.0 vs 5.0, respectively; p < 0.0007) [28].
A recent meta-analysis of eight studies published between 1997 and 2009 investigated the prognostic value of SUV in a total of 495 patients diagnosed with HNSCC. The primary tumor SUV was used in all except eight patients, for whom the nodal SUV was used. SUVmax was the parameter used in six studies, whereas the remaining two studies used SUVmean. SUV thresholds across the studies ranged from 4.76 to 9.0. They reported a combined relative risk of LC from five studies as 0.71 (95% CI: 0.63–0.81), DFS from six studies as 0.63 (95% CI: 0.54–0.73) and OS from three studies as 0.57 (95% CI: 0.44–0.74) [33]. Similarly, in a second meta-analysis on the predictive value of pretreatment SUVmax measurements, Xie et al. found that in comparison to patients with a high SUVmax, patients with a low SUVmax had a reduced risk of progression, death and recurrence by 77, 76 and 73%, respectively [17]. The results of this meta-analysis indicate that high primary tumor SUVmax can serve as a prognostic marker in patients with HNSCC, with higher values correlating with poorer outcomes.
There are few studies that have evaluated the impact of pretreatment FDG uptake on treatment modality. Roh et al. prospectively analyzed 79 patients with SCC of the larynx and hypopharynx and concluded that DFS was significantly lower in patients with SUVmax >8.0 (p = 0.017). They also compared DFS in patients with high and low SUVmax values relative to the treatment subgroup. Among the 31 patients with high SUVmax, the 3‑year DFS was higher in patients who underwent surgery when compared with patients who received radiation therapy (RT). However, this latter finding was not statistically significant (48 vs 27%; p = 0.085) [10]. Similarly, Kim et al. prospectively analyzed pretreatment PET scans of 52 patients with newly diagnosed resectable SCC of the oropharynx. Primary treatment modalities consisted of surgical resection plus RT (surgery group; n = 31) or radical RT plus chemotherapy (RT group; n = 21). Among the 25 patients with a high SUV >6.0, 3-year DFS was higher in the surgery group (n = 15) than in the RT group (n = 10, 78 vs 33%; p = 0.043). However, among the 27 patients with a low SUV ≤6.0, 3-year DFS was similar in the surgery (n = 16) and RT (n = 11) groups (93 vs 78%, respectively; p = 0.329) [34]. This could have important implications, as it has the potential to influence future clinical practice, if validated with larger studies.
Alhough the proposed SUVmax cutoff values for ‘high’ and ‘low’ groups varied between studies due to the heterogeneity of the patient population and the intrinsic variability in PET/CT scanners, it appears that patients with a SUVmax >9 would have worse OS or progression-free survival (PFS) rates regardless of therapy. Such patients with a high SUVmax might be candidates for more aggressive therapy, such as the addition of one or more novel agents to conventional chemoradiotherapy (CRT). Conversely, patients with a low SUVmax might be candidates for less aggressive treatment, such as less toxic radiosensitizers. However, the particular threshold at which predictive value exists needs to be prospectively validated in larger studies and potentially used as a stratification variable in clinical trials to advance future practice (Table 1).
■ SUVmax & therapy response
Treatment monitoring with FDG-PET is largely based on consensus criteria from the European Organization for Research and Treatment of Cancer (EORTC) and the more recent PET Response Criteria in Solid Tumors (PERCIST criteria). According to EORTC, a drop (delta between baseline and post-therapy) of 15–25% in SUVmax may represent a good treatment response [35]. Recently, PERCIST criteria was proposed by the investigators at the Johns Hopkins Medical Institutions and suggested that a decrease in SUV normalized to lean body mass of at least 30% should be achieved before considering partial tumor response [36]. PERCIST criteria has yet to be implemented in clinical studies of HNSCC.
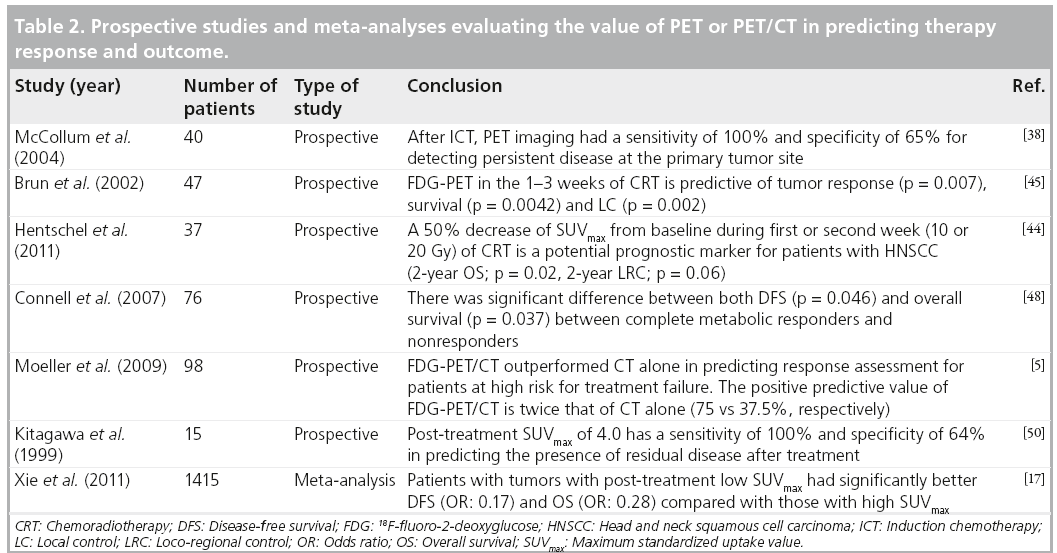
Responsiveness to induction chemotherapy (ICT) has been shown to be useful for predicting ultimate tumor response upon CRT completion and in the prediction of eventual outcomes in patients with head and neck cancer [37]. There are few studies that have evaluated the predictive value of interim PET/CT after induction therapy and before concurrent chemoradiotherapy. McCollum et al. prospectively analyzed 40 patients with advanced HNSCC to study the accuracy of PET after ICT and concluded that PET is predictive of pathological response with a sensitivity of 100% and negative predictive value (NPV) of 100%. Results were confirmed with a biopsy after PET during the post-ICT period [38]. Similarly, Yoon et al. retrospectively evaluated 21 patients with an aim of determining the efficacy of FDG-PET before and after ICT [39]. They studied patients with locally advanced head and neck cancer who achieved partial response after ICT in order to predict clinical outcomes after CRT. They found that a 65% decrease in SUVmax after ICT from baseline could predict clinical complete response (CR) after CRT (100 vs 33.3%; p = 0.003), PFS (median not reached vs 8.9 months; p < 0.001) and OS (median not reached vs 24.4 months; p < 0.0001). They also observed that a baseline SUVmax of 4.8 had a sensitivity of 94.1% and a NPV of 80% in predicting CR. Furthermore, a 65% decrease in SUVmax on the post-ICT scan had a sensitivity of 88.2% and a NPV of 66.7% in predicting CR after CRT. These results are comparable to similar studies on lung cancer [40,41] and esophageal cancer [42]. Chepeha et al. reported that FDG-PET may be as efficacious as endoscopy with biopsy under general anesthesia for estimating tumor volume reduction with ICT in oropharyngeal SCC [43]. However, this needs to be further investigated in larger studies. If early PET scanning provides the same prognostic information as assessment with repeat endoscopy under anesthesia, this may reduce morbidity and costs, and expedite the delivery of planned therapy.
Early assessment of therapy response may allow for timely modification of ineffective treatment [44]. However, the data on intensive monitoring of HNSCC at early stages of CRT are currently limited. In a prospective study by Brun et al., the authors reported that FDG-PET assessments of metabolic response during the early phase of radiotherapy or chemotherapy in patients with HNSCC are associated with tumor response, OS and LC [45]. Using the median value as cutoff, a low metabolic rate in early FDG-PET was associated with complete remission in 96 versus 62% (p = 0.007), with 5-year OS in 72 versus 35% (p = 0.0042) and with LC in 96 versus 55% (p = 0.002) of patients, respectively. Similarly, in another prospective study of 37 patients with HNSCC, Hentschel et al. investigated the value of FDG-PET/CT during therapy. The authors measured the difference in pretherapy primary tumor SUVmax with respect to that after 1–2 weeks of CRT. When compared with patients with a relative change in the SUV of <50% (2-year OS: 38%; p = 0.02; 2-year locoregional recurrence: 40%; p = 0.06), those with a >50% decrease in primary tumor SUVmax had improved outcomes (2-year OS: 88%; 2-year loco-regional control: 88%) [44].
Post-CRT PET/CT can help guide subsequent management decisions. It plays a role in predicting pathological response and long-term survival [5,46–48]. In one of the early studies that evaluated therapy response after CRT, Lowe et al. prospectively observed that the mean SUV change between pretherapy and post-therapy PET scans was 34% in residual disease patients and 82% in pathologically complete response patients [47]. Since then, there have been many studies evaluating the significance of percentage change in the SUV in response to treatment. In a prospective study of 76 patients, Connell et al. observed a significant difference between both DFS (p = 0.046) and OS (p = 0.037) between complete metabolic responders and nonresponders [48]. In a prospective study of 98 patients with locally advanced head and neck cancer treated with radiotherapy with or without chemotherapy, Moeller et al. observed that both the primary tumor and nodal SUVmax values were significantly higher in nonresponders compared with responders (p < 0.001) after RT [5]. Either histological evaluation or observations was used to define response depending on other clinical considerations. They reported that the relative change in primary tumor SUVmax is a better parameter than nodal SUVmax in assessing the response to therapy. They also reported that a pretreatment SUVmax of 6.5 and post-treatment SUVmax of 2.8 have maximal accuracy in predicting treatment failure.
A higher SUVmax on the post-CRT PET scan may predict local recurrence and OS [14,49–51]. In a prospective study involving 15 patients, Kitagawa et al. observed that a post-treatment SUVmax of 4.0 has a sensitivity of 100% and specificity of 64% in predicting the presence of residual disease after treatment [50]. The average SUVmax in patients with residual disease and tumor recurrence, and in those without evidence of recurrence were 3.7, 3.2 and 2.5, respectively. The SUVmax in patients with recurrence and/or residual disease was found to be significantly higher than the SUVmax in those without evidence of recurrence (p < 0.01). In a retrospective study of 92 patients diagnosed with HNSCC, Sherriff et al. demonstrated that patients who experienced locoregional recurrence tended to have higher post-CRT SUVmax values (median SUVmax was 10.2) compared with those without local recurrence (median SUVmax of 6.89) [51]. Similarly, in a prospective study of 65 patients, Mori et al. divided patients into two groups based on the post-treatment SUVmax, with a cutoff value set at 3.5 [14]. The 3‑year OS rates were 74% in patients with SUVmax <3.5 and 55% in those with SUVmax >3.5. There was no significant difference between the 2 groups; however, the SUVmax <3.5 group had a better 3-year OS rate.
In a recent meta-analysis by Xie et al., authors evaluated the predictive value of post-treatment SUVmax in head and neck cancers. They analyzed five studies and concluded that patients with low primary tumor SUV in the post-treatment period had a reduced risk of progression and death by 83 and 72%, respectively [17]. Although there are variations in cutoff values used across different studies, it appears that a relative change in SUVmax (DSUV) during the treatment period is a better predictor of therapy response and outcome, compared with absolute changes in SUVmax values. Patients with high DSUVmax (60% to complete responders) and low post-CRT SUVmax (<3.0) have better OS, DFS and LC at 2 years (Table 2).
■ SUVmax & follow-up
FDG-PET/CT is commonly used for follow-up after treatment due to its ability to detect recurrence, regional lymphatic spread and distant metastases [2]. Follow-up PET/CT is defined here as a study performed at 6 months or beyond from the completion of initial surgical or CRT therapy. The ideal time for obtaining follow-up PET/CT has not been established for HNSCC and this interval varies across studies and institutional practices.
Diagnostic accuracy
In general, post-therapy FDG-PET/CT has a high accuracy in detecting the presence of malignant tissue. However, the accuracy varies depending on the time interval between therapy completion and image acquisition. In a prospective analysis of 45 patients, Greven et al. studied the diagnostic accuracy of scans obtained 1, 4, 12 and 24 months after completing treatment [31]. The results showed that 4-month follow-up scans were more accurate for evaluating the presence of cancer than the 1-month follow-up scans. Furthermore, there was a decrease in false-negatives with delayed imaging. The positive predictive value was 100, 86 and 75% for the 1, 4 and 12-month scans, respectively. A total of 28% of the scans interpreted as negative at 1 month were false negatives. The scans performed at all three of the other intervals demonstrated 100% accuracy in identifying the lack of disease.
A recent meta-analysis of 51 studies showed that there was no significant difference in the diagnostic accuracy of primary tumor PET/CT when comparing results of scans obtained <12 weeks versus those obtained >12 weeks after treatment (p = 0.1266) [52]. However, when used for surveillance of neck nodes, scans obtained >12 weeks post-therapy demonstrated better accuracy. For the nodal group, the sensitivity was 62.5% and specificity was 85.1% when obtained prior to 12 weeks. This increased to a sensitivity of 90.4% and a specificity of 94.3% when scanned after 12 weeks post-treatment (p = 0.0003) [52].
6‑month follow-up PET/CT
When evaluated 6 months after completing therapy, the presence of metabolic activity on PET/CT has been shown to have excellent NPV for DFS and OS [53,54]. Wong et al. retrospectively analyzed 143 previously treated patients with HNSCC and concluded that higher SUVmax values had a significant impact on both relapse-free survival (RFS; p = 0.0045) and OS (p = 0.003). The average time interval between completion of chemotherapy and obtaining the PET scan was 6.9 months. The mean SUVmax was 5.8 for patients suffering from any subsequent recurrence (n = 69), compared with SUV = 2.0 for those who did not recur. The mean SUVmax was 5.8 for patients who died, compared with 2.9 for those who were alive at last follow-up (n = 97). When analyzed as a continuous variable, an increase in one unit of SUV increased the patient’s relative risk of relapse by 11% and the relative risk of death by 14% [55].
12-month follow-up PET/CT
Studies have demonstrated excellent NPV for the assessment of recurrence [2,31]. In a prospective study of 91 patients diagnosed with HNSCC, Abgral et al. supported the use of PET/CT imaging for surveillance approximately 1 year after completing the treatment course [2]. FDGPET/ CT scans performed 11.6 ± 4.4 months after treatment had a positive predictive value of 77% and NPV of 100%. Sensitivity and specificity were 100% and 85%, respectively.
The authors believe that it would be beneficial to use post-treatment FDG-PET/CT to stratify patients into high- and low-risk groups, allowing for more appropriate management. Patients who undergo salvage surgery for early-stage HNSCC have a 70% 2-year RFS, which drops down to a 2-year RFS of 22% for those with recurrence [56]. Therefore, patients with high post-treatment SUVmax values may be considered for more frequent follow-up, allowing identification of recurrent disease as early as possible.
SUVmean
SUVmean incorporates information from multiple voxels, making it less sensitive to image noise. However, measured SUVmean will vary depending on which voxels are included in the average, so it is sensitive to ROI definition and is subject to intra- and inter-observer variability [57]. For this reason, SUVmean is not commonly used as a metabolic biomarker and there are limited data to support its use.
In a retrospective study including 88 patients who underwent pretreatment PET/CT scans, the predictive values of SUVmax, SUVmean and total lesion glycolysis (TLG) were assessed using univariate analysis for DFS, loco-regional control and distant metastasis-free survival. Increasing pretreatment SUVmean of the primary tumor was associated with decreased DFS (p = 0.01). Patients with pretreatment tumor SUVmean values that exceeded the median value of the cohort demonstrated inferior 2-year DFS relative to patients with SUVmean lower than the median value of the cohort (58 vs 82%, respectively; p = 0.03) [58]. Hentschel et al. also observed that a relative change in SUVmean >40% between baseline and after therapy had a difference in 2-year OS (61 vs 45%; p = 0.15), DFS (63 vs 30%; p = 0.12) and loco-regional control (78 vs 38%; p = 0.05) [44]. However, as previously mentioned in the ‘SUVmax’ section, they concluded that the SUVmax is a better predictor of disease outcome.
Peak SUV
Peak SUV (SUVpeak) is a hybrid SUV measurement that includes a local average SUV value in a group of voxels surrounding the voxel with the highest activity. The idea is to maintain the high reproducibility of SUVmax, with improved statistics to reduce noise. In a recent study at the authors institution, they measured aspects of bias and reproducibility associated with SUVmax and the closely related SUVpeak to provide a realistic noise context [59]. For images with noise properties typically associated with clinical whole-body studies, SUVpeak provides a slightly more robust alternative (compared with SUVmax) for assessing the most metabolically active tumor region. Although currently under investigation, SUVpeak has not been implemented in a standardized fashion and has not been reported in any published studies on HNSCC.
Metabolic tumor volume
Metabolic tumor volume (MTV) is defined as the volume of the tumor demonstrating FDG uptake [60]. It represents a volumetric and metabolic biomarker, and estimates tumor volume based on the distribution of metabolic activity. Therefore, unlike SUVmax, which is a single-pixel representation of the maximum FDG uptake by the tumor, MTV quantifies the overall tumor burden [61]. Thus, volumebased parameters, such as MTV, were sought in hopes of identifying more accurate ways to prognosticate disease. Furthermore, in the past, target volume was determined mostly by visual delineation of the tumor edge or by coanalysis with PET and contrast-enhanced CT scans [60]. Establishing MTV as a novel biomarker in functional imaging can pave the way for a more accurate determination of true tumor burden, which will theoretically allow for better outcome prediction. Various studies have demonstrated the role of MTV in predicting outcomes for several other malignancies as esophageal, lung and primary gastrointestinal B-cell lymphomas [62–64]. The volume of literature supporting its value in predicting outcome in patients with various cancers of the head and neck has been increasing over the past few years. However, there is still debate about the most appropriate segmentation method for estimating the MTV. Commonly used methods include absolute or fixed percentage SUVmax thresholds, and gradient or adaptive segmentation methods.
■ Baseline MTV
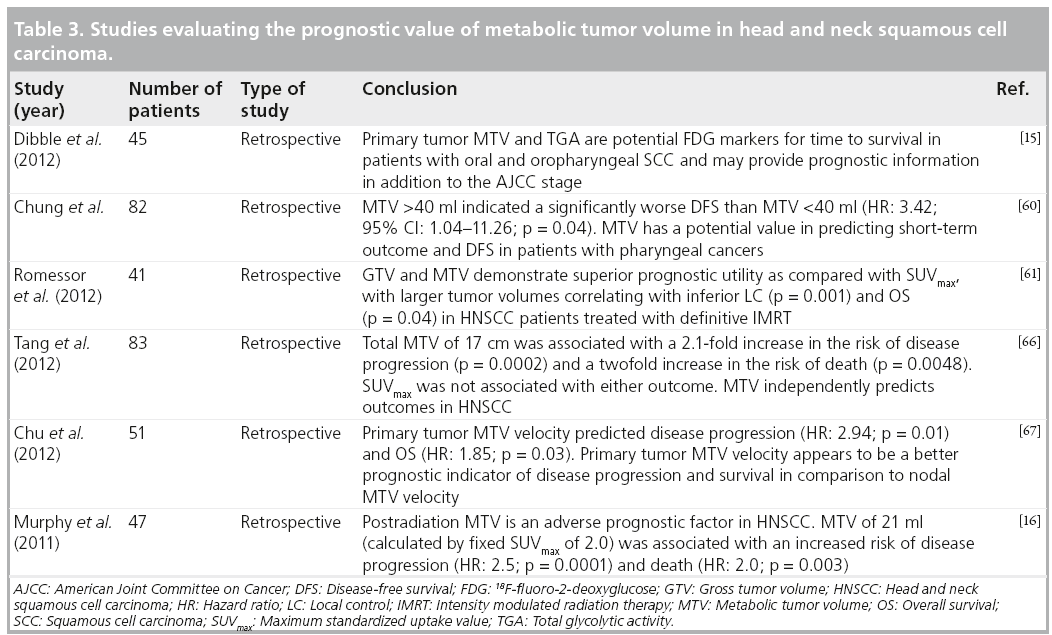
One of our recent studies on oral cavity and oropharyngeal cancers showed that MTV provided prognostic information and added value to American Joint Committee on Cancer staging. The estimated area under the receiver operating characteristic curve was found to be higher for MTV than for SUVmax, indicating better prediction of DFS and OS than SUVmax [15]. MTV has been shown to have value in predicting short-term outcome in patients diagnosed with pharyngeal carcinomas who were treated with radiotherapy alone or concurrent CRT. Patients with MTV >40 ml were found to have significantly lower chances of complete response or recurrence-free survival, compared with those with MTV ≤40 ml (68.2 vs 87.8%; p = 0.03). MTV was the only biomarker that was predictive of short-term outcome, with an MTV >40 ml being associated with an increased risk of recurrence or residual disease (p = 0.04). It was also identified as a significant prognostic factor for DFS in these patients. This study found no significant association between primary tumor SUV and short-term outcome or DFS [60].
MTV appears to have more predictive value than SUVmax (Figure 3). One of our recent analyses of 41 patients diagnosed with HNSCC demonstrated that lower MTV values (median cutoff point 7.2 ml) were associated with improved LC rates of 100 versus 54.2% in those with MTV >7.2 ml (p < 0.001). Patients with lower measured MTV values also showed better OS (94.7 vs 64.2%; p = 0.04). Moreover, a correlation was found between low MTV values and improved nodal, distant and overall control. On the contrary, using a median cutoff point of 15.8, SUVmax was not significantly predictive of outcome [61]. In another study of 85 patients diagnosed with HNSCC, the authors found that a preradiation increase in MTV of 17.4 ml (difference between the 75th and 25th percentiles) was significantly associated with a 1.9-fold increase in risk of first event (recurrence; p < 0.001) and a 2.1-fold increase in risk of death (p < 0.001) [65]. Tang et al. found similar results in a study of 83 patients with HNSCC, where a total MTV value >17 ml was correlated with a 2.1-fold increased risk of disease progression (p = 0.0002) and a twofold increase in the risk of death (p = 0.0048) (Figure 2) [66]. Upon further stratification, they determined that most of the predictive value of total MTV was due to tumor MTV, whereas nodal MTV was not significantly associated with PFS or OS (Figure 4). Further supporting this distinction, there was no correlation between tumor and nodal MTV (R2 < 0.01). Similar to the results from the previously mentioned study by Romesser et al. [61], these authors did not find a significant correlation between SUVmax and DFS or OS [66]. The results of this study, in conjunction with several others, imply that we may be able to identify a specific MTV value above which patients are more likely to have a poorer outcome [65,66].

Figure 3: Left tonsillar squamous cell carcinoma, stage T2N2bM0. A 37-year-old female with human papillomavirus-positive keratinizing squamous cell carcinoma of the left tonsil. The patient underwent transoral robotic radical tonsillectomy and neck dissection, followed by chemoradiation therapy with no recurrence in 3 years. Staging PET/CT (A) maximum intensity projection and (B) fused axial PET/CT images demonstrates intense metabolic activity within the left tonsil (standardized uptake value normalized to lean body mass of 10.4 and maximum standardized uptake value = 14.7) representing primary as well as foci of intense 18F-fluoro-2-deoxyglucose uptake fusing to several left cervical nodes (standardized uptake value normalized to lean body mass of 6.5 and maximum standardized uptake value = 9.1), consistent with regional nodal metastases and a total metabolic tumor volume of 7.5 ml (primary tumor 4.4 ml and lymph nodes 3.1 ml) (C).

Figure 4: Left piriform sinus squamous cell carcinoma, stage T2N2bM0. A 53-year-old male presenting with enlarging neck mass and voice changes, diagnosed with left piriform sinus squamous cell carcinoma. The patient received concurrent chemoradiation therapy with complete metabolic response on followup PET/CT scans and no recurrent disease for 4 years. Staging PET/CT scan (A) maximum intensity projection, (B) fused axial PET/CT images demonstrates focal intense FDG uptake associated with a soft tissue lesion obliterating left piriform sinus (standardized uptake value normalized to lean body mass of 7.3 and maximum standardized uptake value of 9.1), consistent with primary tumors, as well as intense metabolic activity corresponding to a soft tissue mass in the left level 2/3 region (standardized uptake value normalized to lean body mass of 22.9 and maximum standardized uptake value = 28.5), representing ipsilateral nodal metastasis and (C) fused CT and volumetric PET images (with standardized uptake value normalized to lean body mass of 3.0 threshold) shows small-size primary tumor volume (metabolic tumor volume: 1.6 ml) with large node metabolic tumor volume of 13.1 ml.
■ MTV & therapy response
Murphy et al. also looked at the value of MTV in predicting outcomes after receiving treatment in a study of 45 patients diagnosed with HNSCC. Post-treatment MTV increase of 21 cm3 was associated with an increased risk of disease progression by 2.5 (p < 0.0001) and an increased risk of death by 2.0 (p < 0.003) [16]. Therefore, MTV also seems to have value in predicting outcome when measured after therapy.
A recent study examined the predictive nature of primary tumor MTV velocity in a group of 51 patients diagnosed with HNSCC. They found that an increase in MTV velocity of 1 ml/week was associated with a 194% increase in risk of disease progression (p = 0.009), 143% increase in risk of cancer-related mortality (p = 0.004) and an 85% increase in the risk of death (p = 0.032). There was no significant correlation between tumor/nodal SUVmax or nodal MTV and patient outcome. This suggests that it is the primary tumor burden, and not lymph node burden, which predicts overall outcome. As with most other malignancies, HNSCCs are expected to grow in size and metabolic activity over time. Presumably, there would be a parallel increase in tumor MTV if it represents an accurate representation of tumor burden. However, 51% of the patients in this study actually experienced a decrease in MTV velocity over time. This may represent a true difference in velocity or it may be due to error. Despite the unexpected change in MTV velocity over time, the authors still found a significant correlation between increasing MTV velocity and outcome [67].
These studies have shown promising results regarding the predictive value of MTV in HNSCC. It may represent a more accurate predictor of overall tumor burden than singlepixel SUVmax values. More studies are needed to support this evolving paradigm and the use of these parameters in head and neck cancer imaging. Just as numerous studies have examined the value of SUVmax, the MTV cutoff point for a favorable outcome group versus an unfavorable outcome group will vary depending on the study population and segmentation methods used. As more studies are performed and published from different centers, a consensus needs to be reached regarding the most appropriate segmentation method and MTV cutoff point that should be used for validation in large prospective studies (Table 3).
TLG
TLG is defined as the tumor volume multiplied by SUVmean of included voxels [68]. Because this parameter incorporates both the MTV and SUV, it represents both the degree of FDG uptake and the size of the tumor. Like MTV, TLG theoretically represents the total activity of the metabolically active cancer cells. It should be an ideal representation of overall tumor burden. TLG has also demonstrated prognostic value in other cancers, including non- Hodgkin’s lymphoma, lung, breast and rectal carcinomas [69–72].
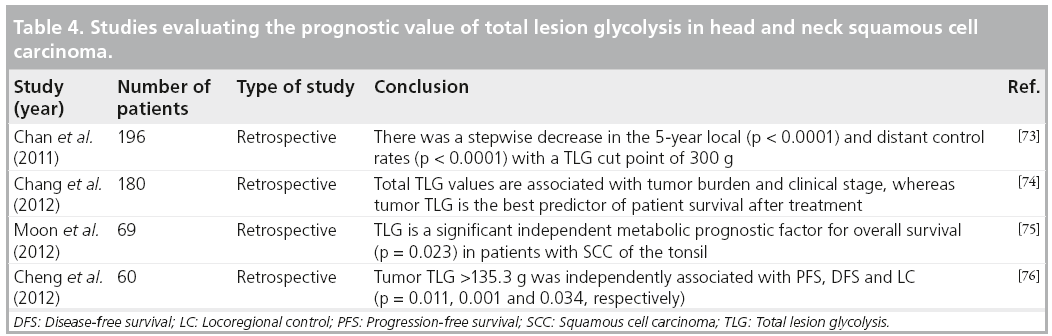
There is literature supporting the value of TLG, specifically in nasopharyngeal carcinomas. In a study of 196 patients diagnosed with nasopharyngeal carcinomas, Chan et al. found that stage III cancers tended to have lower TLG and MTV values compared with stage IV cancers (p < 0.0001). On univariate analysis, the authors found a significant correlation between high TLG (using a cut-off value of 330) and OS (p < 0.00001), DFS (p < 0.00001), local failurefree survival (p < 0.00001) and distant failurefree survival rates (p = 0.037). Accounting for potential confounding variables using multivariate analysis, TLG >330 was significantly associated with OS, DFS and local failure-free survival rates (p = 0.0014, 0.0005 and <0.0001, respectively), but not distant failure-free survival rates. Furthermore, TLG was the only independent predictor of OS and DFS, while tumor and nodal SUVmax were not [73]. This latter finding is in contradiction to some literature that previously supported SUVmax as a predictive marker [5,10,13–16,21,23,34]. Similarly, in another study involving 108 patients diagnosed with nasopharyngeal carcinomas, Chang et al. demonstrated that primary tumor TLG was the best predictor of survival after treatment. High tumor TLG values are associated with poorer OS (p = 0.33), local RFS, distant metastasis-free survival and DFS. Patients with tumor TLG values less than the median of 65 g had a local RFS of 88%, compared with those with tumor TLG >65 g, which was associated with local RFS of 66.2% (p = 0.014). The distant metastasisfree survival rate for patients with tumor TLG less than the median was 72.3 versus 60.5% for those with TLG >65g (p = 0.023). DFS for tumor TLG <65g was 79.9% compared with DFS of 37.4% in those with TLG >65 g (p < 0.001) [74].
Moon et al. studied 69 patients diagnosed with SCC of the tonsil and compared the value of TLG to that of MTV and SUVmax [75]. They concluded that TLG was the only significant prognostic factor associated with decreased OS in these patients. In addition, TLG had a greater area under the curve than MTV on receiver operating characteristic analysis, indicating better predictive value in determining time to event (0.929 vs 0.858, respectively). Cheng et al. retrospectively analyzed pretreatment FDG-PET/CT scans of 60 patients diagnosed with oropharyngeal SCC. Although both HPV-16 positivity and high tumor TLG (cutoff set at 135.3 g) were found to be associated with OS (p = 0.027 and 0.011, respectively), only primary tumor TLG >135.3 g was independently associated with DFS (p = 0.001), PFS (p = 0.011) and locoregional control (p = 0.034). To further support the value of TLG, the authors found that HPV-positive patients with low TLG values (<135.3 g) experienced better survival rates than those who were HPV-negative with measured TLG >135.3 g [76].
It appears that FDG volumetric imaging biomarkers would be more valuable in predicting the outcome for patients with head and neck cancers than the single-pixel SUVmax. However, large prospective cohort studies are needed to establish the use of these parameters and their repeatability and reliability before incorporating them into routine clinical practice (Table 4).
Pitfalls of SUV parameters
Just as with any other biomarker, there are limitations associated with SUV measurements. Both SUVmax and SUVmean showed poor repeatability for lesions with low FDG uptake [77]. It has been difficult comparing the value of SUV as a radiological biomarker, evidenced across different studies. This is due to the use of different SUV cutoff values, which may be prejudiced by patient selection, and the multiple other factors that influence SUV measurement. Most factors that change SUV measurements affect the measurement of the radioactivity concentration. Biologic factors, such as patient blood glucose level and tracer uptake time, can have a substantial impact on SUV measurements. Technological factors, such as interscanner variability, image acquisition and reconstruction parameters, as well as interobserver variability, can also have an impact [24,78,79]. Reducing the large variability currently affecting SUV estimates would probably enhance its prognostic value [80]. Thus, it is important to keep as many of these factors as possible the same between baseline and follow-up studies of a patient. This will be critical for quantitative PET/CT imaging in oncology.
Conclusion
Over the past decade, noninvasive imaging with FDG-PET/CT has become increasingly important in head and neck cancer management. It has been used for staging, RT planning, therapy response assessment, follow-up and potentially, as a prognostic and risk-stratification imaging modality. The SUVmax is the most extensively studied FDG parameter in HNSCC. SUVpeak appears to be less affected by noise but its value in HNSCC has not been established. There is growing interest in FDG volumetric parameters, such as MTV and TLG, which appear to be superior predictive parameters compared with SUVmax. However, more studies are needed to establish the value, repeatability and reader variability of these parameters for use in clinical practice.
Future perspective
FDG-PET volumetric imaging biomarkers (MTV and TLG) are yet to be proven to provide superior predictive and prognostic information about patient outcome to SUVmax. MTV and TLG repeatability and reader reliability should be established. A consensus about the most appropriate segmentation method to estimate MTV and TLG needs to evolve over the next few years. Integration of clinical factors, such as HPV status and FDG-PET/CT- (and MRI)-based imaging biomarkers, will be critical in deciding personalized therapy and follow-up strategies in HNSCC.
Financial & competing interests disclosure
R Subramaniam received a AUR-GE research fellowship, Siemens molecular imaging research grants, research support from MimVista software Inc., and is a consultant and a speaker for Eli Lilly (Alzheimer’s disease). The authors have no other relevant affiliations or financial involvement with any organization or entity with a financial interest in or financial conflict with the subject matter or materials discussed in the manuscript apart from those disclosed.
No writing assistance was utilized in the production of this manuscript.
References
- Jemal A, Bray F, Center MM, Ferlay J, Ward E, Forman D. Global cancer statistics. CA Cancer J. Clin. 61(2), 69–90 (2011).
- Abgral R, Querellou S, Potard G et al. Does 18F-FDG PET/CT improve the detection of posttreatment recurrence of head and neck squamous cell carcinoma in patients negative for disease on clinical follow-up? J. Nucl. Med. 50(1), 24–29 (2009).
- Daley T, Darling M. Nonsquamous cell malignant tumours of the oral cavity: an overview. J. Can. Dent. Assoc. 69(9), 577–582 (2003).
- Imsande HM, Davison JM, Truong MT et al. Use of 18F-FDG PET/CT as a predictive biomarker of outcome in patients with headand- neck non-squamous cell carcinoma. AJR Am. J. Roentgenol. 197(4), 976–980 (2011).
- Moeller BJ, Rana V, Cannon BA et al. Prospective risk-adjusted [18F] fluorodeoxyglucose positron emission tomography and computed tomography assessment of radiation response in head and neck cancer. J. Clin. Oncol. 27(15), 2509–2515 (2009).
- Dammann F, Horger M, Mueller-Berg M et al. Rational diagnosis of squamous cell carcinoma of the head and neck region. comparative evaluation of CT, MRI, and 18FDG PET. AJR Am. J. Roentgenol. 184(4), 1326–1331 (2005).
- Adams S, Baum RP, Stuckensen T, Bitter K, Hor G. Prospective comparison of 18F-FDG PET with conventional imaging modalities (CT, MRI, US) in lymph node staging of head and neck cancer. Eur. J. Nucl. Med. 25(9), 1255–1260 (1998).
- Daisne JF, Duprez T, Weynand B et al. Tumor volume in pharyngolaryngeal squamous cell carcinoma. comparison at CT, MR imaging, and FDG PET and validation with surgical specimen. Radiology 233(1), 93–100 (2004).
- Rodrigues RS, Bozza FA, Christian PE et al. Comparison of whole-body PET/CT, dedicated high-resolution head and neck PET/ CT, and contrast-enhanced CT in preoperative staging of clinically M0 squamous cell carcinoma of the head and neck. J. Nucl. Med. 50(8), 1205–1213 (2009).
- Roh JL, Pae KH, Choi SH et al. 2-[18F]-fluoro-2-deoxy-D-glucose positron emission tomography as guidance for primary treatment in patients with advanced-stage resectable squamous cell carcinoma of the larynx and hypopharynx. European J. Surg. Oncol. 33(6), 790–795 (2007).
- Vansteenkiste JF, Stroobants SG, Dupont PJ et al. Prognostic importance of the standardized uptake value on (18)F-fluoro-2- deoxy-glucose-positron emission tomography scan in non-small-cell lung cancer. An analysis of 125 cases. Leuven Lung Cancer Group. J. Clin. Oncol. 17(10), 3201–3206 (1999).
- Oshida M, Uno K, Suzuki M et al. Predicting the prognoses of breast carcinoma patients with positron emission tomography using 2-deoxy-2-fluoro[18F]-D-glucose. Cancer 82(11), 2227–2234 (1998).
- Machtay M, Natwa M, Andrel J et al. Pretreatment FDG-PET standardized uptake value as a prognostic factor for outcome in head and neck cancer. Head Neck 31(2), 195–201 (2009).
- Mori M, Tsukuda M, Horiuchi C et al. Efficacy of fluoro-2-deoxy-D-glucose positron emission tomography to evaluate responses to concurrent chemoradiotherapy for head and neck squamous cell carcinoma. Auris Nasus Larynx 38(6), 724–729 (2011).
- Dibble EH, Alvarez AC, Truong MT, Mercier G, Cook EF, Subramaniam RM. 18F-FDG metabolic tumor volume and total glycolytic activity of oral cavity and oropharyngeal squamous cell cancer: adding value to clinical staging. J. Nucl. Med. 53(5), 709–715 (2012).
- Murphy JD, La TH, Chu K et al. Postradiation metabolic tumor volume predicts outcome in head-and-neck cancer. Int. J. Radiat. Oncol. Biol. Phys. 80(2), 514–521 (2011).
- Xie P, Li M, Zhao H, Sun X, Fu Z, Yu J. 18F-FDG PET or PET-CT to evaluate prognosis for head and neck cancer: a metaanalysis. J. Cancer Res. Clin. Oncol. 137(7), 1085–1093 (2011).
- Allal AS, Slosman DO, Kebdani T, Allaoua M, Lehmann W, Dulguerov P. Prediction of outcome in head-and-neck cancer patients using the standardized uptake value of 2-[18F] fluoro-2-deoxy-D-glucose. Int. J. Radiat. Oncol. Biol. Phys. 59(5), 1295–1300 (2004).
- Lee SW, Nam SY, Im KC et al. Prediction of prognosis using standardized uptake value of 2-[(18)F] fluoro-2-deoxy-d-glucose positron emission tomography for nasopharyngeal carcinomas. Radiother. Oncol. 87(2), 211–216 (2008).
- Xie P, Yue JB, Fu Z, Feng R, Yu JM. Prognostic value of 18F-FDG PET/CT before and after radiotherapy for locally advanced nasopharyngeal carcinoma. Ann. Oncol. 21(5), 1078–1082 (2010).
- Allal AS, Dulguerov P, Allaoua M et al. Standardized uptake value of 2-[(18)F] fluoro- 2-deoxy-D-glucose in predicting outcome in head and neck carcinomas treated by radiotherapy with or without chemotherapy. J. Clin. Oncol. 20(5), 1398–1404 (2002).
- Halfpenny W, Hain SF, Biassoni L, Maisey MN, Sherman JA, Mcgurk M. FDG-PET. A possible prognostic factor in head and neck cancer. Br. J. Cancer 86(4), 512–516 (2002).
- Minn H, Lapela M, Klemi PJ et al. Prediction of survival with fluorine-18-fluorodeoxyglucose and PET in head and neck cancer. J. Nucl. Med. 38(12), 1907–1911 (1997).
- Adams MC, Turkington TG, Wilson JM, Wong TZ. A systematic review of the factors affecting accuracy of SUV measurements. AJR Am. J. Roentgenol. 195(2), 310–320 (2010).
- Benz MR, Evilevitch V, Allen-Auerbach MS et al. Treatment monitoring by 18F-FDG PET/CT in patients with sarcomas: interobserver variability of quantitative parameters in treatment-induced changes in histopathologically responding and nonresponding tumors. J. Nucl. Med. 49(7), 1038–1046 (2008).
- Jackson T, Chung MK, Mercier G, Ozonoff A, Subramaniam RM. FDG PET/CT interobserver agreement in head and neck cancer: FDG and CT measurements of the primary tumor site. Nucl. Med. Commun. 33(3), 305–312 (2012).
- Krabbe CA, Pruim J, Dijkstra PU, Roodenburg JL. 18F-FDG PET for routine posttreatment surveillance in oral and oropharyngeal squamous cell carcinoma. J. Nucl. Med. 51(7), 1164; author reply 1164–1165 (2010).
- Kubicek GJ, Champ C, Fogh S et al. FDG-PET staging and importance of lymph node SUV in head and neck cancer. Head Neck Oncol. 2, 19 (2010).
- Liao CT, Chang JT, Wang HM et al. Pretreatment primary tumor SUVmax measured by FDG-PET and pathologic tumor depth predict for poor outcomes in patients with oral cavity squamous cell carcinoma and pathologically positive lymph nodes. Int. J. Radiat. Oncol. Biol. Phys. 73(3), 764–771 (2009).
- Torizuka T, Tanizaki Y, Kanno T et al. Prognostic value of 18F-FDG PET in patients with head and neck squamous cell cancer. AJR Am. J. Roentgenol. 192(4), W156–W160 (2009).
- Greven KM, Williams DW 3rd, McGuirt WF Sr et al. Serial positron emission tomography scans following radiation therapy of patients with head and neck cancer. Head Neck 23(11), 942–946 (2001).
- Vernon MR, Maheshwari M, Schultz CJ et al. Clinical outcomes of patients receiving integrated PET/CT-guided radiotherapy for head and neck carcinoma. Int. J. Radiat. Oncol. Biol. Phys. 70(3), 678–684 (2008).
- Zhang B, Li X, Lu X. Standardized uptake value is of prognostic value for outcome in head and neck squamous cell carcinoma. Acta Otolaryngol. 130(7), 756–762 (2010).
- Kim SY, Roh JL, Kim MR et al. Use of 18F-FDG PET for primary treatment strategy in patients with squamous cell carcinoma of the oropharynx. J. Nucl. Med. 48(5), 752–757 (2007).
- Young H, Baum R, Cremerius U et al. Measurement of clinical and subclinical tumour response using [18F]- fluorodeoxyglucose and positron emission tomography. review and 1999 EORTC recommendations. European Organization for Research and Treatment of Cancer (EORTC) PET study group. Eur. J. Cancer 35(13), 1773–1782 (1999).
- Wahl RL, Jacene H, Kasamon Y, Lodge MA. From RECIST to PERCIST: evolving Considerations for PET response criteria in solid tumors. J. Nucl. Med. 50(Suppl. 1), 122S–150S (2009).
- Han MW, Ryu IS, Lee SW et al. Can response to induction chemotherapy be a predictive marker for ultimate outcome in hypopharyngeal cancer? Otolaryngol. Head Neck Surg. 146(1), 74–80 (2012).
- McCollum AD, Burrell SC, Haddad RI et al. Positron emission tomography with 18F-fluorodeoxyglucose to predict pathologic response after induction chemotherapy and definitive chemoradiotherapy in head and neck cancer. Head Neck 26(10), 890–896 (2004).
- Yoon DH, Cho Y, Kim SY et al. Usefulness of interim FDG-PET after induction chemotherapy in patients with locally advanced squamous cell carcinoma of the head and neck receiving sequential induction chemotherapy followed by concurrent chemoradiotherapy. Int. J. Radiat. Oncol. Biol. Phys. 81(1), 118–125 (2011).
- Hoekstra CJ, Stroobants SG, Smit EF et al. Prognostic relevance of response evaluation using [18F]-2-fluoro-2-deoxy-D-glucose positron emission tomography in patients with locally advanced non-small-cell lung cancer. J. Clin. Oncol. 23(33), 8362–8370 (2005).
- Weber WA, Petersen V, Schmidt B et al. Positron emission tomography in non-smallcell lung cancer. prediction of response to chemotherapy by quantitative assessment of glucose use. J. Clin. Oncol. 21(14), 2651–2657 (2003).
- Ishihara R, Yamamoto S, Iishi H et al. Predicting the effects of chemoradiotherapy for squamous cell carcinoma of the esophagus by induction chemotherapy response assessed by positron emission tomography. toward PET-response-guided selection of chemoradiotherapy or esophagectomy. Int. J. Clin. Oncol. 17(3), 225–232 (2012).
- Chepeha DB, Sacco AG, Oxford LE et al. Advanced squamous cell carcinoma of the oropharynx: efficacy of positron emission tomography and computed tomography for determining primary tumor response during induction chemotherapy. Head Neck 31(4), 452–460 (2009).
- Hentschel M, Appold S, Schreiber A et al. Early FDG PET at 10 or 20 Gy under chemoradiotherapy is prognostic for locoregional control and overall survival in patients with head and neck cancer. Eur. J. Nucl. Med. Mol. Imag. 38(7), 1203–1211 (2011).
- Brun E, Kjellen E, Tennvall J et al. FDG PET studies during treatment. prediction of therapy outcome in head and neck squamous cell carcinoma. Head Neck 24(2), 127–135 (2002).
- Yen TC, Lin CY, Wang HM et al. 18F-FDG-PET for evaluation of the response to concurrent chemoradiation therapy with intensity-modulated radiation technique for Stage T4 nasopharyngeal carcinoma. Int. J. Radiat. Oncol. Biol. Phys. 65(5), 1307–1314 (2006).
- Lowe VJ, Dunphy FR, Varvares M et al. Evaluation of chemotherapy response in patients with advanced head and neck cancer using [F-18]fluorodeoxyglucose positron emission tomography. Head Neck 19(8), 666–674 (1997).
- Connell CA, Corry J, Milner AD et al. Clinical impact of, and prognostic stratification by, F-18 FDG PET/CT in head and neck mucosal squamous cell carcinoma. Head Neck 29(11), 986–995 (2007).
- Ceulemans G, Voordeckers M, Farrag A, Verdries D, Storme G, Everaert H. Can 18-FDG-PET during radiotherapy replace post-therapy scanning for detection/ demonstration of tumor response in headand- neck cancer? Int. J. Radiat. Oncol. Biol. Phys. 81(4), 938–942 (2011).
- Kitagawa Y, Sadato N, Azuma H et al. FDG PET to evaluate combined intraarterial chemotherapy and radiotherapy of head and neck neoplasms. J. Nucl. Med. 40(7), 1132–1137 (1999).
- Sherriff JM, Ogunremi B, Colley S, Sanghera P, Hartley A. The role of positron emission tomography/CT imaging in head and neck cancer patients after radical chemoradiotherapy. Br. J. Radiol. 85(1019), e1120–e1126 (2012).
- Gupta T, Master Z, Kannan S et al. Diagnostic performance of post-treatment FDG PET or FDG PET/CT imaging in head and neck cancer. a systematic review and meta-analysis. Eur. J. Nucl. Med. Mol. Imag. 38(11), 2083–2095 (2011).
- Kao J, Vu HL, Genden EM et al. The diagnostic and prognostic utility of positron emission tomography/computed tomographybased follow-up after radiotherapy for head and neck cancer. Cancer 115(19), 4586–4594 (2009).
- Yao M, Smith RB, Hoffman HT et al. Clinical significance of postradiotherapy [18F]-fluorodeoxyglucose positron emission tomography imaging in management of headand- neck cancer-a long-term outcome report. Int. J. Radiat. Oncol. Biol. Phys. 74(1), 9–14 (2009).
- Wong RJ, Lin DT, Schoder H et al. Diagnostic and prognostic value of [(18)F] fluorodeoxyglucose positron emission tomography for recurrent head and neck squamous cell carcinoma. J. Clin. Oncol. 20(20), 4199–4208 (2002).
- Goodwin WJ Jr. Salvage surgery for patients with recurrent squamous cell carcinoma of the upper aerodigestive tract: when do the ends justify the means? Laryngoscope 110(3 Pt 2 Suppl. 93), 1–18 (2000).
- Lucignani G. SUV and segmentation: pressing challenges in tumour assessment and treatment. Eur. J. Nucl. Med. Mol. Imag. 36(4), 715–720 (2009).
- Higgins KA, Hoang JK, Roach MC et al. Analysis of pretreatment FDG-PET SUV parameters in head-and-neck cancer. tumor SUVmean has superior prognostic value. Int. J. Radiat. Oncol. Biol. Phys. 82(2), 548–553 (2012).
- Lodge MA, Chaudhry MA, Wahl RL. Noise Considerations for PET quantification using maximum and peak standardized uptake value. J. Nucl. Med. 53(7), 1041–1047 (2012).
- Chung MK, Jeong HS, Park SG et al. Metabolic tumor volume of [18F]-fluorodeoxyglucose positron emission tomography/computed tomography predicts short-term outcome to radiotherapy with or without chemotherapy in pharyngeal cancer. Clin. Cancer Res. 15(18), 5861–5868 (2009).
- Romesser PB, Qureshi MM, Shah BA et al. Superior prognostic utility of gross and metabolic tumor volume compared to standardized uptake value using PET/CT in head and neck squamous cell carcinoma patients treated with intensity-modulated radiotherapy. Ann. Nucl. Med. 26(7), 527–534 (2012).
- Jayachandran P, Pai RK, Quon A et al. Postchemoradiotherapy positron emission tomography predicts pathologic response and survival in patients with esophageal cancer. Int. J. Radiat. Oncol. Biol. Phys. 4(2), 471–477 (2012).
- Lee P, Bazan JG, Lavori PW et al. Metabolic tumor volume is an independent prognostic factor in patients treated definitively for nonsmall- cell lung cancer. Clin. Lung Cancer 13(1), 52–58 (2012).
- Song MK, Chung JS, Shin HJ et al. Prognostic value of metabolic tumor volume on PET / CT in primary gastrointestinal diffuse large B cell lymphoma. Cancer Sci. 103(3), 477–482 (2012).
- La TH, Filion EJ, Turnbull BB et al. Metabolic tumor volume predicts for recurrence and death in head-and-neck cancer. Int. J. Radiat. Oncol. Biol. Phys. 74(5), 1335–1341 (2009).
- Tang C, Murphy JD, Khong B et al. Validation that metabolic tumor volume predicts outcome in head-and-neck cancer. Int. J. Radiat. Oncol. Biol. Phys. 83(5), 1514–1520 (2012).
- Chu KP, Murphy JD, La TH et al. Prognostic value of metabolic tumor volume and velocity in predicting head-and-neck cancer outcomes. Int. J. Radiat. Oncol. Biol. Phys. 83(5), 1521–1527 (2012).
- Hatt M, Visvikis D, Pradier O, Cheze-Le Rest C. Baseline (1)(8)F-FDG PET image-derived parameters for therapy response prediction in oesophageal cancer. Eur. J. Nucl. Med. Mol. Imag. 38(9), 1595–1606 (2011).
- Erdi YE, Macapinlac H, Rosenzweig KE et al. Use of PET to monitor the response of lung cancer to radiation treatment. Eur. J. Nucl. Med. 27(7), 861–866 (2000).
- Tateishi U, Gamez C, Dawood S, Yeung HW, Cristofanilli M, Macapinlac HA. Bone metastases in patients with metastatic breast cancer: morphologic and metabolic monitoring of response to systemic therapy with integrated PET/CT. Radiology 247(1), 189–196 (2008).
- Gu J, Khong PL, Wang S, Chan Q, Law W, Zhang J. Quantitative assessment of diffusion-weighted MR imaging in patients with primary rectal cancer: correlation with FDGPET/ CT. Mol. Imag. Biol. 13(5), 1020–1028 (2011).
- Manohar K, Mittal BR, Bhattacharya A, Malhotra P, Varma S. Prognostic value of quantitative parameters derived on initial staging 18F-fluorodeoxyglucose positron emission tomography/computed tomography in patients with high-grade non-Hodgkin’s lymphoma. Nucl. Med. Commun. 33(9), 974–981 (2012).
- Chan SC, Chang JT, Lin CY et al. Clinical utility of 18F-FDG PET parameters in patients with advanced nasopharyngeal carcinoma: predictive role for different survival endpoints and impact on prognostic stratification. Nucl. Med. Commun. 32(11), 989–996 (2011).
- Chang KP, Tsang NM, Liao CT et al. Prognostic significance of 18F-FDG PET parameters and plasma Epstein-Barr virus DNA load in patients with nasopharyngeal carcinoma. J. Nucl. Med. 53(1), 21–28 (2012).
- Moon SH, Choi JY, Lee HJ et al. Prognostic value of (18) F-FDG PET/CT in patients with squamous cell carcinoma of the tonsil. Comparisons of volume-based metabolic parameters. Head Neck doi:10.1002/ hed.22904 (2012) (Epub ahead of print).
- Cheng NM, Chang JT, Huang CG et al. Prognostic value of pretreatment (18)F-FDG PET/CT and human papillomavirus type 16 testing in locally advanced oropharyngeal squamous cell carcinoma. Eur. J. Nucl. Med. Mol. Imag. 39(11), 1673–1684 (2012).
- De Langen AJ, Vincent A, Velasquez LM et al. Repeatability of 18F-FDG uptake measurements in tumors: a metaanalysis. J. Nucl. Med. 53(5), 701–708 (2012).
- 78 Huang SC. Anatomy of SUV. Standardized uptake value. Nucl. Med. Biol. 27(7), 643–646 (2000).
- Paquet N, Albert A, Foidart J, Hustinx R. Within-patient variability of (18)F-FDG: standardized uptake values in normal tissues. J. Nucl. Med. 45(5), 784–788 (2004).
- Berghmans T, Dusart M, Paesmans M et al. Primary tumor standardized uptake value (SUVmax) measured on fluorodeoxyglucose positron emission tomography (FDG-PET) is of prognostic value for survival in non-small cell lung cancer (NSCLC): a systematic review and meta-analysis (MA) by the European Lung Cancer Working Party for the IASLC Lung Cancer Staging Project. J. Thorac. Oncol. 3(1), 6–12 (2008).
• • Prospective study of 98 patients. 18F-fluoro- 2-deoxyglucose PET/CT outperformed CT alone in predicting response assessment for patients at high risk for treatment failure. The positive predictive value of 18F-fluoro-2- deoxyglucose PET/CT is twice that of CT alone (75 vs 37.5%, respectively).
• • A meta-analysis of 1415 patients. Pooled survival data suggested better disease-free survival, overall survival and local control in patients with a low maximum standardized uptake value (SUVmax) pretreatment.
• • A prospective study of 40 patients. After induction chemotherapy, PET imaging had a sensitivity of 100% and a specificity of 65% for detecting persistent disease at the primary tumor site.
• • Prospective study of 37 patients. A 50% decrease of SUVmax from baseline during the first or second week (10 or 20 Gy) of chemoradiotherapy is a potential prognostic marker for patients with head and neck squamous cell carcinoma (2-year overall survival; p = 0.02, 2-year loco-regional control; p = 0.06).


