Review Article - Imaging in Medicine (2011) Volume 3, Issue 2
Computational approaches to assist in the evaluation of cancer treatment response
Mia A Levy1 & Daniel L Rubin†1Department of Biomedical Informatics & Medicine, Division of Hematology & Oncology, Vanderbilt University, 2220 Pierce Avenue, 691 PRB, Nashville, TN 37232, USA
- Corresponding Author:
- Daniel L Rubin
Department of Radiology, Stanford University
Richard M. Lucas Center, 1201 Welch Road
Office P285, Stanford, CA 94305-5488, USA
Tel: +1 650 725 4936
Fax: +1 650 723 5795
E-mail: http://rubin.web.stanford.edu
Abstract
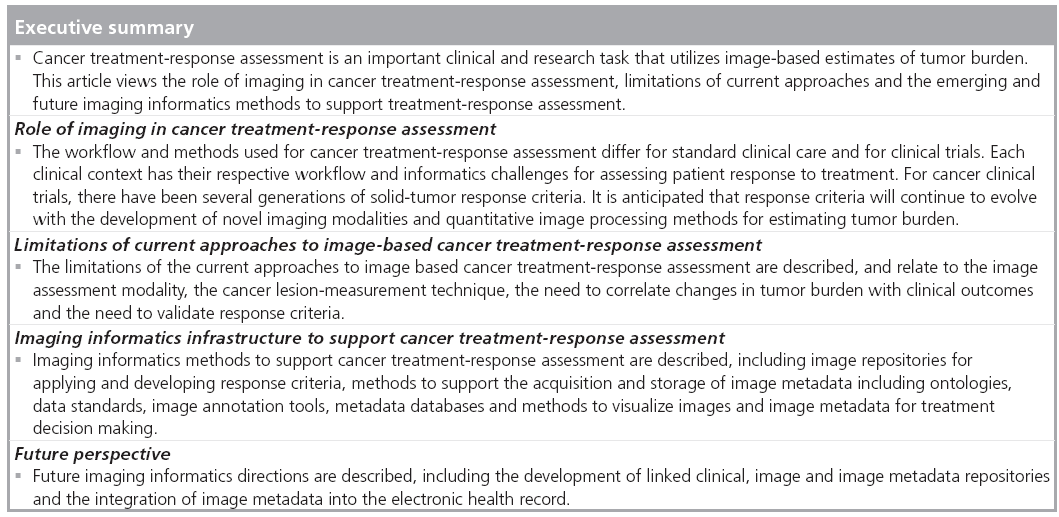
Cancer treatment-response assessment is an important clinical and research task that utilizes imagebased methods for tracking changes in tumor lesions over time. This article reviews the role of imaging in cancer treatment-response assessment, the limitations of current approaches, and the emerging and future imaging informatics methods to support treatment-response assessment. Imaging informatics methods described include: image repositories for applying and developing response criteria; methods to support the acquisition and storage of image metadata, including ontologies, data standards, image annotation tools and metadata databases; and methods to visualize images and image metadata for treatment decision making. Future directions are discussed, including the development of linked clinical, image and image metadata repositories, and the integration of image metadata into the electronic health record.
Keywords
cancer treatment-response assessment ▪ image annotation ▪ image repository ▪ imaging informatics ▪ response criteria ▪ treatment decision support
Treatment-response assessment is an important clinical and research task in cancer medicine. The goal of treatment-response assessment is to categorize the efficacy or toxicity of a treatment for an individual patient or patient cohort. Cancer treatment efficacy is typically assessed by evaluating changes in the patient’s tumor burden before and after treatment. Tumor burden is an estimate of the amount of tumor in a patient’s body at a particular time point, and can be described qualitatively or quantitatively. Tumor burden is most accurately estimated with imaging modalities, such as MRI, CT and PET. Imaging provides exquisite depiction of tumor lesion morphology that can be measured objectively. Cancer treatment-response assessment relies heavily on image-based ‘biomarkers’, such as linear dimension or PET uptake. Serial imaging studies are used to assess changes in the location, size and metabolic activity of tumors over time. Response criteria provide quantitative and qualitative methods for estimating tumor burden, estimating changes in tumor burden and classifying treatment response. These criteria are time-consuming to apply and have the potential for user error, so there is increasing interest in automated methods for evaluating cancer treatment response. This article describes the current work in creating computational approaches and informatics systems to support cancer treatment- response assessment, their limitations and future directions.
Role of imaging in cancer treatment-response assessment
At the individual patient level, tumor treatmentresponse assessment aids clinicians in making decisions regarding continuing or discontinuing the current therapy. In the advanced-disease setting, tumors often shrink or remain stable in size with therapy for some period of time, but eventually acquire mechanisms of resistance that allow them to grow again. For the individual patient, physicians perform response-assessment procedures to estimate the rate and direction of response (e.g., shrinking, stable or growing) to help them decide whether a treatment is effective and should be continued, or whether it is ineffective and should be discontinued. In clinical trials, the researcher uses predefined criteria, which include quantitative imaging assessment, to evaluate disease status and response.
Tumor-response assessment in clinical care
In everyday clinical practice, tumor-response assessment is a relatively informal and qualitative process. Imaging modalities (e.g., CT, MRI or PET) are selected depending upon the primary type of cancer (e.g., breast, prostate or brain), the location of any metastasis and the patient’s tolerance to the procedure (e.g., intravenous contrast allergy or poor renal function) may be a contraindication for certain CT protocols. Imaging studies are performed at baseline, sometime prior to the start of treatment, and then again at interval follow-up periods for a biologically appropriate time after the start of treatment. Follow-up studies are typically performed every 6–12 weeks, depending upon the pattern of treatment cycles (e.g., 3- or 4-week treatment cycles), the expected rate of response to treatment (e.g., cytostatic vs cytotoxic treatment), the expected rate of progression of the disease (e.g., fast for lung cancer compared with slow for prostate cancer) and the appearance of any new patient symptoms concerning progression (e.g., new pain).
The radiologist reporting the imaging studies typically compares the current study with the most recent study and reports qualitative changes in overall tumor burden as increasing, decreasing or remaining stable. A report of new tumor lesions defines the event of disease progression. The oncologist uses the images, radiology reports and additional clinical features, such as patient toxicity to treatment, to decide if treatment should be continued or discontinued. If the patient’s disease is improving (i.e., decreasing in size) or stable, treatment is continued. If the tumor burden is increasing, or there are new lesions present, then the treatment is discontinued and new treatment options are considered.
Tumor-response assessment in clinical trials
For patients participating in therapeutic clinical trials, the response assessment process is much more formalized and quantitative. Novel cancer therapies are often evaluated first, in the metastatic or advanced-disease setting, for their antitumor activity. The primary therapeutic goal for many antitumor treatments in the advanceddisease setting is delaying tumor growth and, ideally, tumor shrinkage. Delay in tumor growth can correlate with improved quality of life, morbidity and mortality [1,2]. Historically, tumor shrinkage has been the hallmark of antitumor activity for cytotoxic therapies, which cause tumor cell death and, thus, have the potential to shrink tumor masses. Tumor shrinkage, in a proportion of patients in Phase II studies of cytotoxic drugs, has been shown to be predictive of improvement in survival in Phase III studies [2–4]. Noncytotoxic therapies, on the other hand, are typically cytostatic, and may not cause tumor shrinkage but rather tumor stability. Several noncytotoxic therapies have also demonstrated improvement in overall survival in randomized trials [5,6]. For such cases, delay in tumor growth can also be used as evidence of antitumor activity [7]. The time to objective tumor growth is referred to as the time to progression (TTP) and is often a primary or secondary end point for Phase II and III cancer clinical trials.
The goal of therapeutic clinical trials is, thus, to determine if an experimental therapy is efficacious and safe. In order to compare the efficacy and toxicity of the experimental treatment among the patients within a clinical trial, a clinical trial protocol is developed to standardize treatment and response assessment procedures for all participating subjects. Formal response criteria have been developed to help standardize tumorresponse assessment across clinical trials, to enable trial results to be compared. For each clinical trial, the response assessment protocol specifically defines the imaging modality, image-acquisition protocol, the timing of the baseline and follow-up assessments, and the response criteria that should be used to quantify and classify response. Cancer response criteria standardize the approach for estimating tumor burden, defining quantitative and qualitative changes in tumor burden, and classifying tumor response to treatment in clinical trial cohorts (e.g, stable disease, partial response or progressive disease). These formal response assessment outcomes are incorporated into the clinical trial decision algorithms that define the conditions when an experimental treatment should be continued or discontinued. In this way, the clinical trial protocol helps to ensure consistent treatment decisions across trial subjects.
The response criteria also enable quantification and classification of each patient’s response to treatment so that they can be aggregated and compared across trial arms. The mean of the quantitative response rate can be compared between clinical trial arms as a quantitative estimate of differences in treatment efficacy. Trial arms will also compare the median TTP and the percentage of subjects with a particular response category. A clinically and statistically significant difference in the TTP between two trial arms is often used as an intermediate end point for novel drug approval by regulatory agencies. This enables more rapid approval of novel therapies than waiting for overall survival end points to be reached, which for many cancers can be several years.
Cancer response criteria
Several generations of solid-tumor response criteria have been developed since the first cancer response criterion, termed the WHO criteria, was published in 1981 [8]. The WHO criteria recommended evaluating tumor lesions with radiographic modalities, taking bidimensional tumor measurements of observed cancer lesions in the images, and taking the sum of the products to generate a quantitative estimate of tumor burden. This was carried out at baseline, and again at follow-up. The quantitative response was calculated as the percentage change in the tumor burden (sum of products) taking the baseline assessment as reference. The quantitative response was calculated at each follow-up assessment period, and the minimum tumor burden achieved since baseline was used to calculate the best response rate. This quantitative assessment was used to classify the nature of the patient’s response into four response categories based on heuristically defined thresholds. These response categories, which are still used at present, are complete response, partial response, stable disease and disease progression. While these appear to be qualitative descriptions, these response categories are a form of ordinal scale. The criteria also specified observations, including the appearance of any new lesions, as defining the event of disease progression.
The WHO criteria were widely used in cancer clinical trial protocols. However, the designers of clinical trials began to make modifications to the criteria on an ad hoc basis to incorporate new imaging technologies and address underspecified aspects of the original document. As a result, there was a lack of standardization, and it became difficult to consistently confirm trial results and compare trial outcomes [9,10]. In the mid-1990s, an international, multidisciplinary committee, known as the International Working Party, was established to simplify and standardize the criteria. In 2000, the committee published the Response Evaluation Criteria in Solid Tumors (RECIST) guidelines [11], the next generation of solid tumor-response criteria. RECIST had some significant differences from the original WHO criteria. First, it defined more specifically what was considered measurable disease both by the anatomic location of the lesion and by a minimum size requirement. Second, up to five lesions per organ could be selected, with a maximum of ten lesions total, to estimate tumor burden. Finally, the criteria utilized unidimensional measurement of lesions, and the sum of longest diameters to estimate total tumor burden. As a result of the change from bidimensional to unidimensional measuring, the thresholds for defining response categories were also changed.
Over the last decade, RECIST has been widely utilized in cancer clinical trials and has become a ‘requirement’ for government regulatory approval of drugs in certain contexts [12].
However, just as with the original WHO criteria, after the continued application of RECIST in more settings, and the development of new imaging technologies, such as metabolic imaging, it became necessary to revise the RECIST criteria. RECIST 1.1, published in 2009, further specifies and, in some ways, simplifies the criteria [12]. Major changes include specific definitions for what is considered measurable with respect to lymph nodes, and a decrease in the number of target lesions used to estimate tumor burden from a total of ten to five, with a maximum of two lesions per organ (Figure 1) [11–18].

Figure 1: Timeline of publication of Oncology Response Assessment Criteria. WHO Criteria (1981) [8], RECIST (2000 [11] and 2009 [12]), IWG for Lymphoma Response Criteria (1999) [13], IHC for Lymphoma Response Assessment (2007) [14], PCWG1 (1999) [15] and PCWG2 (2008) [16], Malignant Glioma Response Assessment Criteria (1990) [17] and GIST Response Criteria (2008) [18]. GIST: Gastrointestinal stromal tumor; IHC: International Harmonization Criteria; IWG: International Working Group; PCWG: Prostate Cancer Clinical Trials Working Group; RECIST: Response Evaluation Criteria in Solid Tumors.
However, RECIST is not an appropriate response criterion for every type of cancer (Figure 1). Two generations of response criteria have also been developed for lymphoma [13,14] and prostate cancer [15,16] to accommodate novel assessment modalities and disease characteristics. In addition, the solid-tumor criteria have not been found to be sufficient for response assessment intracranial neoplasms [17], or for the very rare gastrointestinal stromal tumor (GIST) [19,20] and mesothelioma neoplasms [21]. As such, response criteria have been developed for these specific diseases [17,22]. Newer approaches that incorporate metabolic imaging with PET have also been proposed recently [23]. Given historical trends and the continued development and validation of new response biomarkers and criteria, it is anticipated that cancer-response assessment criteria will continue to evolve.
Limitations of current approaches to image-based cancer treatment-response assessment
A rational approach to the development of response criteria has recently been proposed as a guide to ongoing research in this area [24]:
▪ The assessment modality should be widely available and the image acquisition technique reproducible;
▪ The tumor burden measurement technique should be reproducible and accurate;
▪ Changes in the estimation of the tumor burden should correlate with TTP and overall survival;
▪ New criteria should be evaluated with data from multiple clinical centers, and with multiple disease subtypes, if applicable.
RECIST 1.1 has several advantages and disadvantages with respect to these guiding principles. In addition, the information systems that support the application and development of cancer treatment response criteria also have several limitations along these axes. We review these in this article, and discuss some recent developments in computational approaches to treatment–response assessment.
Assessment modality
For a response criterion to be widely applicable, the imaging modality should be a reproducible technique that is available at most centers internationally, so as not to restrict patient eligibility. For this reason, RECIST recommends the use of CT and MRI, which are widely available with reproducible techniques. This has been one of the main arguments for lack of introduction of PET as a quantitative image biomarker for response criteria, owing to the relative lack of availability of this modality internationally and interinstitution variation and reproducibility of the image acquisition techniques.
However, despite the reproducibility of CT and MRI modalities, the protocols for these modalities often vary by clinical indication, leading to different protocols being applied for the baseline and follow-up studies. Ideally, response assessment should be performed using the same image-acquisition protocol for the baseline and follow-up study. In particular, the modality, slice thickness, anatomic coverage, use of contrast agents and imaging phases should be the same for each study. However, in the clinical setting, the selection of a particular image-acquisition protocol for a given patient is often driven by the indication for the procedure. A baseline assessment, where the tumor is first diagnosed, may have a different indication for radiological evaluation (e.g., abdominal pain) than for follow-up studies (e.g., cancer restaging) and, thus, may result in variations in the image-acquisition protocol. This is a common occurrence that makes it difficult to compare the baseline and follow-up studies both for clinical trial and standard-of-care patients.
In addition, the image-acquisition protocol should also enable consistent quantitative and qualitative measurement of tumor burden. As discussed in the next section, the tumor measurement technique itself should be accurate and reproducible. However, this can be highly dependent on the reproducibility of the imageacquisition protocol and the resultant image quality. Image-acquisition protocols should be developed and validated in conjunction with quantitative measurement techniques for estimating tumor burden.
Measurement technique
There are several limitations to RECIST with respect to the inter-reader reproducibility and accuracy of its measurement technique for estimating tumor burden. In particular, RECIST utilizes manual human measurement of the lesion’s longest diameter and human selection of the target lesions to include in the sum of diameters. Depending upon the size of the cancer lesion, the response criteria classification thresholds may be sensitive to even millimeter differences in the size of lesions as measured by different readers. In addition, when multiple lesions are present for a particular organ, RECIST requires the selection of, at most, two target lesions per organ and no more than five target lesions in total. The selection of the target lesion in this case is left to the judgment of the reviewer. Two reviewers will often pick different target lesions in these cases, which may result in differences in response classification. In particular, differences have been observed in the interpretation of response outcomes between the local providers managing patients in the trial and central reviewers [25]. The US FDA reported a 24–29% rate of discordance in response assessment at the patient level in oncology clinical trials between local investigator and central reviewer assessment of progression status [26,27]. These differences at the patient level result in an average 41% decrease in the cohort mean tumor response rate that is reported by central reviewers compared with local investigators in a review of nine clinical trials [25]. Even when the central review process is used, discordance exists between readers. One study in particular reported a rate of discordance for progression status up to 38% between multiple central reviewers [28]. This lack of concordance is related, in part, to the complexity, lack of precision and lack of detailed specification of response criteria.
One of the primary advantages of the longestdiameter measurement technique in RECIST is the general availability of digital caliper tools in clinical imaging workstations and the simplicity of conducting the measurement. In addition, superficial and cutaneous cancer lesions can also be measured by physical examination with rulers, and included in tumor burden estimates. Similar to the imaging modality, the tumor measurement technique should also be widely available and easy to apply by both radiologists and medical oncologists. For this reason, more sophisticated image-processing methods for measuring tumor burden, such as volumetric assessment, have not yet been recommended for general use.
However, changes in the longest dimension or volume of tumor may not be the most sensitive or reliable indicator of tumor responsiveness to treatment. Linear and volume measures reflect gross anatomic and morphologic changes that are certainly gross manifestations of underlying pathophysiologic changes. However, many noncytotoxic therapies do not produce tumor shrinkage, although they can produce improvements in TTP and overall survival. For many of these noncytotoxic treatments, metabolic changes can be seen early, prior to detection of tumor shrinkage. Clearly, there are new emerging methods that can characterize the underlying pathophysiological changes induced by targeted agents earlier than detected by the current size-based criteria. Such methods may be considerably more likely to offer earlier – and more specific – information on response to treatment when compared with changes in longest tumor dimensions. Response criteria, thus, may not only be developed for specific cancer diagnoses, but also to assess response to particular classes of therapies.
In addition, the tools currently used to measure tumor lesions have significant limitations that can result in inconsistent application of response criteria. Measurements of tumor lesions are typically recorded on lesion flow sheets or on case-report forms (CRFs) within a clinical trial management system. These documents are often paper based or recorded on computer spreadsheets, that are scanned into the clinical trial management system as unstructured data. The use of manually transcribed records of response has several disadvantages, including transcription errors, ambiguity of lesion identifiers when multiple lesions are present in the same organ or image, lack of a direct link to the source image data and limited functionality for calculating response. The lack of a direct link between the recorded lesion values and the raw image data source also makes it difficult for outside reviewers to audit the response assessment interpretation results. In addition, these approaches store the lesion metadata in the clinical trial management system, and do not maintain copies in the electronic health record or the radiology information system. As a result, there is a lack of communication between radiologists and oncologists as to the specific disease of interest to be tracked for response assessment. Thus, the information regarding target lesion identification and measurement recorded in the radiology report as part of clinical reporting is often insufficient for calculating quantitative response [29].
Furthermore, the image mark-up created by measurement tools in current image viewing workstations is stored in a proprietary format and is used only for visualization of the markup on the images. The mark-up is not typically exported in a manner that makes it machine accessible or viewable on other workstations. The current mark-up and measurements derived from this (i.e., the image metadata) are not directly machine accessible, and provides limited utility for the problem of uniquely identifying tumor lesions for lesion tracking. Thus, despite the wide availability and general ease of use of current imaging workstations, they have significant limitations with respect to recording tumor lesion information and for consistent application of cancer response criteria.
Correlation of changes in tumor burden with clinical outcomes
Imaging biomarkers indicating change in tumor burden are necessary but not sufficient to evaluate response. In order to be an effective intermediate end point for clinical trials, the imaging biomarker should correlate with overall survival and TTP. As stated earlier, the percentage change in the sum of diameters mandated by RECIST often does not correlate with TTP or overall survival for some targeted and noncytotoxic therapies [5,6]. A hypothetical example is shown in Figure 2. In these waterfall plots, the minimum percentage change of the tumor burden for each patient in the cohort is plotted. Cases with a decrease in tumor burden (i.e., percentage change in tumor burden below zero) compared with baseline indicates a net response to treatment. The waterfall plot based on using the RECIST criteria in Figure 2A does not show a significant response, with only half of the cases showing a decrease in tumor burden. This has been seen for several noncytotoxic therapies, where the TTP is the only indication of potential efficacy of a novel therapy. A better tumor burden biomarker is needed for these noncytotoxic therapies, that can detect the antitumor effect of these agents. A hypothetical tumor burden-response biomarker for such treatments is shown in Figure 2B. Using this imaging biomarker, a change is detected in a larger fraction of the patient cohort. Such alternative imaging biomarkers must be correlated with TTP, as well as overall survival end points, to confirm their utility. In addition to utility in detecting a change in the tumor burden, novel imaging biomarkers that detect early disease response could be used to triage patients away from therapies that are less likely to be efficacious towards potential alternatives. Thus, evaluation of novel image response biomarkers should include assessment of their ability to detect a change in the context of a particular therapy that correlates with TTP and overall survival.

Figure 2: Comparison of waterfall plots of best quantitative response rate for (A) standard RECIST percentage change in sum of diameters and (B) a novel imaging tumor burden biomarker. (A) In this hypothetical example, approximately half of the patients evaluated with RECIST had tumor shrinkage, as indicated by the vertical bars that extend below zero (showing negative percentage change in sum of diameters). (B) For the same patient cohort, the novel imaging biomarker shows a much more substantial impact of the drug treatment on tumor response, with a larger fraction of patients showing negative change in sum of diameters. Detecting changes in sum of diameters must ultimately be correlated with time to progression and overall survival to be definitively considered an effective intermediate end point for tumor response. RECIST: Response Evaluation Criteria in Solid Tumors.
Validation of response criteria
Validation of response criteria requires evaluation of the reproducibility of the approach at multiple institutions and, if applicable, for multiple cancer types. RECIST has been widely used with multiple types of solid tumors and across multiple institutions internationally. Several European and American research centers are involved in the development and testing of new oncology response assessment criteria. For the recent update of the RECIST criteria, from the original version published in 2000 to the RECIST 1.1 version published in early 2009, a large retrospective database of target lesions was developed to test the impact of modifications to the criteria [30,31]. Metadata on 18,000 potential target lesions were obtained from 6512 patients in 16 metastatic cancer clinical trials. These trials represented multiple types of solid tumor malignancies. The database was used to evaluate the impact of changes to RECIST on the classification of patient response to treatment. The RECIST 1.1 criterion was, thus, validated only by comparing it to the previous standard approach and not by evaluating its correlation with survival end points.
These databases, however, are not publicly available to enable the further development and validation of image processing approaches to estimating tumor burden for quantitative response criteria. In order to facilitate development and validation of novel response criteria, large datasets are needed that contain baseline and follow-up imaging studies, lesion measurement information, along with the corresponding diagnoses, therapies and clinical outcomes.
Imaging informatics infrastructure to support cancer treatment-response assessment
An informatics infrastructure is needed to tackle the challenges in applying current treatment response criteria, as well as for developing new criteria. The challenge in applying current criteria is that the criteria are often inconsistently applied; this variation is due to variations among reviewers in lesion selection, lesion measurement and interpretation of complex response criteria. The second challenge is that it is difficult to develop and validate new response criteria due to the lack of publicly available image repositories linked to patient treatments and clinical outcomes.
Biomedical informatics methods could tackle these challenges related to applying current and developing new response criteria. Figure 3 shows an informatics infrastructure that provides storage of clinical research images in image repositories, the acquisition and storage of image metadata in image metadata databases, and visualization of images and image metadata for treatment decision making. We review these recent advances later in the article.

Figure 3: Informatics infrastructure to support application of image-based response criteria in cancer clinical trials. The knowledge base includes ontologies and common data elements that can be used to create image annotation templates. The annotation templates are imported into an image annotation tool that is part of a Digital Imaging and Communications in Medicine (DICOM) viewer image workstation. Clinical research images are stored in the image repository and retrieved by the DICOM viewer for annotation. The image annotations are then stored in the image annotation database and can be further visualized in the presentation layer for clinical decision making.
Image repositories
There are two types of image repositories that support the application and development of imagebased cancer response criteria: image repositories for applying response criteria and image repositories for developing new response criteria.
Image repositories for applying response criteria
These repositories are used in individual institutions that treat patients or that conduct clinical trials, and in cooperative groups that coordinate the conduct of multicenter studies. At individual institutions, these repositories are integrated into the clinical trial management workflow and utilize Clinical Trial Management System (CTMS) software for recording patient information pertinent to response assessment, such as diagnosis, treatment and clinical outcomes for their clinical trial participants. These systems typically contain information extracted from the images, rather than the images themselves. For single-institution clinical trials, images in the Digital Imaging and Communications in Medicine (DICOM) format are typically stored on the local institution’s Picture Archiving and Communications System (PACS). The RECIST flow sheets are stored in the CTMS as scanned CRFs. For multisite clinical trials, where a central review is required, the DICOM images are typically stored on CDs that are then shipped to the central review site. However, clinical trial patients may have their baseline studies performed at another institution prior to enrollment, and the CDs containing these data are often lost. As such, many large multicenter clinical trials often have incomplete image datasets if there is desire for a secondary central review.
In addition to healthcare institutions, cooperative groups use image repositories to support clinical trials. The American College of Radiology Imaging Network (ACRIN) [32] and the Quality Assurance Review Center (QARC) [33] provide diagnostic imaging management services for the National Cancer Institute (NCI)-sponsored cooperative groups and for pharmaceutical companies. Each group has developed their own informatics systems to support the management of image data for clinical research. ACRIN has developed the Transfer of Images and Data (TRIAD) system [101] for image acquisition and management in imagebased clinical trials. TRIAD consists of a web client that allows users to search, download and view available DICOM image series, while the graphical user interface client provides advanced functions for DICOM series routing, image processing and annotation layer management. TRIAD is used to manage the image data for all ACRIN clinical trials, but remains proprietary software.
Funding for QARC is provided by the NCI Cancer Therapy Evaluation Program to acquire and store data and films for review. From 2007, QARC housed images and data for more than 40,000 patients treated on cancer clinical trials since 1975 [27], with over 6 million images. Since 2001, QARC has transitioned to digital image transfer and storage. QARC developed an image management system to collect clinical data, assist with the transfer DICOM images (Dicommunicator) and to store images in a PACS archive.
The Teaching File and Clinical Trial Export (TFCTE) integration profile developed by integrating the healthcare enterprise, specifies how workstations, modalities and PACS can specify and send manifests of DICOM objects out for teaching files and clinical trials [34]. It defines the roles of three functional entities: the export selector, the export manager, and the receiver. RSNA’s MIRC clinical trials processor [102] has been used as the export manager to de-identify cases for research and ship the studies off to a coordinating node.
Image repositories for developing new response criteria
These repositories contain public, de-identified images that researchers study in evaluating novel imaging biomarkers for treatment response. There are several such image archive systems. The National Biomedical Imaging Archive (NBIA) [103,104], hosted by the NCI, is a repository of DICOM images and metadata contributed from a variety of individual research studies. The NBIA contains publicly available image collections, including the Reference Image Database to Evaluate Therapy Response (RIDER) [35]. The RIDER collections include pretreatment and post-treatment serial imaging studies for several cancer types (breast, lung and primary brain) and imaging modalities (MRI, CT and CT-PET). This archive provides the biomedical research community with access to images for use in the development and validation of software tools to support cancer lesion detection and classification, and quantitative imaging assessment of drug response.
The Extensible Neuroimaging Archive Toolkit (XNAT) [36,105] is an open-source software platform for managing image data that works in conjunction with other informatics tools developed through the Biomedical Informatics Research Initiative (BIRN) [37,106]. XNAT includes a clinical data archive and an image achive. The online image viewer supports a number of common neuroimaging formats, including DICOM and Analyze. User access to the archive is provided by a secure web application.
Acquisition & storage of image metadata
As described earlier, the current approach for managing the feature information of cancer lesions is to record these image metadata on paper or electronic CRFs. One of the key limitations of this approach is the inability to link the image metadata to the voxels in the source image. This presents challenges for auditing and reasoning with image metadata. The current digital image measurement tools only generate simple image mark-up that is viewable by humans, but not directly machine-accessible. Recent informatics initiatives offer an opportunity to transform how image metadata is recorded and stored such that the link to the primary image source is maintained. These initiatives include the development of imaging ontologies and common data elements, image annotation standards, image annotation tools and image metadata databases (Figure 3).
Ontologies & common data elements
Case-report forms are used in clinical trials to standardize the acquisition of clinical research data. CRFs contain data elements – data collection items comprising a question and a set of allowed answers to that question. The allowed answers are often constrained values chosen from ontologies or controlled terminologies. For example, a RECIST CRF would include a data element for each image finding ‘RECIST lesion classification’ with a possible set of answers, including ‘target lesion, nontarget lesion, suspicious lesion, normal finding and new lesion’ (controlled terms from the RECIST criteria). Ontologies provide a formal representation of concepts and relationships between concepts, enabling shared semantics between systems.
Case-report forms created for many different clinical trials share data elements, referred to as common data elements (CDEs). The CDEs are useful to identify since they can be reused by multiple CRFs within and across organizations. The NCI’s Cancer Therapy Evaluation Program (CTEP) has created CDEs for use in RECIST 1.0 CRFs. The NCI’s Cancer Data Standards Registry and Repository (caDSR) [107] maintains these CDEs for public use. The use of common data elements across clinical trials and institutions also enables data sharing.
Several ontologies exist or are under development that may assist in the creation of DICOM header information and associated CRFs for imaging. The RSNA has developed the RadLex ontology, describing over 30,000 radiologyrelated concepts and relationships [38]. Early applications of RadLex include radiologydecision support, reporting tools and search applications for radiology research and education [108]. The RSNA reporting templates use RadLex terms in their content [108]. The RSNA is developing the RadLex Playbook [109], an ontology to provide a standard, comprehensive lexicon of radiology orderables and imaging procedure step names. This could improve the consistency of imaging procedure names across institutions, a vital step for image data exchange across institutions, both for clinical care and research. RadLex contains several RECISTrelated concepts, but not a comprehensive set of concepts to represent all of the qualitative and quantitative imaging findings and aggregated data for RECIST. At this time, there is no existing ontology that describes the range of quantitative imaging biomarkers required for cancer treatment-response assessment.
Image annotation standards
It is useful to distinguish between image markup and image annotation. Image mark-up refers to the graphical display of information describing an image or a region on an image. An image annotation refers to the information conveyed by the mark-up (image metadata) that describes the content of the image or image region. DICOM structured reporting (SR) is the industry standard for representing image metadata generically [39]. DICOM-SR specifies the classes used for transmission and storage of clinical documents, including free text reports and structured information. Clunie proposes a DICOM-SR template structure that could be used to record quantitative and qualitative information related to RECIST measurements for patients enrolled in cancer clinical trials [40]. He describes the use of DICOM-SR templates that would store all of the key lesion metadata information for a single patient over the course of multiple serial imaging studies and multiple image modalities. However, the DICOM-SR model on non-image information is report-centric, not an explicit model tailored to representing image content in terms of anatomic entities, radiology observations and regions of interest corresponding to those observations. DICOM-SR lacks a particular model focused on the image content per se.
The annotation and image mark-up (AIM) [41] standard has been developed as part of the NCI Cancer Biomedical Informatics Grid (caBIG) program [110]. AIM provides an information model for storing the key information about lesions needed to apply quantitative criteria of response assessment, such as lesion identification, location, size measurements, method of measurement and other quantitative features. The AIM files also convey information about the image mark-up, including the source image file, image coordinates, quantitative features such as measurements, and qualitative observations. The image observations are encoded, utilizing an ontology, such as RadLex [38], which contains radiology-specific terms. The AIM project includes a module to serialize DICOM-SR for culpability.
Image annotation tools
Image annotation tools have been developed that implement the AIM standard for creating image metadata in a structured format [42]. These tools are crucial to implement AIM since the latter is a complex data structure that is a transformation of the unstructured information collected during the image interpretation process.
Image annotation templates are incorporated into image annotation tools to facilitate structured capture of image annotation information. These annotation templates combine data elements for use in a specific context. For example, image annotation templates have been developed for annotation of liver lesions on abdominal CT scans that detail the pertinent qualitative descriptions for diagnostic evaluation of liver lesions. Annotation templates have also been developed for structured reporting of malignant glioma lesions on brain MRIs as part of the VASARI project [111] for the Repository of Molecular Brain Neoplasia Data (REMBRANDT).
Image metadata databases
The image metadata files need to be stored in a database to manage and retrieve this information. Image metadata databases have been developed using relational [43,112] and XML-based models [44]. Annotation of image findings enables queries regarding the visual observations in image datasets [43].
Visualization of images & image metadata
Current approaches for organizing and visualizing image metadata for treatment-response assessment consist of manual processes of transcribing lesion feature information onto CRFs or lesion flow sheets. However, these approaches do not maintain the link between the image metadata and the respective set of voxels in the image. Image annotation offers an improvement over these manual approaches.
Figure 3 serves as a useful summary of the informatics components described previously. It distinguishes between the knowledge sources, databases and user interfaces in the presentation layers. The knowledge sources include ontologies and terminologies that are used to create CDEs. The CDEs are used to create image annotation templates as a type of CRF that can be imported into an image annotation tool. The image annotation tool, as a plug-in to the DICOM viewer in the presentation layer, is used to annotate imaging studies from the image repository with the resultant image annotation data stored in the respective image annotation database. Finally, the image annotation database can be queried and the results visualized in the presentation layer back to the user for review of patient level data for clinical decision-making or trial auditing [45].
This infrastructure described has been recently implemented and evaluated for tumor lesion tracking and semantic annotation of image metadata to automatically populate the RECIST CRF for several cancer clinical trials [29]. The use of an image annotation tool to directly populate lesion flow sheets provides several advantages. First, the use of an information model and controlled terminology to encode cancer lesion image findings provides a consistent representation for storage and sharing of image metadata needed for cancer clinical trials. The information model also provides a foundation to enable reasoning with, and querying of, image metadata for response assessment [46]. Image annotation provides lesion identifiers that link lesion metadata directly to the source image and image mark-up. Image annotation tools also directly generate metadata regarding image mark-up, such as length calculations, eliminating possible transcription errors for length measurements.
Future perspective
Over the past 30 years, image-based cancerresponse criteria have been iteratively refined based on estimates of tumor burden that rely upon human measurement of cancer lesion dimensions and qualitative evaluations of the presence or absence of lesions. As noted previously, this approach has several advantages and limitations. Ongoing research initiatives strive to develop accurate and reproducible quantitative estimates of tumor burden that correlate with clinical outcomes [47]. In particular, changes in the quantitative estimate of tumor burden should correlate with TTP and overall survival, in order to be a useful response biomarker and intermediate end point for cancer clinical trials and treatment decision making. Development, validation and qualification of novel quantitative image response biomarkers require both retrospective and prospective testing with large datasets.
Figure 4 outlines the translational research informatics infrastructure needed, including publicly available reference datasets that can enable development and validation of novel estimates of tumor burden and novel response criteria. Reference datasets consisting of patientlevel data linking the source image files, image annotation data and clinical data are required. The reference datasets should include multiple cancer diagnoses (e.g., breast cancer or lung cancer), multiple imaging modalities (e.g., CT, MRI and PET-CT), and multiple types of therapies (e.g., radiation therapy, systemic chemotherapy and systemic targeted therapy). An informatics infrastructure is needed to enable federated query of the research databases by multiple institutions. Ideally, image processing algorithms will enable automated or semiautomated cancer lesion detection and feature extraction for quantitative estimation of tumor burden.

Figure 4: Future informatics infrastructure to support the application and development of next-generation cancer-response criteria. This includes the development of integrated, linked clinical and image data repositories, novel image-based estimates of tumor burden derived from image processing algorithms and their respective response criteria, and integration of image metadata and response interpretations in clinical data management systems, such as clinical trial management systems and electronic health records.
Furthermore, the development of structured image metadata presents an opportunity to integrate image metadata into electronic health records for use in tracking disease for treatment decision making. From this perspective, it is important to consider how quantitative response data is visualized and presented within the workflow of the treating provider for treatment decision making. The RECIST sum of diameters can be visualized along a temporal axis as shown in the bottom graph of Figure 5. Placed in the context of treatment data (Figure 5A), such information very quickly communicates the disease status of a patient over time. Methods that exploit image annotation offer the possibility to utilize the quantitative and qualitative features in images to improve the quality of information presented to oncologists in such patient information summaries. It also provides the essential link between the abstracted features within images and the respective source image. Such visualizations cannot only be used to summarize disease over time, but to navigate to the source image files. Integration and visualization of image annotation data offers a unique opportunity to transform image data from the traditional text report format to a flexible computable format.

Figure 5: Visualization of response data and clinical data along a timeline. (A) Specific medication administration events. (B) A serum response biomarker CEA in relation to the treatment events. (C) The Response Evaluation Criteria in Solid Tumors sum of diameters, with each colored bar representing the longest diameter of a respective target lesion. In this example, the patient has partial response to treatment at the first follow-up assessment period, but then has progression of disease at the second follow-up assessment period, as evident by both the 54% increase in the sum of diameters of the target lesions from the nadir as well as the presence of new lesions. b.i.d.: Twice daily; CEA: Carcinoembryonic antigen; d: Day; iv. Intravenous; p.o.: Per orem.
Conclusion
Computational approaches to cancer treatmentresponse assessment present an opportunity to improve the consistency of patient care and the predictive value of new imaging biomarkers as intermediate clinical trial end points. Recent innovations in image repositories and image annotation tools provide an infrastructure to support current response criteria. The ongoing development of quantitative imaging algorithms to extract quantitative features of disease presents a promising prospect for improved reproducibility and consistency of response assessment in the future. A more comprehensive translational infrastructure is needed to support the development and validation of novel approaches to response assessment, including the development of publicly available reference datasets. In order to be generally applicable, these innovations would require an informatics infrastructure to support application of image processing and response criteria methods to patient data, and integration of these results into the electronic health record. Work is ongoing in the research community towards these goals but will require industry partnerships to ultimately deploy these new approaches in clinical care.
Financial & competing interests disclosure
The authors have no relevant affiliations or financial involvement with any organization or entity with a financial interest in or financial conflict with the subject matter or materials discussed in the manuscript. This includes employment, consultancies, honoraria, stock ownership or options, expert testimony, grants or patents received or pending, or royalties.
No writing assistance was utilized in the production of this manuscript.
References
- Buyse M, Piedbois P: On the relationship between response to treatment and survival time. Stat. Med. 15, 2797–2812 (1996).
- Buyse M, Thirion P, Carlson RW, Burzykowski T, Molenberghs G, Piedbois P: Relation between tumour response to first-line chemotherapy and survival in advanced colorectal cancer: a meta-analysis. Meta-Analysis Group in Cancer. Lancet 356, 373–378 (2000).
- Paesmans M, Sculier JP, Libert P et al.: Response to chemotherapy has predictive value for further survival of patients with advanced non-small cell lung cancer: 10 years experience of the European Lung Cancer Working Party. Eur. J. Cancer 33, 2326–2332 (1997).
- El-Maraghi RH, Eisenhauer EA: Review of Phase II trial designs used in studies of molecular targeted agents: outcomes and predictors of success in Phase III. J. Clin. Oncol. 26, 1346–1354 (2008).
- Ratain MJ, Eisen T, Stadler WM et al.: Phase II placebo-controlled randomized discontinuation trial of sorafenib in patients with metastatic renal cell carcinoma. J. Clin. Oncol. 24, 2505–2512 (2006).
- Escudier B, Eisen T, Stadler WM et al.: Sorafenib in advanced clear-cell renal-cell carcinoma. N. Engl. J. Med. 356, 125–134 (2007).
- Goffin J, Baral S, Tu D, Nomikos D, Seymour L: Objective responses in patients with malignant melanoma or renal cell cancer in early clinical studies do not predict regulatory approval. Clin. Cancer Res. 11, 5928–5934 (2005).
- Miller AB, Hoogstraten B, Staquet M, Winkler A: Reporting results of cancer treatment. Cancer 47, 207–214 (1981).
- Tonkin K, Tritchler D, Tannock I: Criteria of tumor response used in clinical trials of chemotherapy. J. Clin. Oncol. 3, 870–875 (1985).
- Baar J, Tannock I: Analyzing the same data in two ways: a demonstration model to illustrate the reporting and misreporting of clinical trials. J. Clin. Oncol. 7, 969–978 (1989).
- Therasse P, Arbuck SG, Eisenhauer EA et al.: New guidelines to evaluate the response to treatment in solid tumors. European Organization for Research and Treatment of Cancer, National Cancer Institute of the United States, National Cancer Institute of Canada. J. Natl Cancer Inst. 92, 205–216 (2000).
- Eisenhauer EA, Therasse P, Bogaerts J et al.: New response evaluation criteria in solid tumours: revised RECIST guideline (version 1.1). Eur. J. Cancer 45, 228–247 (2009).
- Cheson BD, Horning SJ, Coiffier B et al.: Report of an international workshop to standardize response criteria for non-Hodgkin’s lymphomas. NCI sponsored international working group. J. Clin. Oncol. 17, 1244 (1999).
- Cheson BD, Pfistner B, Juweid ME et al.: Revised response criteria for malignant lymphoma. J. Clin. Oncol. 25, 579–586 (2007).
- Bubley GJ, Carducci M, Dahut W et al.: Eligibility and response guidelines for Phase II clinical trials in androgen-independent prostate cancer: recommendations from the Prostate-Specific Antigen Working Group. J. Clin. Oncol. 17, 3461–3467 (1999).
- Scher HI, Halabi S, Tannock I et al.: Design and end points of clinical trials for patients with progressive prostate cancer and castrate levels of testosterone: recommendations of the Prostate Cancer Clinical Trials Working Group. J. Clin. Oncol. 26, 1148–1159 (2008).
- Macdonald DR, Cascino TL, Schold SC, Cairncross JG: Response criteria for Phase II studies of supratentorial malignant glioma. J. Clin. Oncol. 8, 1277–1280 (1990).
- Choi H: Response evaluation of gastrointestinal stromal tumors. Oncologist 13(Suppl. 2), 4–7 (2008).
- Choi H, Charnsangavej C, Faria SC et al.: Correlation of computed tomography and positron emission tomography in patients with metastatic gastrointestinal stromal tumor treated at a single institution with imatinib mesylate: proposal of new computed tomography response criteria. J. Clin. Oncol. 25, 1753–1759 (2007).
- Benjamin RS, Choi H, Macapinlac HA et al.: We should desist using RECIST, at least in GIST. J. Clin. Oncol. 25, 1760–1764 (2007).
- Oxnard GR, Armato SG, Kindler HL: Modeling of mesothelioma growth demonstrates weaknesses of current response criteria. Lung Cancer 52, 141–148 (2006).
- Plathow C, Klopp M, Thieke C et al.: Therapy response in malignant pleural mesothelioma-role of MRI using RECIST, modified RECIST and volumetric approaches in comparison with CT. Eur. Radiol. 18, 1635–1643 (2008).
- Wahl RL, Jacene H, Kasamon Y, Lodge MA: From RECIST to PERCIST: evolving considerations for PET response criteria in solid tumors. J. Nucl. Med. 50(Suppl. 1), 122S–150S (2009).
- Sargent DJ, Rubinstein L, Schwartz L et al.: Validation of novel imaging methodologies for use as cancer clinical trial end-points. Eur. J. Cancer 45, 290–299 (2009).
- Ford R, Schwartz L, Dancey J et al.: Lessons learned from independent central review. Eur. J. Cancer 45, 268–274 (2009).
- US FDA: US FDA Oncology Drugs Advisory Committee Briefing Document for NDA 21–649 (Oblimersen Sodium). Genta Inc., NJ, USA (2004).
- US FDA: FDA Briefing Document Oncology Drugs Advisory Committee Meeting NDA 21801 (Satraplatin). DHHS, MD, USA (2007).
- US FDA: United States Food and Drug Administration Center for Drug Evaluation and Research. Approval Package for Application Number NDA 22–059 (Lapatinib Ditosylate). DHHS, MD, USA (2007).
- Levy MA, Rubin DL: Tool support to enable evaluation of the clinical response to treatment. AMIA Annu. Symp. Proc. 399–403 (2008).
- Bogaerts J, Ford R, Sargent D et al.: Individual patient data analysis to assess modifications to the RECIST criteria. Eur. J. Cancer 45, 248–260 (2008).
- Moskowitz CS, Jia X, Schwartz LH, Gönen M: A simulation study to evaluate the impact of the number of lesions measured on response assessment. Eur. J. Cancer 45, 300–310 (2009).
- Cagnon CH, Cody DD, McNitt-Gray MF, Seibert JA, Judy PF, Aberle DR: Description and implementation of a quality control program in an imaging-based clinical trial. Acad. Radiol. 13, 1431–1441 (2006).
- FitzGerald TJ, Urie M, Ulin K et al.: Processes for quality improvements in radiation oncology clinical trials. Int. J. Radiat. Oncol. Biol. Phys. 71, S76–S79 (2008).
- Kamauu AW, Whipple JJ, DuVall SL, Siddiqui KM, Siegel EL, Avrin D: Informatics in radiology: IHE teaching file and clinical trial export integration profile: functional examples. Radiographics 28, 933–945 (2008).
- Armato SG, Meyer CR, Mcnitt-Gray MF et al.: The Reference Image Database to Evaluate Response to therapy in lung cancer (RIDER) project: a resource for the development of change-analysis software. Clin. Pharmacol. Ther. 84, 448–456 (2008).
- Marcus DS, Olsen TR, Ramaratnam M, Buckner RL: The Extensible Neuroimaging Archive Toolkit: an informatics platform for managing, exploring, and sharing neuroimaging data. Neuroinformatics 5, 11–34 (2007).
- Keator DB, Grethe JS, Marcus D et al.: A national human neuroimaging collaboratory enabled by the Biomedical Informatics Research Network (BIRN). IEEE Trans. Inf. Technol. Biomed. 12, 162–172 (2008).
- Langlotz CP: RadLex: a new method for indexing online educational materials. Radiographics 26, 1595 (2006).
- Hussein R, Engelmann U, Schroeter A, Meinzer HP: DICOM structured reporting: part 1. Overview and characteristics. Radiographics 24, 891–896 (2004).
- Clunie DA: DICOM structured reporting and cancer clinical trials results. Cancer Inform. 4, 33–56 (2007).
- Channin DS, Mongkolwat P, Kleper V, Sepukar K, Rubin DL: The caBIG Annotation and Image Markup Project. J. Digit. Imaging 23, 217–225 (2010).
- Rubin DL, Rodriguez C, Shah P, Beaulieu C: iPad: semantic annotation and markup of radiological images. AMIA Annu. Symp. Proc. 626–630 (2008).
- Napel SA, Beaulieu CF, Rodriguez C et al.: Automated retrieval of CT images of liver lesions on the basis of image similarity: method and preliminary results. Radiology 256, 243–252 (2010).
- Wang F, Pan T, Sharma A, Saltz J: Managing and querying image annotation and markup in XML. Society of Photo-Optical Instrumentation Engineers (SPIE) Conference Series 7628, 3 (2010).
- Levy MA, Garg A, Tam A, Garten Y, Rubin DL: LesionViewer: a tool for tracking cancer lesions over time. AMIA Annu. Symp. Proc. 443–447 (2007).
- Levy MA, O’Connor MJ, Rubin DL: Semantic reasoning with image annotations for tumor assessment. AMIA Annu. Symp. Proc. 359–363 (2009).
- Clarke LP, Croft BS, Nordstrom R, Zhang H, Kelloff G, Tatum J: Quantitative imaging for evaluation of response to cancer therapy. Transl. Oncol. 2, 195–197 (2009).
- TRIAD: A new image acquisition and management system for medical imaging clinical trials https://triad.acr.org (Accessed 18 October 2010)
- MIRC: CTP – The RSNA Clinical Trial Processor http://mircwiki.rsna.org/index. php?title=CTP-The_RSNA_Clinical_Trial_ Processor (Accessed 19 January 2011)
- National Cancer Institute: National biomedical imaging archive https://cabig.nci.nih.gov/tools/NCIA (Accessed 18 October 2010)
- National Cancer Institute: Welcome to the national biomedical imaging archive https://imaging.nci.nih.gov/ncia (Accessed 18 October 2010)
- XNAT: XNAT documentation www.xnat.org (Accessed 18 October 2010)
- Biomedical Informatics Research Network: The conduit for biomedical research www.birncommunity.org (Accessed 18 October 2010)
- National Cancer Institute: Cancer Data Standards Registry and Repository (caDSR) https://cabig.nci.nih.gov/concepts/caDSR
- RSNA Informatics: Radlex www.rsna.org/informatics/radlex.cfm (Accessed 19 January 2011)
- RSNA Informatics: Radlex playbook www.rsna.org/Informatics/radlex_playbook. cfm (Accessed 19 January 2011)
- National Cancer Institute: Welcome to the caBIG® community website https://cabig.nci.nih.gov
- National Cancer Institute: Rembrandt application http://caintegrator-info.nci.nih.gov/ rembrandt 112 BIMM: Biomedical Image Metadata Manager http://bimm.stanford.edu
• • Describes a rational approach for the development of next-generation quantitative imaging biomarkers for cancer-response assessment. It describes many of the requirements for an imaging response biomarker to be deployed successfully in the clinical trial setting.
• • Seminal paper on the RadLex ontology. The RadLex ontology describes concepts and relationships between concepts in the clinical radiology domain. RadLex has been extended to support many user cases beyond indexing online education materials and continues to be actively developed.
• • Describes the Annotation Image Markup Standard. It describes the information model for annotation linking Digital Imaging and Communications in Medicine (DICOM) header information, image mark-up and clinical observations.
• • Describes a reference implementation for image annotation utilizing the Annotation Image Mark-up Standard. This implementation is created as a plug-in to the open-source OSIRIX DICOM viewer application.
■ Websites


