Review Article - Imaging in Medicine (2011) Volume 3, Issue 2
Advanced cross-sectional imaging techniques for the detection and characterization of renal masses
Tamara Oei1, Sandeep Hedgire1 & Mukesh Harisinghani†11Department of Radiology, Massachusetts General Hospital, Harvard Medical School, 55 Fruit Street, White 270, Boston, MA 02114, USA
- Corresponding Author:
- Harisinghani
Department of Radiology
Massachusetts General Hospital, Harvard Medical School
55 Fruit Street, White 270, Boston, MA 02114, USA
Tel: +1 617 726 8396
Fax: +1 617 726 4891
E-mail: mharisinghani@partners.org
Abstract
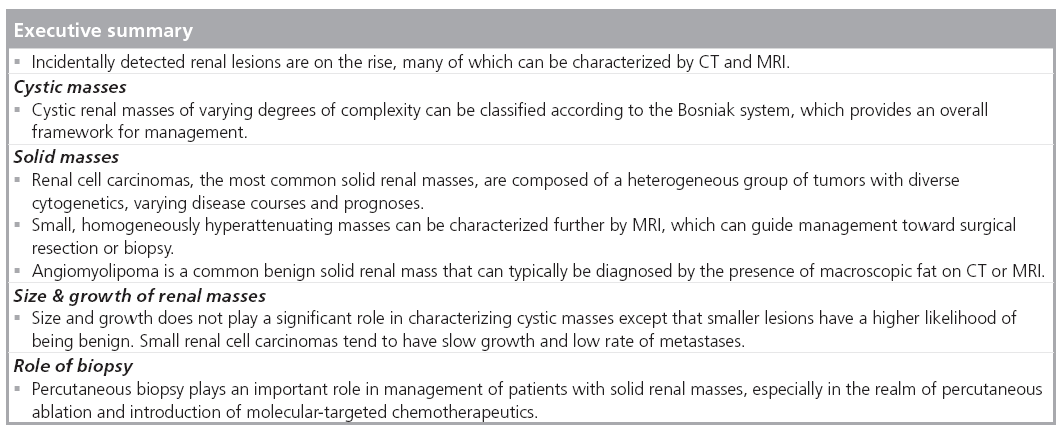
Incidentally detected renal masses are on the rise posing increasing demands on imaging for their characterization and management. These masses encompass both benign and malignant entities, many of which can be diagnosed with high confidence by cross-sectional imaging alone. Lesions can be predominantly cystic or solid and a key feature common to all malignant lesions is the presence of enhancing solid components. However, a substantial number of enhancing lesions are benign and when imaging is not conclusive, biopsy may help. Ongoing research shows that renal cell carcinoma, the most common renal malignancy, represents a heterogeneous disease entity, and future trends toward more precise imaging characterization would allow for a more individualized management approach.
Keywords
angiomyolipoma ▪ Bosniak ▪ hyperdense cyst ▪ renal biopsy ▪ renal cell carcinoma ▪ renal cyst ▪ renal mass
With the growing use of diagnostic imaging, there has been an increase in the number of incidentally detected renal lesions posing a unique challenge to the radiologist and the referring physician in terms of further management and treatment. Ultrasonography, often the first modality in which renal masses are detected, has limitations in precise characterization of these masses. Newer advances, such as contrast-enhanced ultrasonography, have shown some promising results in diagnosing malignant hypovascular renal tumors by detection of minimal vascularity [1]. Contrast-enhanced ultrasonography combined with color Doppler in detecting tumor vascularity and discriminating benign and malignant small renal masses has yielded encouraging results [2]. However, these techniques are not widely used in clinical practice and are limited to a few centers. This article will focus on crosssectional imaging techniques for the detection and characterization of renal masses.
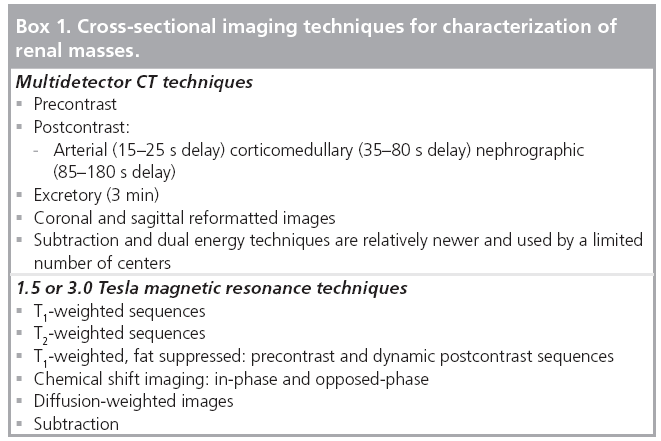
Incidentally detected renal masses can have benign and malignant etiologies that can frequently be distinguished by conventional crosssectional imaging. However, some lesions remain indeterminate by ultrasound or CT imaging and can be characterized further by advanced techniques, such as MRI (Box 1).
Types of renal masses
Renal masses can be categorized into those that are morphologically solid and those that are predominantly cystic by imaging (Figure 1). Within the two broad categories, both benign and malignant entities exist.

Figure 1: General algorithm for renal mass evaluation. AML: Angiomyolipoma; HU: Hounsfield units; RCC: Renal cell carcinoma. Data taken from [17].
Cystic masses
Cystic renal masses are encountered frequently and approximately half the population over 50 years of age have simple renal cysts [3]. The cystic renal masses may vary in appearance with overlap of benign and malignant etiologies even when complex imaging features, such as enhancement, are present.
Simple cysts have low attenuation with Hounsfield units (HU) approaching those of water, ranging from 0 to 20 HU. Complicated cysts have higher attenuation on unenhanced CT compared with renal parenchyma owing to the presence of protein or hemorrhage, termed hyperattenuating or ‘hyperdense’ cysts with attenuations ranging from 50 to 90 HU [4]. Whether simple or hyperattenuating, one can confidently characterize a lesion as a cyst by its lack of enhancement. Although the literature varies in what is considered to be true enhancement, a conservative criteria is a difference of 20 HU from unenhanced to postcontrast images in the nephrographic phase [5].
Differences in CT technology and reconstruction algorithm, especially in the era of dose reduction, has made the interpretation of HU more imprecise, where differences of less than 20 HU may not represent true enhancement and even a difference greater than 20 HU has been seen in a lesion that is a cyst, a phenomenon termed ‘pseudoenhancement’ [6]. Thus, a difference of 10–20 HU is considered indeterminate for enhancement [5,7]. On unenhanced CT, homogeneously hyperdense masses with attenuation values greater than 70 HU have been found to be benign, hyperdense cysts in 99.9% of cases [8]. On MRI, hemorrhagic cysts are typically hyperintense on T1-weighted images. Their T2 appearance is governed by the stage of the evolving blood products and varies from hypointense to hyperintense (Figure 2).

Figure 2: Hemorrhagic cyst. Axial T1 fat saturated image through the kidneys. Exophytic right renal hemorrhagic cyst is characterized by T1 high signal intensity
The widely adopted Bosniak classification uses CT imaging features of a cystic lesion to distinguish those with a high likelihood of being benign from those with features that strongly favor malignancy (Table 1). According to the Bosniak classification, a simple cyst with a thin nonenhancing wall is considered Bosniak I (benign) and a lesion with solid enhancing components is classified as Bosniak IV (malignant until proven otherwise). Cystic masses that fall between Bosniak I and IV are categorized according to the degree of complexity on CT.
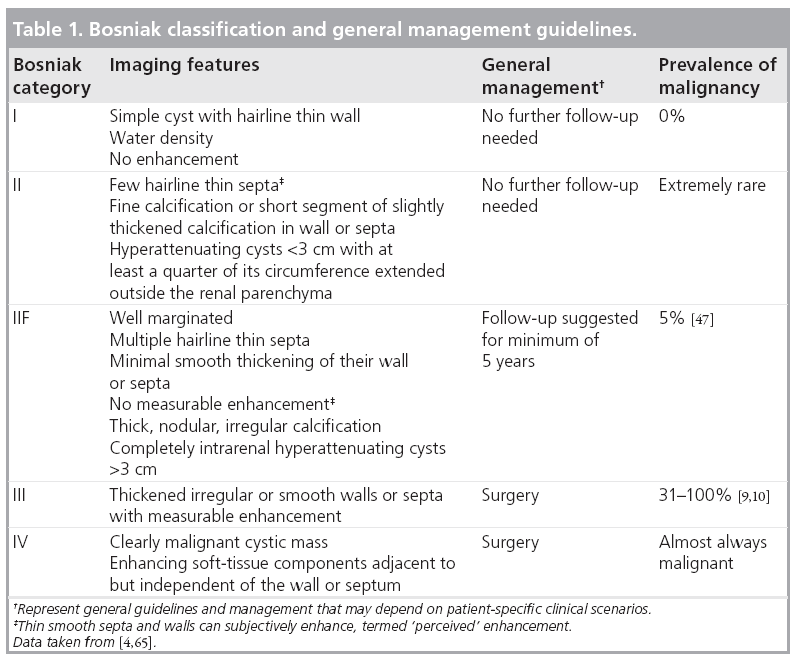
Bosniak category I and II are composed of benign lesions with minimal complexity and can reliably be left alone (Figure 3). Bosniak III and IV lesions require either biopsy to exclude malignancy or should be surgically resected (Figures 4 & 5). In the Bosniak III category, the incidence of malignancy reportedly ranges from 31 to 100% [9,10] with an average of 33% [3]. The revised Bosniak classification instituted category IIF for those lesions that are likely benign but require follow-up (Figure 6) [11]. Although there is no consensus on followup frequency and intervals, one article suggested follow-up should be at 6 months, then yearly for a minimum of 5 years as certain types of cystic renal cell carcinomas (RCCs) are slow growing [7].

Figure 3: Bosniak I and II. Contrast-enhanced CT in the nephrographic phase. A simple cyst (Bosniak I) is seen in the right kidney and an exophytic hyperdense cyst (Bosniak II) is present in the left kidney.

Figure 4: Bosniak III. Contrast-enhanced CT in the nephrographic phase shows an exophytic left renal cystic lesion with a thickened, enhancing irregular wall, which was an inflammatory cyst at surgery.

Figure 5: Bosniak IV. Contrast-enhanced CT in the corticomedullary phase shows a heterogeneous cystic mass in the right kidney with enhancing mural nodule, which was found to be a clear cell renal carcinoma at surgery.

Figure 6: Bosniak IIF. Contrast-enhanced CT in the corticomedullary phase shows a cystic mass in the left kidney with hairline thin septa (arrow) and no measurable enhancement.
Although the Bosniak classification was originally described for CT, it has been applied for lesions characterized by magnetic resonance (MR) because the latter has higher sensitivity for detection of soft tissue components and septations that might otherwise be imperceptible on CT [12].
While the Bosniak classification plays a critical role in categorizing a renal cyst as benign or malignant, significant interobserver variability is present, especially in distinguishing category II (nonsurgical) and III (surgical) lesions [3,11]. Approximately 31–100% of category III lesions are malignant [9,10]. Harisinghani et al. found malignancy in 17 of 27 Bosniak III lesions by percutaneous biopsy [13]. The majority of benign Bosniak III cysts are complicated cysts with inflammatory changes [14].
Certain conditions predispose patients to developing multiple renal cysts, including von Hippel-Landau, tuberous sclerosis, end-stage kidney disease and chronic lithium use (Figure 7). Multilocular cystic nephroma is a benign multicystic renal mass that is seen in two different demographics – young boys and middle-aged women (Figure 8). Although itself benign, its imaging appearance places it into the Bosniak III category as these lesions cannot reliably be distinguished from a cystic RCC and are thus surgically excised.

Figure 7: Lithium toxicity. Coronal T2-weighted magnetic resonance image shows innumerable small T2 hyperintense renal cysts replacing the renal parenchyma.

Figure 8: Multilocular cystic nephroma. Coronal T2-weighted magnetic resonance image shows a left-sided multiseparated cystic mass herniating into the renal pelvis.
Solid masses
A solid renal mass is suspected when the lesion enhances by at least 20 HU on CT. At MR, a lesion is considered to enhance when there is over 20% increase in T1 shortening from precontrast to postcontrast images [15–17]. Occasionally, ultrasound can be used as a problem-solving tool to determine if a lesion is cystic or solid as certain types of solid masses, such a papillary RCC, may show minimal enhancement (Figure 1).
Renal cell carcinoma
Renal cell carcinomas account for 90% of all malignant renal masses and are the primary consideration when encountering a solid enhancing renal mass in the absence of benign features, such as the presence of macroscopic fat in an angiomyolipoma (AML) [18,19]. Up to 30–40% of RCCs are incidentally discovered [20]. RCC is now known to represent a complex disease entity with wide biologic diversity encompassing a breadth of histologies and cytogenetics. Histologically, WHO 2004 classified RCCs into clear cell, papillary cell, chromophobe cell, granular cell, spindle cell and cyst-associated [19,21]. Of the various histologies, clear cell comprises approximately 70%, papillary 13–15% and chromophobe 6–11% [22]. It is important to distinguish between the various RCC subtypes because they respond differently to chemotherapies, have different disease courses and prognoses.
Clear cell RCC, the most common subtype, is heterogeneously hypervascular, enhancing to a similar degree as the renal cortex and when larger, contains areas of necrosis and hemorrhage (Figure 9) [19]. Kim et al. found that on CT, clear cell RCC enhances greater than 84 HU on corticomedullary phase and over 44 HU on excretory phase with a specificity of 100 and 91%, respectively [23]. At MR, clear cell subtype is typically hyperintense or isointense on T2-weighted images [24]. A subset of clear cell RCC shows signal drop on opposed-phase images with respect to in-phase images owing to the presence of intracytoplasmic lipid [24]. Clear cell RCC is noted to be more aggressive and carry a worse prognosis than papillary and chromophobe cell types. Patients with von Hippel-Landau can have multiple cysts that are precursors to clear cell subtype of RCC and close surveillance is best with MR [25–27].

Figure 9: Clear cell renal cell carcinoma. (A) Axial contrast-enhanced CT in the nephrographic phase shows a heterogenously enhancing mass arising from left renal medial kidney. (B) Histopathologic slide shows solid nests of clear cells separated by a vascular network, Fuhrman grade 2.
The second most common subtype, papillary RCC, is typically hypovascular and more homogeneous in appearance (Figure 10) [22,28]. On dynamic MR, papillary RCC shows a relatively slower rise in enhancement (measured by percentage signal intensity change) from unenhanced, to corticomedullary phase (32.1%) to nephrographic phase (96.6%) compared with clear cell RCC (205.6 and 247.1%, respectively) [22]. With MR, papillary RCC may be hypointense on T2-weighted images owing to their papillary architecture [29]. Papillary RCC commonly affects end-stage kidneys and is more often multifocal and bilateral than other RCC subtypes [30,31]. A total of 70% of papillary RCCs are completely intrarenal [32]. Papillary RCCs are typically found at a lower stage of progression and have a better prognosis than clear cell RCC [32]. Papillary RCCs can be further subclassified into two types based on histologic morphology – type 2 papillary RCCs are more aggressive and show poorer prognosis compared with type 1 [33,34].

Figure 10: Papillary renal cell carcinoma. (A) Coronal reformatted contrast-enhanced CT in the corticomedullary phase shows a low-density mass in the medial aspect of the left kidney with low-level enhancement. (B) Histopathologic image shows papillary structures are lined by pseudo-stratified tumor cells with eosinophilic cytoplasm and contains central blood vessels.
Staging RCC
Once a RCC is diagnosed, it is important to identify the extent of tumor involvement to guide management. The Robson staging system, originally introduced in the 1960s, has fallen out of favor as more focal and less invasive treatments for RCC, such as nephron-sparing surgery and percutaneous ablation, have emerged, which require more precise and accurate local and distant staging [18]. The tumor node metastasis staging system, now in its seventh revision, is the most widely used and accepted by the American Joint Committee of Cancer (AJCC). An important part of the tumor node metastasis staging classification is the presence of tumor thrombus in the renal veins and/or inferior vena cava and retroperitoneal lymphadenopathy. CT and MR have been shown to have a similar high degree of accuracy for staging RCC [35,36]. When widely metastatic, RCC hematogenously spreads to bones, lungs, mediastinum and other solid organs.
Angiomyolipoma
One benign entity that needs to be excluded when encountering a solid renal mass is an AML. It is the most common benign solid renal mass with a prevalence of 0.3–3% [37]. AMLs are ‘hamartomatous’ lesions containing fat, smooth muscle and vessels. Approximately 20% of patients with AMLs have tuberous sclerosis, while 80% with tuberous sclerosis have AMLs. AMLs can usually be distinguished from RCCs by the presence of macroscopic fat, both readily detectable on CT and MR (Figure 11). In a few case reports, RCCs have been shown to contain macroscopic fat, but when fat is present in these malignant tumors it is invariably accompanied by calcification as well [38–40].

Figure 11: Various appearances of angiomyolipomas. (A) Contrast-enhanced CT shows typical features of an angiomyolipoma containing macroscopic fat (arrow). (B) Contrast-enhanced CT shows a heterogeneously enhancing right intrarenal mass (arrow) without macroscopic fat, found to be an angiomyolipoma at biopsy. (C & D) Small hyperattenuating homogeneously enhancing exophytic right renal mass representing biopsy-proven angiomyolipoma with minimal fat.
Although the diagnosis of AML is usually straightforward, 5% of AMLs have minimal fat, making diagnosis of these solid renal masses indeterminate by CT imaging alone. Such AMLs are typically hyperattenuating (Figure 11) [17]. Based on a series of 175 resected solid tumors, a substantial portion (over 50%) of small (<3 cm), hyperattenuating, homogeneously enhancing renal masses will be benign AMLs with minimal fat, while the remainder will be RCCs [41]. Thus, such lesions found at CT would benefit from further MR characterization, the results of which would further guide the radiologist and refer clinicians toward biopsy or surgical resection of these masses (Figure 1).
When a hyperattenuating, homogeneously enhancing mass shows suppression from inphase to opposed-phased images, the lesion may represent a clear cell RCC or an AML with minimal fat, both lesions thought to be composed of intracytoplasmic fat [24]. For lesions that do not demonstrate signal suppression on chemical shift imaging, the T2 characteristics are important – those that are T2 hypointense are either papillary RCC or AML with minimal fat and should be biopsied, while those that are T2 iso/hyperintense most likely represent clear cell RCC [17,29].
Oncocytoma
Oncocytomas account for 5% of renal tumors and are benign solid renal masses, a third of which may have a central scar correlating with a spoke-wheel pattern of enhancement on angiography (Figure 12) [18,19,42]. These imaging features are neither sensitive nor specific for oncocytomas and have been associated with chromophobe RCCs [43]. Distinguishing between oncocytoma and RCC even by biopsy has traditionally been unreliable. However, current advances in immunocytochemical, histopathological and ultrastructural analyses have improved our ability to diagnose oncocytomas from biopsy specimens with more certainty [44].

Figure 12: Oncocytoma. Contrast-enhanced CT in the corticomedullary phase demonstrates a left renal enhancing mass with central spoke-wheel appearance – classic, yet not specific for an oncocytoma.
Multiple solid masses
In the setting of a known extrarenal primary neoplasm, metastatic disease should be a consideration when multiple solid renal masses are encountered. Other entities to be considered include lymphoma, which may present as multiple masses, a single mass, diffusely infiltrating renal mass or as perinephric stranding. Most commonly, renal lymphoma presents as one or more homogeneous masses with low level enhancement on CT (Figure 13) that are isointense to hypointense on T1-weighted images, and hypointense on T2-weighted images, with minimal enhancement on early and delayed phases [45]. In certain hereditary syndromes, such as von Hippel-Landau (Figure 14), multifocal RCC can be seen. Multifocal oncocytomas can be seen in the rare Birt-Hogg-Dube syndrome.

Figure 13: Renal lymphoma. Coronal reformatted contrast-enhanced CT shows bilateral hypoenhancing intrarenal masses (arrows).

Figure 14: Findings in von Hippel-Landau. T1-weighted, fat-saturated, gadoliniumenhanced MR image shows bilateral solid heterogeneously enhancing masses consistent with renal cell carcinomas (arrows). Numerous bilateral renal cysts are also present. Pancreatic cysts can also be seen.
Size & growth of renal masses
As renal masses are being detected incidentally at an increasing rate, they have also been found to present at smaller sizes. For cystic masses, size does not correlate as closely with incidence of malignancy as it does for solid masses. Although smaller cystic lesions are more likely benign, the larger cystic lesions are not necessarily associated with a higher malignancy rate [7]. The frequently encountered subcentimeter low attenuation lesions, which are difficult to characterize because of their small size, are noted to have an extremely low likelihood of malignancy. Depending on the clinical context (i.e., no history of extrarenal malignancy) and lack of visible complex features these very small hypodense lesions can be presumed to be benign and left alone [46]. Growth rate of a cystic mass is not a reliable indicator of malignancy. Benign cysts can grow rapidly and malignant cystic lesions may grow slowly [7]. A category IIF cystic mass that shows no growth after 5 years is unlikely to be malignant [47].
For solid masses, the smaller the lesion, the higher the probability of a benign pathology. In one study of 2770 resected solid masses, the rate of benign lesions was stratified according to size – benign masses were present in 25% of lesions under 3 cm, 30% of lesions under 2 cm and 44% of lesions under 1 cm [48]. In another series of 781 patients with primary RCC less than 3 cm in size, only one patient had distant metastases at presentation and only one subsequently developed metastatic disease after initial presentation [49].
Furthermore, as garnered from retrospective studies in which patients with known RCCs were managed by active surveillance, the natural history of a small RCC tends to be that of slow growth, usually at a rate of less than 0.5 cm per year and a low risk (0–5.7%) of metastases [50,51].
Role of PET
Hybrid imaging with PET/CT is widely used to image various malignancies. The most common radiotracer in clinical use is [18F]-fluoro- 2-deoxy-d-glucose (FDG), a glucose analog in which the degree of uptake reflects the metabolic activity of tissue. The excretion of FDG tracer via the genitourinary system, however, reduces the sensitivity for detection of primary renal lesions [52,53]. In one series of 66 patients with known or suspected RCC, FDG-PET had a sensitivity of 60% [54]. Furthermore, the degree of FDG uptake is variable among RCC of different Fuhrman grades and degree of tumor necrosis [53,55], leading to increased false-negative findings. Careful scrutiny of the contrast-enhanced CT portion of a PET/CT is imperative for improved renal mass detection and characterization. While FDG-PET has a limited role in characterization of primary renal masses, it has proven useful for restaging and detection of metastases [52].Furthermore, novel radiotracers, such as [11C]-acetate, a marker for lipid synthesis that is not excreted by the kidneys, are on the horizon and may change the direction of PET imaging in renal mass characterization [53].
Role of biopsy
With a rise in incidentally detected renal masses, there has been an increasing role for percutaneous biopsies, which are now widely accepted to be accurate and safe. A full-imaging work-up with CT and/or MR is advised prior to contemplated biopsy. A few renal masses remain indeterminate at imaging with a high enough probability of benignity that biopsy is warranted to obviate unnecessary surgeries and the inherent morbidities associated with them. Such masses in which biopsy could be considered include small hyperattenuating, homogeneously enhancing renal masses, indeterminate cystic renal masses (Bosniak III), renal mass in patients with extrarenal malignancy in which a lesion may represent primary or metastatic disease, and masses in which infection may be the etiology [44]. Several surgical series reported that approximately 20% of all resected small renal masses were benign [56–59]. Another series of 2770 resected solid masses of varying sizes noted a 12.8% benign rate with a higher probability of a benign diagnosis for smaller lesions [48]. In that series, 44% of solid enhancing masses less than 1 cm in size were benign. Some indications for renal mass biopsy include differentiation between primary and metastatic disease, characterization of renal masses in patients with surgical comorbidities, confirming benign diagnoses such as renal masses caused by infection and tissue characterization in patients with imaging findings suggestive of unresectable tumor [44]. Biopsy also plays a role in strategizing treatment such as percutaneous radiofrequency or cryoablation. Furthermore, with improved understanding of cytogenetics in tumor biology, biopsy of an RCC yields information that might help predict the natural behavior of the RCC subtype, and management, whether surgical, various chemotherapeutics, ablation or active surveillance, can be tailored on an individual basis.
Historically, renal biopsies have had a limited role in evaluation and management of renal masses because of uncertain diagnostic accuracy, safety and concern of tumor-seeding along the biopsy tract. Modern renal biopsy techniques and analysis of specimens has substantially improved diagnostic accuracy. Whereas traditionally benign biopsy results had a low negative predictive value in the case of AMLs and oncocytomas [56,60], newer cytologic techniques have increased the diagnostic accuracy of biopsies for both benign and malignant lesions. One study showed that image-guided biopsy of solid enhancing renal masses was diagnostic in 90% of biopsies and yielded a benign diagnosis in 27% of diagnostic biopsies [61].
Percutaneous renal biopsies have proven to be safe; one review of over 16,000 fine needle biopsies reported a mortality of 0.031% [62]. The morbidity is low with the most frequent complication being hemorrhage, and in one study of 150 biopsies a 5.3% rate of minor bleeding was reported [63]. Major bleeding requiring transfusion is rare [64]. The rate of tumor seeding is in the order of 0.01% [62].
Conclusion
Renal masses are becoming one of the most common incidentally found entities in abdominal imaging, creating increasing demands for their characterization and management. This diverse group of renal tumors includes benign and malignant lesions that vary from indolent and slow-growing, to aggressive. RCC, the most common solid renal mass, although sometimes cystic, is typically a straightforward diagnosis to make by cross-sectional imaging alone. Furthermore, certain benign entities, such as AMLs, can be characterized solely by imaging. Cystic lesions are categorized according to the Bosniak classification where the more complex the lesion, the more likely it is to be malignant.
The increase in the number of lesions presenting at a small size creates new challenges for imaging characterization. Although for solid masses, the likelihood of benignity is greater for smaller-sized lesions, all solid renal masses require full imaging work-up with CT and/ or MR. Certain masses that cannot be reliably characterized by CT could benefit from MR characterization, which although this does not always arrive at a definitive diagnosis, can narrow the differential and guide management toward biopsy, surgical resection or follow-up imaging.
Future perspective
With the rise in early detection of renal tumors in younger patients, cross-sectional imaging is more heavily utilized for characterization. For CT, protocols are usually multiphasic with higher radiation doses than the standard abdominal CT and, thus, efforts to develop CT protocols with less radiation are ongoing. Both CT and MR imaging techniques are expected to become more sophisticated, allowing for improved diagnostic accuracy as well as better ability for prediction of tumor behavior. Increasing utilization of advanced imaging and postprocessing tools, such as diffusionweighted imaging, subtraction imaging and dual-energy techniques, will enable us to better resolve uncertainties that remain with current diagnostic techniques. Furthermore, with added insights into the cytogenetics and molecular profiling of tumors, trends toward more precise imaging characterization will allow for better prediction of tumor behavior and prognosis so that management can be tailored on an individual basis.
Acknowledgements
The authors would like to acknowledge Chin-Lee Wu, MD, and Shulin Wu, MD, for providing histopathologic slides.
Financial & competing interests disclosure
The authors have no relevant affiliations or financial involvement with any organization or entity with a financial interest in or financial conflict with the subject matter or materials discussed in the manuscript. This includes employment, consultancies, honoraria, stock ownership or options, expert testimony, grants or patents received or pending, or royalties.
No writing assistance was utilized in the production of this manuscript.
References
Papers of special note have been highlighted as:
• of interest
• • of considerable interest
- Tamai H, Takiguchi Y, Oka M et al.: Contrast-enhanced ultrasonography in the diagnosis of solid renal tumors. J. Ultrasound Med. 24(12), 1635–1640 (2005).
- Pallwein L, Mitterberger M, Aigner F et al.: Small renal masses: the value of contrast-enhanced colour Doppler imaging. BJU Int. 99(3), 579–585 (2007).
- Warren KS, McFarlane J: The Bosniak classification of renal cystic masses. BJU Int. 95(7), 939–942 (2005).
- Robert C, Weissmann IAMEL: Computer Tomography Urography: An Atlas. Lippincott Williams & Wilkins, Philadelphia, PA, USA (2007).
- Israel GM, Bosniak MA: How I do it: evaluating renal masses. Radiology 236(2), 441–450 (2005).
- Birnbaum BA, Hindman N, Lee J, Babb JS: Renal cyst pseudoenhancement: influence of multidetector CT reconstruction algorithm and scanner type in phantom model. Radiology 244(3), 767–775 (2007).
- Silverman SG, Israel GM, Herts BR, Richie JP: Management of the incidental renal mass. Radiology 249(1), 16–31 (2008).
- Jonisch AI, Rubinowitz AN, Mutalik PG, Israel GM: Can high-attenuation renal cysts be differentiated from renal cell carcinoma at unenhanced CT? Radiology 243(2), 445–450 (2007).
- Curry NS, Cochran ST, Bissada NK: Cystic renal masses: accurate Bosniak classification requires adequate renal CT. AJR Am. J. Roentgenol. 175(2), 339–342 (2000).
- Lang EK: Renal cyst puncture studies. Urol. Clin. North Am. 14(1), 91–102 (1987).
- Siegel CL, McFarland EG, Brink JA et al.: CT of cystic renal masses: analysis of diagnostic performance and interobserver variation. AJR Am. J. Roentgenol. 169(3), 813–818 (1997).
- Prasad SR, Dalrymple NC, Surabhi VR: Cross-sectional imaging evaluation of renal masses. Radiol. Clin. North Am. 46(1), 95–111, vi-vii (2008).
- Harisinghani MG, Maher MM, Gervais DA et al.: Incidence of malignancy in complex cystic renal masses (Bosniak category III): should imaging-guided biopsy precede surgery? AJR Am. J. Roentgenol. 180(3), 755–758 (2003).
- Kissane JM: The morphology of renal cystic disease. Perspect. Nephrol. Hypertens. 4, 31–63 (1976).
- Ho VB, Allen SF, Hood MN, Choyke PL: Renal masses: quantitative assessment of enhancement with dynamic MR imaging. Radiology 224(3), 695–700 (2002).
- Hecht EM, Israel GM, Krinsky GA et al.: Renal masses: quantitative analysis of enhancement with signal intensity measurements versus qualitative analysis of enhancement with image subtraction for diagnosing malignancy at MR imaging. Radiology 232(2), 373–378 (2004).
- Silverman SG, Mortele KJ, Tuncali K, Jinzaki M, Cibas ES: Hyperattenuating renal masses: etiologies, pathogenesis, and imaging evaluation. Radiographics 27(4), 1131–1143 (2007).
- Williams LR, Oldale MJ, Bradley AJ: Imaging renal masses and staging renal tumours. Imaging (20), 73–86 (2008).
- Eble JN, Sauter G, Epstein JI, Sesterhenn IA: Pathology and genetics of tumours of the urinary system and male genital organs. In: WHO Classification of Tumours. Pathology and Genetics. IARC Press, Lyon, France (2004).
- Leslie JA, Prihoda T, Thompson IM: Serendipitous renal cell carcinoma in the post-CT era: continued evidence in improved outcomes. Urol. Oncol. 21(1), 39–44 (2003).
- Mostofi FK, Davis CJ: Histological typing of kidney tumours. In: International Classification of Tumours. World Health Organization, Springer, Berlin, Germany, 12 (1998).
- Sun MR, Ngo L, Genega EM et al.: Renal cell carcinoma: dynamic contrast-enhanced MR imaging for differentiation of tumor subtypes – correlation with pathologic findings. Radiology 250(3), 793–802 (2009).
- Kim JK, Kim TK, Ahn HJ et al.: Differentiation of subtypes of renal cell carcinoma on helical CT scans. AJR Am. J. Roentgenol. 178(6), 1499–1506 (2002).
- Outwater EK, Bhatia M, Siegelman ES, Burke MA, Mitchell DG: Lipid in renal clear cell carcinoma: detection on opposed-phase gradient-echo MR images. Radiology 205(1), 103–107 (1997).
- Choyke PL, Glenn GM, Walther MM, Zbar B, Linehan WM: Hereditary renal cancers. Radiology 226(1), 33–46 (2003).
- Kovacs G, Emanuel A, Neumann HP, Kung HF: Cytogenetics of renal cell carcinomas associated with von Hippel- Lindau disease. Genes Chromosomes Cancer 3(4), 256–262 (1991).
- Pavlovich CP, Walther MM, Eyler RA et al.: Renal tumors in the Birt-Hogg-Dube syndrome. Am. J. Surg. Pathol. 26(12), 1542–1552 (2002).
- Herts BR, Coll DM, Novick AC et al.: Enhancement characteristics of papillary renal neoplasms revealed on triphasic helical CT of the kidneys. AJR Am. J. Roentgenol. 178(2), 367–372 (2002).
- Oliva MR, Glickman JN, Zou KH et al.: Renal cell carcinoma: T1 and T2 signal intensity characteristics of papillary and clear cell types correlated with pathology. AJR Am. J. Roentgenol. 192(6), 1524–1530 (2009).
- Ishikawa I, Kovacs G: High incidence of papillary renal cell tumours in patients on chronic haemodialysis. Histopathology 22(2), 135–139 (1993).
- Polascik TJ, Bostwick DG, Cairns P: Molecular genetics and histopathologic features of adult distal nephron tumors. Urology 60(6), 941–946 (2002).
- Prasad SR, Humphrey PA, Catena JR et al.: Common and uncommon histologic subtypes of renal cell carcinoma: imaging spectrum with pathologic correlation. Radiographics 26(6), 1795–1806; discussion 1806–1810 (2006).
- Lee JH, Choi JW, Kim YS: The value of histologic subtyping on outcomes of clear cell and papillary renal cell carcinomas: a meta-analysis. Urology 76(4), 889–894 (2010).
- Vikram R, Ng CS, Tamboli P et al.: Papillary renal cell carcinoma: radiologic-pathologic correlation and spectrum of disease. Radiographics 29(3), 741–754; discussion 755–757 (2009).
- Catalano C, Fraioli F, Laghi A et al.: High-resolution multidetector CT in the preoperative evaluation of patients with renal cell carcinoma. AJR Am. J. Roentgenol. 180(5), 1271–1277 (2003).
- Hallscheidt PJ, Bock M, Riedasch G et al.: Diagnostic accuracy of staging renal cell carcinomas using multidetector-row computed tomography and magnetic resonance imaging: a prospective study with histopathologic correlation. J. Comput. Assist. Tomogr. 28(3), 333–339 (2004).
- Simpson E, Patel U: Diagnosis of angiomyolipoma using computed tomography-region of interest < or =-10 HU or 4 adjacent pixels < or =-10 HU are recommended as the diagnostic thresholds. Clin. Radiol. 61(5), 410–416 (2006).
- Helenon O, Chretien Y, Paraf F et al.: Renal cell carcinoma containing fat: demonstration with CT. Radiology 188(2), 429–430 (1993).
- Prando A, Prando D, Prando P: Renal cell carcinoma: unusual imaging manifestations. Radiographics 26(1), 233–244 (2006).
- Schuster TG, Ferguson MR, Baker DE, Schaldenbrand JD, Solomon MH: Papillary renal cell carcinoma containing fat without calcification mimicking angiomyolipoma on CT. AJR Am. J. Roentgenol. 183(5), 1402–1404 (2004).
- Jinzaki M, Tanimoto A, Narimatsu Y et al.: Angiomyolipoma: imaging findings in lesions with minimal fat. Radiology 205(2), 497–502 (1997).
- Kuroda N, Toi M, Hiroi M, Shuin T, Enzan H: Review of renal oncocytoma with focus on clinical and pathobiological aspects. Histol. Histopathol. 18(3), 935–942 (2003).
- Kondo T, Nakazawa H, Sakai F et al.: Spoke-wheel-like enhancement as an important imaging finding of chromophobe cell renal carcinoma: a retrospective analysis on computed tomography and magnetic resonance imaging studies. Int. J. Urol. 11(10), 817–824 (2004).
- Silverman SG, Gan YU, Mortele KJ, Tuncali K, Cibas ES: Renal masses in the adult patient: the role of percutaneous biopsy. Radiology 240(1), 6–22 (2006).
- Pedrosa I, Sun MR, Spencer M et al.: MR imaging of renal masses: correlation with findings at surgery and pathologic analysis. Radiographics 28(4), 985–1003 (2008).
- Bosniak MA, Rofsky NM: Problems in the detection and characterization of small renal masses. Radiology 198(3), 638–641 (1996).
- Israel GM, Bosniak MA: Follow-up CT of moderately complex cystic lesions of the kidney (Bosniak category IIF). AJR Am. J. Roentgenol. 181(3), 627–633 (2003).
- Frank I, Blute ML, Cheville JC et al.: Solid renal tumors: an analysis of pathological features related to tumor size. J. Urol. 170(6 Pt 1), 2217–2220 (2003).
- Thompson RH, Hill JR, Babayev Y et al.: Metastatic renal cell carcinoma risk according to tumor size. J. Urol. 182(1), 41–45 (2009).
- Abou Youssif T, Tanguay S: Natural history and management of small renal masses. Curr. Oncol. 16(Suppl. 1), S2–S7 (2009).
- Chawla SN, Crispen PL, Hanlon AL et al.: The natural history of observed enhancing renal masses: meta-analysis and review of the world literature. J. Urol. 175(2), 425–431 (2006).
- Kochhar R, Brown RK, Wong CO et al.: Role of FDG PET/CT in imaging of renal lesions. J. Med. Imaging Radiat. Oncol. 54(4), 347–357 (2010).
- Powles T, Murray I, Brock C, Oliver T, Avril N: Molecular positron emission tomography and PET/CT imaging in urological malignancies. Eur. Urol. 51(6), 1511–1521 (2007).
- Kang DE, White RL, Zuger JH, Sasser HC, Teigland CM: Clinical use of fluorodeoxyglucose F 18 positron emission tomography for detection of renal cell carcinoma. J. Urol. 171(5), 1806–1809 (2004).
- Bachor R, Kotzerke J, Gottfried HW et al.: Positron emission tomography in diagnosis of renal cell carcinoma. Urologe A. 35(2), 146–150 (1996).
- Dechet CB, Sebo T, Farrow G et al.: Prospective analysis of intraoperative frozen needle biopsy of solid renal masses in adults. J. Urol. 162(4), 1282–1284; discussion 1284–1285 (1999).
- Ozen H, Colowick A, Freiha FS: Incidentally discovered solid renal masses: what are they? Br. J. Urol. 72(3), 274–276 (1993).
- Remzi M, Ozsoy M, Klingler HC et al.: Are small renal tumors harmless? Analysis of histopathological features according to tumors 4 cm or less in diameter. J. Urol. 176(3), 896–899 (2006).
- Silver DA, Morash C, Brenner P, Campbell S, Russo P: Pathologic findings at the time of nephrectomy for renal mass. Ann. Surg. Oncol. 4(7), 570–574 (1997).
- Dechet CB, Zincke H, Sebo TJ et al.: Prospective analysis of computerized tomography and needle biopsy with permanent sectioning to determine the nature of solid renal masses in adults. J. Urol. 169(1), 71–74 (2003).
- Beland MD, Mayo-Smith WW, Dupuy DE, Cronan JJ, DeLellis RA: Diagnostic yield of 58 consecutive imaging-guided biopsies of solid renal masses: should we biopsy all that are indeterminate? AJR Am. J. Roentgenol. 188(3), 792–797 (2007).
- Smith EH: Complications of percutaneous abdominal fine-needle biopsy. Review. Radiology 178(1), 253–258 (1991).
- Veltri A, Garetto I, Tosetti I et al.: Diagnostic accuracy and clinical impact of imagingguided needle biopsy of renal masses. Retrospective analysis on 150 cases. Eur. Radiol. 21(2), 393–401 (2011).
- Tang S, Li JH, Lui SL et al.: Free-hand, ultrasound-guided percutaneous renal biopsy: experience from a single operator. Eur. J. Radiol. 41(1), 65–69 (2002).
- Israel GM, Bosniak MA: An update of the Bosniak renal cyst classification system. Urology 66(3), 484–488 (2005).
• • Discusses MR and CT renal mass evaluation with pitfalls in imaging and the role of biopsy.
• • Detailed step-by-step review of imaging work-up and proposed management of cystic and solid renal masses.
• • Discusses how MR features may distinguish various types of renal cell carcinoma from angiomyolipomas when encountering a homogeneously enhancing hyperattenuating renal mass.
• Organized by tumor type and reviews the epidemiology, imaging appearanceradiologic staging and surgical options of renal masses.
• Discusses indications and emerging indications for percutaneous renal biopsy. The technical aspects of performing a biopsy are discussed as well as safety and accuracy of the procedure.
• Natural history of small renal masses is discussed and implications for treatment and management.


