Review Article - Imaging in Medicine (2012) Volume 4, Issue 6
Right ventricular function in pulmonary hypertension
Per Lindqvist1 & Michael Y Henein*11Heart Centre & Department of Public Health & Clinical Medicine, Umea University, Umea, Sweden
- Corresponding Author:
- Michael Y Henein
Heart Centre & Department of Public Health & Clinical Medicine
Umea University, Umea, Sweden
E-mail: michael.henein@medicin.umu.se
Abstract
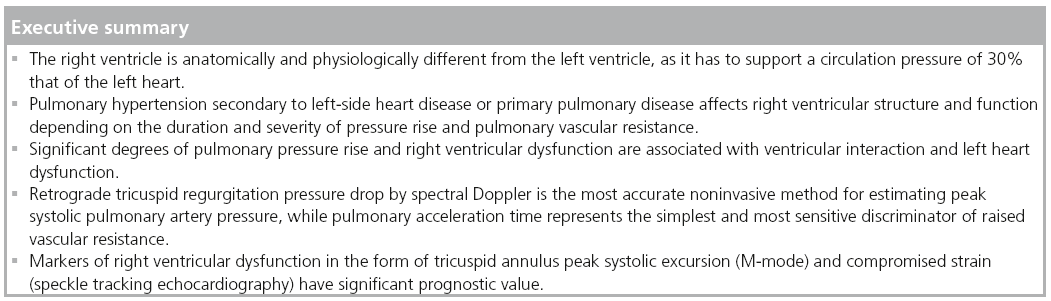
The right ventricle has recently attracted a lot of attention, having been shown to have a central function in overall cardiac performance in heart failure, cardiac surgery and congenital heart disease. Furthermore, in most of these cases the right ventricle has shown a strong prognostic value, irrespective of other cardiac disturbances. This has stimulated clinicians and researchers to identify noninvasive markers of right ventricular dysfunction using various technologies, for example, echocardiography and cardiac MRI. This review summarizes the role of right ventricular function in pulmonary hypertension and the most reliable markers of dysfunction, which should be routinely used in managing such cases.
Keywords
Doppler echocardiography ▪ pulmonary hypertension ▪ pulmonary vascular resistance ▪ right ventricle
Normal anatomy of the right ventricle
The right ventricle (RV) is an important pump that is characterized by specific anatomical features. Morphologically, the RV is made up of three compartments: an inlet, apical and outf low tract. In addition, the myocardial fiber architecture of each compartment has a particular pattern, with the inlet part supported mainly by longitudinal fibers running from the apex of the RV to the insertion site, around the circumference of the tricuspid annulus and the outflow tract compartment, mainly controlled by circumferential fibers, which cause narrowing of the outflow tract in systole [1]. The right ventricular shape also has distinctive features as it is wrapped around the body of the left ventricle (LV), making the cavity a crescent-like shape in cross-section. Furthermore, this anatomical design of the RV results in a significantly wider angle of approximately 40° between the inlet axis and the outflow tract axis, compared with a respective 15–20° in the cylindrical-shaped LV [2]. Such design has significant implications on the overall function of the RV, with the inlet compartment contracting 20 ms before the outflow-tract compartment in order to keep its peristaltic movement, which is required for keeping the intracavitary circulation going and directing the blood out into the pulmonary arterial tree. Finally, it seems that the circumferential contraction of the outflow tract, part of the RV, has an important effect in maintaining a significantly high tension during systole, resulting in competent function of its infundibulum part and subvalvular support of the pulmonary valve unidirectional function.
Normal right ventricular physiology
Right ventricular–pulmonary circulation coupling is an important physiological phenomenon. Normally, the RV pumps against a pressure of 30 mmHg, which is one-quarter that of the LV. This difference in afterload clearly matches the difference in the design of the two pumps, with right ventricular free-wall thickness significantly less than that of the LV [3]. In patients in whom the anatomical RV supports high afterload, for example, those with congenitally corrected transposition of the great arteries, the chronic rise in afterload affects the RV, causing the walls to become thick and the cavity enlarged. The order of changes is not always the same in the LV when it faces abnormally high afterload. In this case, the left ventricular wall becomes hypertrophied, but the overall cavity function is maintained. Despite these differences in structure and function of the two ventricles, they abide by similar electrical and mechanical roles. The RV starts to contract shortly after the Q wave of the ECG, resulting in a period of electromechanical delay, which is significantly shorter than that of the LV [4]. This could be explained by the direct longitudinal shortening of the right ventricular inlet in comparison with the significant shape change happening during the same isovolumic contraction time in the LV [5]. At the end of ejection and the end of systolic activity, the two ventricles, again, differ in their behavior in early diastole. Shortly after pulmonary valve closure, the RV has a very short, or even an absent isovolumic relaxation time compared with the approximately 80 ms isovolumic relaxation time of the LV. These differences are also due to the opposite effect of early changes in cavity shape before mitral valve opening on the left side and tricuspid valve opening on the right side. However, the pattern of filling of the two ventricles is similar in that they both show two components, an early diastolic one and a late diastolic (atrial systolic) one. The main difference in the filling pattern of the two ventricles is the velocity, which reflects the loading conditions of the two ventricles, being significantly higher in the LV than in the RV. Finally, along with the difference in afterload, the ejection velocity of the two ventricles differs significantly, being higher on the left side compared with the right side.
Pulmonary hypertension pathophysiology
Pulmonary hypertension (PH) ref lects an increase in the pulmonary circulation pressure. This is determined by the exact site of the pulmonary circulation affected. Patients with severe left heart problems for example, mitral valve disease, regurgitation or stenosis, or left ventricular disease are described as having a postcapillary rise in pulmonary circulation pressure compared with those with precapillary PH (e.g., idiopathic, familial or associated pulmonary arterial hypertension, secondary to pulmonary disease or chronic thromboembolic PH) [6]. While the level of pathology with respect to the RV is different in the two conditions, their effect on the cavity could be similar, mainly in the form of hypertrophy with maintained systolic function in early disease, but impaired function and cavity enlargement with development of tricuspid regurgitation in late disease. Treatment of the primary pathology might preserve right ventricular function. Similar results, however, might not be achieved in patients with precapillary PH when treating the primary pulmonary circulation disease [7]. This difference is also supported by the exact nature of the pathology of the two conditions, with the pulmonary vascular resistance normal but pulmonary capillary pressure rising in the postcapillary PH and vice versa in the precapillary PH in most cases. However, it is not uncommon to have an overlap between the two conditions [8].
Assessment of PH
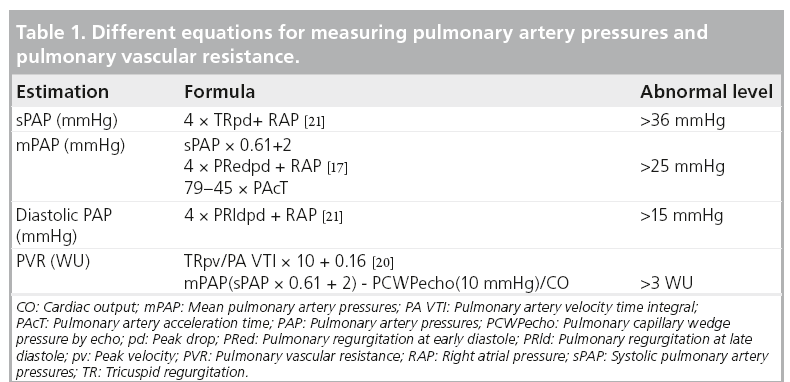
Accurate assessment of pulmonary artery pressure (PAP) is made invasively by direct measurements of the right-sided heart pressure (Table 1). However, this can now be achieved noninvasively using Doppler echocardiography [9]. The principle is simple and highly reproducible, based on the peak retrograde transtricuspid pressure drop obtained by continuous-wave Doppler. Applying the modified Bernoulli equation 4 × V2 has been shown to closely correlate with the peak pulmonary artery systolic pressure obtained invasively [10]. However, it should be mentioned that the velocity conversion to pressure is strictly a reflection of the pressure drop across the tricuspid valve, considering the variability in right atrial pressure (RAP) rather than direct measurement of pulmonary artery systolic pressure. With a rise in RAP due to a stiff RV or significant tricuspid regurgitation, the retrograde pressure drop across the tricuspid valve is likely to be underestimated. PAP could also be estimated from the diastolic retrograde pressure drop across the pulmonary valve between the pulmonary artery and the RV from the pulmonary regurgitation continuouswave Doppler velocities. This reflects mean pulmonary artery diastolic pressure, which has also been shown to correlate closely with invasive measurements [11].
Assessments of right ventricular function
The current guidelines state that transthoracic echocardiography is the first-line diagnostic tool for the assessment of PH and its effect on the cardiac chambers’ size and function [6]. Also using the same technique, estimation of the PAPs and the pulmonary vascular resistance (PVR), right heart size and function, presence of pericardial effusion, left heart size and function and the presence of valvular dysfunction can all be accurately achieved [12,13]. The additional use of a simple cavity contrast (commonly agitated saline) is very sensitive in confirming intracardiac shunt as a potential cause for PH, particularly with the Valsalva maneuver, for example, atrial septal defect or intrapulmonary arterio-venous shunting. Transesophageal echocardiography might be useful in detecting abnormal shunt flow and contrast enhancement may optimize the Doppler signal of tricuspid regurgitation flow. Cardiac MRI is the current gold standard imaging technique in delineating clear images of the cardiac chambers, as well as any anatomical anomalies that lead to PH [14,15]. High-resolution computed tomography might be useful in determining right heart size, abnormal intra- and extra-cardiac flow patterns and the presence of a thrombo-embolic source for PH [16].
Hemodynamic changes in PH
When PH is suspected, as mentioned above, Doppler echocardiography should be employed to assess tricuspid regurgitation peak retrograde pressure drop as an estimate of peak systolic PAP (sPAP). When adequate signals are obtainable and in the absence of significant right ventricular outf low tract obstruction, both tricuspid regurgitation pressure drop and pulmonary artery flow pattern allow accurate estimation of sPAP, mean and end diastolic PAP, as well as pulmonary vascular resistance (Figure 1) [17,18]. To avoid any possible error in assessing the degree of PH (e.g., in severe cardiac failure and hyperkinetic circulation), estimation of PVR is usually recommended. Estimation of pulmonary resistance depends on the calculation of pulmonary pressure and cardiac output. Using the following simplified formula, tricuspid regurgitation peak retrograde velocity or tricuspid regurgitation peak retrograde pressure drop/VTI from RVOT [19].

Figure 1: Tricuspid regurgitation peak retrograde velocity and pressure
drops (left) and pulmonary artery acceleration time (right).
AT: Acceleration time.
The authors have recently reported a simple method that can easily be used to estimate PVR by calculating mean PAPecho (sPAP × 0.61 + 2) – pulmonary capillary wedge pressure echo/cardiac output (from the left ventricular outflow tract) [20]. However, the main limitation of the method is the accurate estimation of pulmonary capillary wedge pressure, which reflects left atrial pressure in patients with raised precapillary pressures. We have also found that the pulmonary artery acceleration time of less than 90 ms is very sensitive in discriminating between pre- and post-capillary PH and identifying patients with woods units >3.
Estimation of RAP is an ongoing topic of discussion and a number of measures [13], as well as a fixed value of 7 or 10 mmHg in patients without right heart failure, have been proposed [10,21]. Inferior vena cava diameter and collapsibility with inspiration has also been found to correlate with RAP and is probably now the most commonly used [22].
Cardiac structural changes in PH
In severe PH, the four cardiac chambers are affected in shape and size. While the right atrium and ventricle become significantly enlarged, the left atrium and ventricle become compressed and reduced in size. Accurate measurements of cardiac chambers, particularly the ventricles, are of clinical importance for diagnostic and prognostic purposes. Using echocardiography, the right and left heart dimensions can be measured from both parasternal and apical views. A simple assessment indicating an abnormal pressure overload relationship between the left and right heart chambers is performed by evaluating the motion of the ventricular and atrial septa, respectively, and the ratio of the size of the LV and RV. If the RV is larger than the left, in addition to the septum bulging towards the LV during systole, it strongly indicates a pressure overloaded RV (Figures 2 & 3). In a longstanding PH, right ventricular hypertrophy develops, resulting in a wall thickness of more than 5 mm [13]. As the disease progresses, the right atrium increases in size, and consequently results in significant changes in tricuspid valve structure and function in the form of increased tenting area, poor leaflet coaption and significant regurgitation, which, in late stages of PH, might become torrential [23,24]. Patients with such a degree of disease present with congestive heart failure, fluid retention and raised jugular venous pressure, which is complicated later by impaired kidney function with its known manifestations and clinical complications. 3D echocardiography has good potential in determining RV volumes and ejection fraction as an estimate of systolic function [25,26]; however, the method remains limited to research activities and limited for widespread clinical use, as volumes seem to be consistently underestimated [27]. Similar volume information could be obtained from cardiac MRI, if available.

Figure 2: Apical four chamber view
showing a dilated right heart in a patient
with pulmonary hypertension.
IAS: Inter-atrial septum; IVS: Inter-ventricular
septum;
LA: Left atrium; LV: Left ventricle;
RA: Right atrium; RV: Right ventricle.

Figure 3: Abnormal right ventricle and left
ventricle size ratio and bowing septum to
the left ventricle, giving a systolic D-shape.
IVS: Inter-ventricular septum;
L1: Anteroposterior diameter; L2: Transverse
diameter;
LV: Left ventricle; RV: Right ventricle.
Right ventricular functional changes in PH
Quantification of global and regional right ventricular function is still challenging due to the complex geometry of the RV (as mentioned above) and also due to its thin-walled myocardium. A simple approach to measure the tricuspid plane systolic excursion (TAPSE) by 2D or M-mode echocardiography is probably the most commonly used method for assessing RV systolic function (Figure 4) [28]. Normal values for TAPSE have been reported and shown to be consistently >18 mm, irrespective of age [29]. The authors have also found [Henein MY et al., Unpublished Data] in 256 healthy subjects from the Swedish population that normal TAPSE is in the order of 25 ± 4 mm. TAPSE has also been found to correlate well with right ventricular ejection fraction [30]. However, it has limitations for remaining within normal values despite a severe rise in pulmonary pressures. Early diastolic markers of right ventricular function in the form of prolonged isovolumic relaxation time (in the presence of normal right atrial pressure) is a more sensitive measure to changes in pulmonary pressures [31]. Furthermore, TAPSE can erroneously overestimate right ventricular function in patients with dilated cavity and volume overloaded RV by, for example, severe tricuspid regurgitation [32]. 3D echocardiography might overcome this limitation by improving volume assessment and thus has an important role in determining accurate RV ejection fraction [33,34].

Figure 4: Tricuspid annulus peak systolic
excursion in a patient with pulmonary
hypertension.
IVRT: Cavity isovolumic contraction and
relaxation; PASPecho: Pulmonary artery systolic
pressue (echo); RV: Right ventricle;
TAPSE: Tricuspid plane systolic excursion.
Myocardial tissue Doppler imaging (TDI) is a more robust method for assessing right ventricular mechanical function by displaying right ventricular lateral wall systolic and diastolic velocities in a reproducible way. In 1999, Alam et al. reported normal measures of right ventricular function [35] and in 2001, Ionescu et al. demonstrated the use of TDI in detecting and monitoring deterioration of patients with cystic fibrosis [36]. TDI, both as pulsed and color approaches, has already become a well-established method for assessing right ventricular function and is highly recommended for routine follow-up of PH patients [37]. Today there are 310 hits on PubMed using the search terms of ‘TDI’ and ‘pulmonary hypertension’. Using pulsed or color TDI the systolic (s’), early diastolic (e’) and late atrial velocities (a’) can quite reliably be measured, as well as the time intervals of isovolumic contraction and relaxation (ivct’ and ivrt’) (Figure 5) [13]. From the authors own data, they have found normal RV freewall myocardial velocities to be approximately 25 cm/s, with a reduction of the diastolic velocities with increasing age [38]. Furthermore, we and others have found that prolonged ivrt’ from pulsed TDI (>75 ms corrected for heart rate) accurately identified patients with sPAP >40 mmHg, a marker that has proved the best in identifying patients with raised PAP [39].

Figure 5: Pulsed wave myocardial Doppler
imaging in pulmonary hypertension.
ivrt´: Myocardial isovolumic contraction and
relaxation; PASPecho: Pulmonary artery systolic
pressue (echo); s’: Systolic velocity.
Right ventricular myocardial deformation
Both amplitudes (from M-mode and color TDI) and velocities (from color and pulsed TDI) are limited in providing a thorough assessment of right ventricular function, since they register only tricuspid annulus motion rather than intrinsic myocardial function [13]. Therefore, a method that measures the detailed motion of a larger myocardial segment is preferred. Strain and strain rate is such a method that measures the differences in amplitude and velocity between two segments defined from a chosen region of interest. 1D strain from color-coded TDI has been shown to be modestly useful in estimating the PVR [40] and by assessing the dyssynchrony between the RV and septal segment, having shown to determine disease severity (Figure 6) [41]. However, since it is Dopplerbased strain measurements, it is limited in its application for being angle dependent and having a significant signal-to-noise ratio. It should be noted that speckle-tracking measurements of the RV currently remains a research tool rather than a routine clinical one.

Figure 6: Tissue Doppler imaging-based
myocardial strain in pulmonary
hypertension.
IVS: Inter-ventricular septum;
PASPecho: Pulmonary artery systolic pressure
(echo); RV: Right ventricle.
The 2D strain technique is a method based on tracking the motion of the echogenic spots or speckles from grayscale images within the myocardium in two simultaneous directions. As a non-Doppler-based algorithm in the assessment of myocardial function, it is recognized as being angle independent (Figure 7) [13]. Myocardium strain and strain rate have been found to be related to the pulmonary pressures and PVR, and also to patients’ exercise capacity (assessed by 6-min walking distance) [42]. However, the thin-walled RV limits the possibility of having a reliable tracking of the ventricle.

Figure 7: Speckle tracking echocardiography
in pulmonary hypertension.
IVS: Inter-ventricular septum; RV: Right
ventricle.
Ventricular interaction
Owing to the RV and LV being linked together via the interventricular septum and outwardly sharing the pericardial sac, as well as the two ventricles pump the same stroke volume, they must have clear evidence for cavity interaction. When the RV enlarges, the LV decreases in volume giving an abnormal LV-eccentricity index – that is, the antero–posterior dimension becomes larger than the septo–lateral dimension, which makes the LV cavity D-shaped. This is a classic picture of the LV in patients with significant PH [43]. Such abnormal shape change alters mainly LV diastolic function, so long as myocardial function is preserved [44]. This is commonly shown by Doppler as a reduced E/A ratio, prolonged deceleration and isovolumic relaxation time (Figure 8).

Figure 8: Mitral Doppler flow in a patient
with pulmonary arterial hypertension
(systolic pulmonary artery pressure
90 mmHg).
DT: Deceleration time; IVRT: Cavity isovolumic
contraction and relaxation.
Right ventricular function & exercise capacity
Currently, there are no clinical guidelines for the use of stress echocardiography in confirming the diagnosis of PH, particularly in symptomatic patients with only a modest rise in transtricuspid pressure drop. Studies have shown that exercise induces raised PA pressure in patients with systemic sclerosis, which might be an important early marker for PH [45]. However, it has to be remembered that pulmonary pressures also increase with age and during exercise, making isolated pressure measurements for diagnosing pulmonary arterial hypertension unsatisfactory [46]. Adjusting for the pulmonary flow improves the accuracy of the measurements, hence estimation of PVR is more attractive [47]. However, calculation of PVR is based on estimation of pulmonary pressures, cardiac output and pulmonary capillary wedge pressure; and the latter is known to be difficult when using Doppler echocardiography [48].
Treatment of PH & right ventricular function
Surgical treatment of PH in the form of thrombectomy has been demonstrated to improve right ventricular function [49]. This is the reverse of the right ventricular changes seen in acute significant pulmonary embolism when the systolic function drops and the cavity shows some degree of dilatation. Recent medical treatment of PH, for example, bosentan and sildenafil, have successfully resulted in a significant reduction in pulmonary vascular resistance and consequently, improvements in patients’ exercise capacity [50]. However, the effect of such treatment on intrinsic right ventricular function remains debatable [51]. This suggests a remodeling change of the right ventricular cavity as a response to long-standing PH, which might only be partially reversible with treatment, as is the case with the LV. Patients with PH secondary to lung disease have been shown to have significant improvement in right ventricular function after lung transplantation. Finally, treatment of secondary PH (precapillary) has been shown to significantly improve right ventricular function when the left heart pathology is corrected. Following mitral valve replacement or optimum vasodilatation with angiotensin-converting enzyme-inhibitors or angiotensin receptor blocker therapy for raised left atrial pressure in patients with left ventricular disease, there was a significant reduction in tricuspid regurgitation severity, PH pressure and improvement of right ventricular function and size [52]. Follow-up of right ventricular structure and function can easily be achieved by 2D, 3D echocardiography, or MRI scanning. In view of the detailed assessment described above, it is clear that Doppler 2D echocardiography is the ideal tool for assessing time relations. 3D echocardiography and MRI provide comparable volume measurements.
Prognostic value of assessing right ventricular function
Right ventricular enlargement and increase of inlet diameter have been shown to reflect cavity disease and prognosis [53]. Early identification and treatment of the underlying pathology reverses such disturbances. In patients with established right ventricular abnormalities, functional parameters have been shown to predict exercise capacity and clinical outcome. A reduced TAPSE of <15 mm has been shown to be associated with poor survival [23]. Additional severe tricuspid regurgitation and right atrial dilatation worsens the prognosis [54]. Likewise, a reduced freewall strain is associated with recurrent cardiac events and poor survival [55]. Such markers should be regularly used to provide accurate follow-up information and the potential need for intervention.
Conclusion
From the above evidence it is clear that the RV plays an important role in maintaining overall cardiac function in PH. Its intrinsic function, as well as its interaction with the LV, determines the stroke volume and cardiac output. While correcting left heart causes of PH may improve right ventricular function, the effect of respective treatment of primary pulmonary vascular disease remains to be determined. Further studies using sophisticated noninvasive measurements of right ventricular function may help to detect early disease and predicting functional recovery.
Future perspective
A clear understanding and appreciation of the importance of right ventricular function is expected to attract the attention of cardiac researchers and scientists to study its implication in various conditions. Evidence already exists supporting the crucial prognostic value of the RV in predicting exercise capacity, as well as survival, in some syndromes. This is likely to be explored in other conditions, particularly those in which right ventricular loading could have a detrimental impact on clinical outcome. In doing so, the RV should be seen to be as important as the LV in maintaining overall cardiac performance.
Financial & competing interests disclosure
The authors have no relevant affiliations or financial involvement with any organization or entity with a financial interest in or financial conflict with the subject matter or materials discussed in the manuscript. This includes employment, consultancies, honoraria, stock ownership or options, expert testimony, grants or patents received or pending, or royalties.
No writing assistance was utilized in the production of this manuscript.
References
- Greenbaum RA, Ho SY, Gibson DG, Becker AE, Anderson RH. Left ventricular fibre architecture in man. Br. Heart J. 45(3), 248–263 (1981).
- Henein MY, Zhao Y, Nicoll R et al. The human heart: application of the golden ratio and angle. Int. J. Cardiol. 150(3), 239–242 (2011).
- Dell’Italia LJ, Santamore WP. Can indices of left ventricular function be applied to the right ventricle? Prog. Cardiovasc. Dis. 40(4), 309–324 (1998).
- Jurcut R, Giusca S, Ticulescu R et al. Different patterns of adaptation of the right ventricle to pressure overload: a comparison between pulmonary hypertension and pulmonary stenosis. J. Am. Soc. Echocardiogr. 24(10), 1109–1117 (2011).
- Henein M. Ventricular long axis function. Thesis, Imperial College, London, UK (1997).
- Galie N, Hoeper MM, Humbert M et al. Guidelines for the diagnosis and treatment of pulmonary hypertension: the task force for the diagnosis and treatment of pulmonary hypertension of the European Society of Cardiology (ESC) and the European Respiratory Society (ERS), endorsed by the International Society of heart and lung transplantation (ISHLT). Eur. Heart J. 30(20), 2493–2537 (2009).
- van de Veerdonk MC, Kind T, Marcus JT et al. Progressive right ventricular dysfunction in patients with pulmonary arterial hypertension responding to therapy. J. Am. Coll. Cardiol. 58(24), 2511–2519 (2011).
- Frost AE, Farber HW, Barst RJ, Miller DP, Elliott CG, McGoon MD. Demographics and outcomes of patients diagnosed with pulmonary hypertension with pulmonary capillary wedge pressures of 16–18 mmHg: insights from REVEAL. Chest doi:10.1378/ chest.11-1387 (2012) (Epub ahead of print).
- Galie N, Hoeper MM, Humbert M et al. Guidelines for the diagnosis and treatment of pulmonary hypertension. Eur. Respir J. 34(6), 1219–1263 (2009).
- Currie PJ, Seward JB, Chan KL et al. Continuous wave Doppler determination of right ventricular pressure: a simultaneous Doppler-catheterization study in 127 patients. J. Am. Coll. Cardiol. 6(4), 750–756 (1985).
- Celermajer DS, Marwick T. Echocardiographic and right heart catheterization techniques in patients with pulmonary arterial hypertension. Int. J. Cardiol. 125(3), 294–303 (2008).
- Badano LP, Ginghina C, Easaw J et al. Right ventricle in pulmonary arterial hypertension: haemodynamics, structural changes, imaging, and proposal of a study protocol aimed to assess remodelling and treatment effects. Eur. J. Echocardiogr. 11(1), 27–37 (2010).
- Rudski LG, Lai WW, Afilalo J et al. Guidelines for the echocardiographic assessment of the right heart in adults: a report from the American Society of Echocardiography endorsed by the European Association of Echocardiography, a registered branch of the European Society of Cardiology, and the Canadian Society of Echocardiography. J. Am. Soc. Echocardiogr. 23(7), 685–713; quiz 786–788 (2010).
- Ibrahim ES, White RD. Cardiovascular magnetic resonance for the assessment of pulmonary arterial hypertension: toward a comprehensive CMR exam. Magn. Reson. Imaging 30(8), 1047–1058 (2012).
- Vonk-Noordegraaf A, Souza R. Cardiac magnetic resonance imaging: what can it add to our knowledge of the right ventricle in pulmonary arterial hypertension? Am. J. Cardiol. 110(Suppl. 6), S25–S31 (2012).
- Rajaram S, Swift AJ, Capener D et al. Comparison of the diagnostic utility of cardiac magnetic resonance imaging, computed tomography, and echocardiography in assessment of suspected pulmonary arterial hypertension in patients with connective tissue disease. J. Rheumatol. 39(6), 1265–1274 (2012).
- Chemla D, Castelain V, Humbert M et al. New formula for predicting mean pulmonary artery pressure using systolic pulmonary artery pressure. Chest 126(4), 1313–1317 (2004).
- Bossone E, Bodini BD, Mazza A, Allegra L. Pulmonary arterial hypertension: the key role of echocardiography. Chest 127(5), 1836–1843 (2005).
- Abbas AE, Fortuin FD, Schiller NB, Appleton CP, Moreno CA, Lester SJ. A simple method for noninvasive estimation of pulmonary vascular resistance. J. Am. Coll. Cardiol. 41(6), 1021–1027 (2003).
- Lindqvist P, Soderberg S, Gonzalez MC, Tossavainen E, Henein MY. Echocardiography based estimation of pulmonary vascular resistance in patients with pulmonary hypertension: a simultaneous Doppler echocardiography and cardiac catheterization study. Eur. J. Echocardiogr. 12(12), 961–966 (2011).
- Chan KL, Currie PJ, Seward JB, Hagler DJ, Mair DD, Tajik AJ. Comparison of three Doppler ultrasound methods in the prediction of pulmonary artery pressure. J. Am. Coll. Cardiol. 9(3), 549–554 (1987).
- Daniels LB, Krummen DE, Blanchard DG. Echocardiography in pulmonary vascular disease. Cardiol. Clin. 22(3), 383–399, vi (2004).
- Ghio S, Klersy C, Magrini G et al. Prognostic relevance of the echocardiographic assessment of right ventricular function in patients with idiopathic pulmonary arterial hypertension. Int. J. Cardiol. 140(3), 272–278 (2010).
- Almeida M, Canada M, Neves J et al. Longstanding traumatic tricuspid regurgitation with severe right ventricular failure. J. Heart Valve Dis. 6(6), 642–646 (1997).
- Sheehan FH, Ge S, Vick GW 3rd et al. Three-dimensional shape analysis of right ventricular remodeling in repaired tetralogy of Fallot. Am. J. Cardiol. 101(1), 107–113 (2008).
- Schattke S, Wagner M, Hattasch R et al. Single beat 3D echocardiography for the assessment of right ventricular dimension and function after endurance exercise: intraindividual comparison with magnetic resonance imaging. Cardiovasc. Ultrasound 10, 6 (2012).
- Crean AM, Maredia N, Ballard G et al. 3D echo systematically underestimates right ventricular volumes compared with cardiovascular magnetic resonance in adult congenital heart disease patients with moderate or severe RV dilatation. J. Cardiovasc. Magn. Reson. 13, 78 (2011).
- Kaul S, Tei C, Hopkins JM, Shah PM. Assessment of right ventricular function using two-dimensional echocardiography. Am. Heart J. 107(3), 526–531 (1984).
- Innelli P, Esposito R, Olibet M, Nistri S, Galderisi M. The impact of ageing on right ventricular longitudinal function in healthy subjects: a pulsed tissue Doppler study. Eur. J. Echocardiogr. 10(4), 491–498 (2009).
- Kjaergaard J, Petersen CL, Kjaer A, Schaadt BK, Oh JK, Hassager C. Evaluation of right ventricular volume and function by 2D and 3D echocardiography compared with MRI. Eur. J. Echocardiogr. 7(6), 430–438 (2006).
- Lindqvist P, Henein MY, Wikstrom G. Right ventricular myocardial velocities and timing estimate pulmonary artery systolic pressure. Int. J. Cardiol. 137(2), 130–136 (2009).
- Hsiao SH, Lin SK, Wang WC, Yang SH, Gin PL, Liu CP. Severe tricuspid regurgitation shows significant impact in the relationship among peak systolic tricuspid annular velocity, tricuspid annular plane systolic excursion, and right ventricular ejection fraction. J. Am. Soc. Echocardiogr. 19(7), 902–910 (2006).
- Leary PJ, Kurtz CE, Hough CL, Waiss MP, Ralph DD, Sheehan FH. Three-dimensional analysis of right ventricular shape and function in pulmonary hypertension. Pulm. Circ. 2(1), 34–40 (2012).
- van der Zwaan HB, Geleijnse ML, McGhie JS et al. Right ventricular quantification in clinical practice: two-dimensional vs. threedimensional echocardiography compared with cardiac magnetic resonance imaging. Eur. J. Echocardiogr. 12(9), 656–664 (2011).
- Alam M, Wardell J, Andersson E, Samad BA, Nordlander R. Characteristics of mitral and tricuspid annular velocities determined by pulsed wave Doppler tissue imaging in healthy subjects. J. Am. Soc. Echocardiogr. 12(8), 618–628 (1999).
- Alam M, Wardell J, Andersson E, Samad BA, Nordlander R. Characteristics of mitral and tricuspid annular velocities determined by pulsed wave Doppler tissue imaging in healthy subjects. J. Am. Soc. Echocardiogr. 12(8), 618–628 (1999).
- Ionescu AA, Payne N, Obieta-Fresnedo I, Fraser AG, Shale DJ. Subclinical right ventricular dysfunction in cystic fibrosis. A study using tissue Doppler echocardiography. Am. J. Respir. Crit. Care Med. 163(5), 1212–1218 (2001).
- Lindqvist P, Calcutteea A, Henein M. Echocardiography in the assessment of right heart function. Eur. J. Echocardiogr. 9(2), 225–234 (2008).
- Lindqvist P, Waldenstrom A, Henein M, Morner S, Kazzam E. Regional and global right ventricular function in healthy individuals aged 20–90 years: a pulsed Doppler tissue imaging study: Umea General Population Heart Study. Echocardiography 22(4), 305–314 (2005).
- Zimbarra Cabrita I, Ruisanchez C, Grapsa J et al. Validation of the isovolumetric relaxation time for the estimation of pulmonary systolic arterial blood pressure in chronic pulmonary hypertension. Eur. Heart J. Cardiovasc. Imaging doi:10.1093/ehjci/ jes093 (2012) (Epub ahead of print).
- Rajagopalan N, Simon MA, Shah H, Mathier MA, Lopez-Candales A. Utility of right ventricular tissue Doppler imaging: correlation with right heart catheterization. Echocardiography 25(7), 706–711 (2008).
- Lopez-Candales A, Dohi K, Rajagopalan N et al. Right ventricular dyssynchrony in patients with pulmonary hypertension is associated with disease severity and functional class. Cardiovasc. Ultrasound 3, 23 (2005).
- Fukuda Y, Tanaka H, Sugiyama D et al. Utility of right ventricular free wall speckletracking strain for evaluation of right ventricular performance in patients with pulmonary hypertension. J. Am. Soc. Echocardiogr. 24(10), 1101–1108 (2011).
- Shih WJ, Kousa K, Mitchell B, Huang WS. Permanently increased brightness of right ventricle (D-shaped left ventricle) on myocardial perfusion imaging in a patient with chronic cor pulmonale: an autopsy correlation. J. Nucl. Cardiol. 13(2), 294–296 (2006).
- Kasner M, Westermann D, Steendijk P et al. LV dysfunction induced by a non-severe idiopathic pulmonary arterial hypertension: a pressure-volume relationship study. Am. J. Respir. Crit. Care Med. 186(2), 181–189 (2012).
- Steen V, Chou M, Shanmugam V, Mathias M, Kuru T, Morrissey R. Exercise-induced pulmonary arterial hypertension in patients with systemic sclerosis. Chest 134(1), 146–151 (2008).
- Argiento P, Vanderpool RR, Mule M et al. Exercise stress echocardiography of the pulmonary circulation: limits of normal and gender differences. Chest doi:10.1378/ chest.12-0071 (2012) (Epub ahead of print).
- Naeije R. In defence of exercise stress tests for the diagnosis of pulmonary hypertension. Heart 97(2), 94–95 (2011).
- Dalsgaard M, Kjaergaard J, Pecini R et al. Left ventricular filling pressure estimation at rest and during exercise in patients with severe aortic valve stenosis: comparison of echocardiographic and invasive measurements. J. Am. Soc. Echocardiogr. 22(4), 343–349 (2009).
- Dehghani P, Collins N, Horlick E, Benson L. Chronic pulmonary thromboembolism in a patient with a fontan circulation: percutaneous management. Catheter Cardiovasc. Interv. 70(6), 893–896 (2007).
- Savale L, Magnier R, Le Pavec J et al. Efficacy, safety, and pharmacokinetics of bosentan in portopulmonary hypertension. Eur. Respir J. doi:10.1183/09031936.00117511 (2012) (Epub ahead of print).
- Jiang BH, Tardif JC, Shi Y, Dupuis J. Bosentan does not improve pulmonary hypertension and lung remodeling in heart failure. Eur. Respir. J. 37(3), 578–586 (2011).
- Henein MY, O’Sullivan CA, Coats AJ, Gibson DG. Angiotensin-converting enzyme (ACE) inhibitors revert abnormal right ventricular filling in patients with restrictive left ventricular disease. J. Am. Coll. Cardiol. 32(5), 1187–1193 (1998).
- Ghio S, Pazzano AS, Klersy C et al. Clinical and prognostic relevance of echocardiographic evaluation of right ventricular geometry in patients with idiopathic pulmonary arterial hypertension. Am. J. Cardiol. 107(4), 628–632 (2011).
- Bustamante-Labarta M, Perrone S, De La Fuente RL et al. Right atrial size and tricuspid regurgitation severity predict mortality or transplantation in primary pulmonary hypertension. J. Am. Soc. Echocardiogr. 15(10 Pt 2), 1160–1164 (2002).
- Haeck ML, Scherptong RW, Marsan NA et al. Prognostic value of right ventricular longitudinal peak systolic strain in patients with pulmonary hypertension. Circ. Cardiovasc. Imaging 5(5), 628–636 (2012).


