Research Article - Diabetes Management (2022) Volume 12, Issue 4
Retinal microvasculature as biomarker for diabetes and cardiovascular diseases
- Corresponding Author:
- Jocelyn Desbiens
Department Food Safety and Health Research, Southern Medical University, Guangzhou, China
E-mail: yangalice79@smu.edu.cn
Received: 01-Jul-2022, Manuscript No. FMDM-22-68684; Editor assigned: 04-Jul-2022, PreQC No. FMDM-22-68684 (PQ); Reviewed: 20-Jul-2022, QC No. FMDM-22-68684; Revised: 22-Jul-2022, Manuscript No. FMDM-22-68684 (R); Published: 29-Jul-2022, DOI: 10.37532/1758-1907.2022.12(4).387-394
Abstract
Purpose: To demonstrate that retinal microvasculature per se is a reliable biomarker for Diabetic Retinopathy (DR) and, by extension, cardiovascular diseases.
Methods: Deep Learning Convolutional Neural Networks (CNN) applied to color fundus images for semantic segmentation of the blood vessels and severity classification on both vascular and full images. Vessel reconstruction through harmonic descriptors is also used as a smoothing and de-noising tool. The mathematical background of the theory is also outlined.
Results: For diabetic patients, at least 93.8% of DR No-Refer vs. Refer classification can be related to vasculature defects. As for the Non-Sight Threatening vs. Sight eatening case, the ratio is as high as 96.7%.
Conclusion: In the case of DR, most of the disease biomarkers are related topologically to the vasculature.
Translational relevance: Experiments conducted on eye blood vasculature reconstruction as a biomarker shows a strong correlation between vasculature shape and later stages of DR.
Keywords
healthcare; diabetic retinopathy; cardiovascular; artificial intelligence; deep learning; semantic segmentation; fourier theory
Introduction
Diseases that primarily affect blood vessels, including diabetes and cardiovascular disease, are four of the top seven causes of death in the United States and have an increasing prevalence worldwide [1]. An enhanced ability to diagnose these diseases and their stage and determine an individual’s propensity to develop or have progressive complications from these diseases would be of enormous benefit. Recent technological advances have allowed the development of clinical data acquisition and analysis to begin to fulfill this goal. Retinal vasculature provides a unique ability to examine blood vessels and can now be imaged non- invasively with efficient and effective devices in large populations. The benefits of telemedicine using these images to diagnose and determine the severity of diabetic retinopathy have been demonstrated to be as accurate as live examinations, if not more [2,3]. The ability to incorporate this capability into a health system to improve patient outcomes has been shown in the English NHS Diabetic Eye Screening Program that has reported an 82.8% rate of diabetic retinopathy evaluation, over time resulting in diabetic retinopathy no longer being the leading cause of blindness and visual disability among working class adults in the UK [4].
Artificial Intelligence and Deep Learning provide new technology to facilitate the ability to improve the sensitivity and specificity of the analysis of retinal images. We can use a deep convolutional neural network based model to detect referable DR [5]. It has been shown that Deep Learning assistance can improve the accuracy of reader grading of retinal images for DR severity [6]. Additionally, to further improve access, quality, and cost effectiveness, artificial intelligence has been FDA cleared for autonomous diagnosis of more than mild diabetic retinopathy and diabetic macular edema using a single camera in patients without diabetic retinopathy. The pivotal FDA trial demonstrated a sensitivity of 87.2% and specificity of 90.7% [7].
Fundus photography, with the assessment of retinal vascular measurements, is useful in the evaluation of other vital diseases in addition to diabetes, including cardiovascular, cerebrovascular, and Alzheimer’s diseases. Retinal vascular caliber has been shown to correlate with diabetes complications: retinopathy, nephropathy, neuropathy, and cardiovascular risk [8,9]. The impact of including retinal parameters and biomarkers with traditional cardiovascular risk measures in a diabetic population showed a statistically significant improvement based on net re-classification improvement [8]. This improved ability to assess cardiovascular risk has been demonstrated in an older population in [10]. Given the similar embryological origins and structural characteristics of retinal and cerebrovascular vessels, it is not surprising to find associations between retinal signs and brain microvascular disease [11]. There is also evidence of an increased abnormality of several retinal vascular parameters in patients with Alzheimer’s disease compared to matched controls [12].
In medical images, identifying candidate regions is of the highest importance since it provides intuitive illustrations for doctors and patients of how the diagnosis is inferred. Recently, advances in Deep Learning have dramatically improved the performance of disease detection. Most of these Deep Learning systems treat CNN as a kind of black box, lacking comprehensive explanation. Traditional ways of visual “feature finding” are given through heat map generation or sliding windows. In this report, we show that for retinal diseases, most of the visual features allowing AI recognition like vessel curvature, angles, etc. are topologically concentrated along the retinal vasculature.
Furthermore, mechanistic studies have established a causal role for lipids (principally low-density lipoproteins cholesterol, LDL-C) and hypercholesterolemia in the atherogenesis of atherosclerotic cardiovascular disease (ASCVD) [13]. Also, dyslipidemia (aberrant regulation of lipid metabolism) and hyperlipidemia (high level of blood plasma lipids) have been described as a prerequisite risk factor for the development and progression of clinically detectable atherosclerosis [14]. Moreover, Hayashi and colleagues summarized from laboratory experimental research findings that high glucose concentrations suppress the levels of caveolin-1 expression, reducing the number of caveolae (vesicular invaginations of the plasma membrane that mediate the intracellular transport of lipids such as cholesterol), thereby increasing the risk for the development and progression of atherosclerosis [15]. In sum, the significance and novelty of the current study, lies in the fact that, for the first time, an attempt is made towards providing laboratory experimental evidence, connecting a combination of dysregulations in lipid and glucose metabolisms due to subchronic exposure to drinking water Cd as casual molecular events in the development of atherosclerosis.
• Prior Work
Biomarkers are traditionally associated with lesions on the retina caused by the disease, such as Microaneurisms, Hemorrhages, Exudates, Macular Edema, and neovascularization [16]. Moreover, they are also related to typical risk factors for DR (HbA1c, blood pressure, total cholesterol, etc.). The absence or presence, type, and severity of retinal vessel lesions diagnosed by retinal photography are biomarkers of DR status and are commonly used in screening clinics and research [17]. Many methods from Image Processing and Deep Learning domains have been designed and implemented to automatically or semi-automatically detect the markers. Retinal markers like the retinal arteriolar and venular caliber and their arterio-venous ratio (AVR) are of great importance. It has been found useful for early diagnosis of diseases such as hypertension, diabetes, stroke, other cardiovascular diseases in adults, and retinopathy of premature [18]. One calculates it as the ratio of average arteriolar diameter and average venous diameter of the vessels within one and two disk diameter circular rings from the optic disk center [19]. So only a small but essential part of the vasculature is used.
Retinal vessel geometry comprises another group of retinal vessel-based biomarkers. It includes measures of vessel branching angles, branching complexity, tortuosity, length-to-diameter ratio, and fractals [20]. They have been used, among other things, to identify patterns summarizing the retinal vascular network inthe elderly and to relate them to cardiovascular history (see TABLE 1 for a full list of geometric biomarkers).
|
Normal | Mild | Moderate | Severe | Proliferative |
|---|---|---|---|---|---|
| Normal | 1436 | 55 | 6 | 0 | 0 |
| Mild | 14 | 448 | 260 | 2 | 0 |
| Moderate | 8 | 12 | 1652 | 252 | 56 |
| Severe | 0 | 2 | 19 | 1286 | 179 |
| Proliferative | 4 | 1 | 7 | 30 | 1259 |
TABLE 1: Confusion matrix of clinician interpretation (clinician-1 row-wise and clinician-2 column-wise) in terms of DR severity at eye level.
The extraction of retinal microvasculature with the help of Deep Learning, which dates back to 2015 [21], has shown outstanding results and outperformed drastically the methods based on traditional image processing [22]. This allows the segmentation of vessels to the extent of being able to characterize the whole vasculature as a biomarker encompassing, therefore, other biomarkers such as tortuosity, curvature, angles, etc.
• Dataset
The dataset consisted of color digital fundus photography obtained in a non-Eye-Care Professional’s environment operated by staff with minimal training. The IRIS oftware solution is designed to be camera agnostic. For this study, a total of 6,988 graded 45° × 40° CenterVue DRS camera (CenterVue SpA, Freemont, CA) were utilized. All images are monoscopic, and single images centered on the fovea. These 6,988 graded images represent a random sample from over 430,000 orders within the IRIS database.
The categorization of the images was performed using the Diabetic Retinopathy Severity Scale (DRSS) based on the International Classification of Diabetic Retinopathy (ICDR) criteria. Ground truth for each image was determined by the agreement of two experienced grading board-certified ophthalmologists. If there was disagreement mong the two, a third ophthalmologist acted as an adjudicator. All images were evaluated in the standard color image as well as an IRIS proprietary image enhancement. We see from the confusion matrix presented in TABLE 1 that the main disagreements lay along the Mild/Moderate boundary.
Agreements between the clinicians were assessed
by Cohen’s k coefficient, whose equation is  where p is the observed probability
of agreement, and q is the probability of chance
agreement. The golden rule being the more
significant the k, the better is the agreement. The
k value of the confusion matrix is 0.838, which
shows a pretty good agreement.
where p is the observed probability
of agreement, and q is the probability of chance
agreement. The golden rule being the more
significant the k, the better is the agreement. The
k value of the confusion matrix is 0.838, which
shows a pretty good agreement.
Methodology
Due to the time-consuming and repetitious aspects of manual blood vessel segmentation, automatic segmentation of retinal vessels is necessary for making a computer diagnostic system for ophthalmic disorders. Automatic segmentation of the blood vessels in retinal images is important in detecting several eye diseases because, in some cases, they affect the vessel network itself.
• Image processing segmentation
Several topological features of retinal vessels (e.g. diameter, length, branching angle, tortuosity, curvature) have diagnostic value [23]. They can be used in the follow-up of disease progression, treatment, and evaluation of various cardiovascular and eye-related diseases (e.g. diabetes, hypertension, arteriosclerosis, and neovascularization) [24]. The basic image segmentation is obtained by applying the following filters to the source image:
• Gray-scale conversion of the color fundus image.
• Standardization
• Contrast-limited adaptive histogram equalization (CLAHE)
• Gamma adjustment
However, due to the high variance in image quality and camera type, image processing segmentation software tends to deliver well to poor accurate vascular segmentation. In FIGURE 1, the middle row displays blood vessel networks segmented through image processing. As one can see, some images have almost no segmented vasculature. For around one-third of the dataset, images have partial or no segmentation due to image quality, intensity variation, lens artifacts, etc. This is the reason why we need a more accurate segmentation tool.

FIGURE 1: Image processing (second row) and semantic segmentation (third row) of the same color fundus images (first row).
• Semantic segmentation
In recent years, Deep Learning has achieved great success in visual perception, and the semantic segmentation of images is one of the most successful cases. The overall architecture of the model we used is shown in FIGURE 2. Our model adopts a full convolutional neural network, which is commonly used in most semantic segmentation tasks. It can be briefly divided into two parts-encoder and decoder. The encoder is a convolutional neural network that extracts features from the input image, such as the retinal vasculature image. The decoder wills up-sample the extracted features to the resulting image that we desired, such as the vessel segmentation in our case (FIGURES 3a and 3b).

FIGURE 2: Deep learning model architecture used for semantic segmentation. Note:  Conv 3×3,
  ReLU,
ReLU,  copy and crop,
  max pool,
 up-couv 2×2,
  couv 1×1

FIGURE 3: Harmonic descriptors and vessel reconstruction. (a) Reconstructed vessel from harmonic description. Bottom window contains the reconstructed vessel and its derivative. Local curvature is
shown in third window from top. (b) Harmonic reconstruction of the vasculature of a fundus image. RGB colors are respectively assigned the scale invariant values of | (a0, b0) |, | (a2, b2) |, and | (a1, b1) |.
Implementation relies heavily upon FFTW.
NOTE:  Harmonic Coeffcients;
  Amplitude Spectrum;
  Local Curvature;
  Hormonic Curve;
  Hormonic Derivative; Optima
The neural network architecture is derived from the U-Net architecture [25]. The major advantage of this architecture is its ability to consider a wider context when predicting a pixel.
This is facilitated by using the large number of channels used in the up-sampling operation.
We apply cross-entropy for the loss function, and the stochastic gradient descent (SGD) is employed for back-propagation optimization. After each convolutional layer, the activation function is the Rectifier Linear Unit (ReLU). A dropout rate of 0.2 is used between two consecutive convolutional layers. Among the dataset, 150 images with correct image processed segmentation were chosen for training purposes. The training was performed over 50 epochs, with a mini-batch size of 16 patches. Performance obtained was measured by a 97.9% AUC on the 150 training images.
The experiments were run on a high-end GPU, the Tesla V100-PCIE, containing 2496 CUDA cores. After training, all 6,988 images in the dataset were processed to generate the vasculature images (see bottom row of FIGURE 1). Segmentation time took 1 hour and 49 minutes.
Vessel reconstruction and harmonic descriptors: The microvasculature segmentation one obtains from Deep Learning has better coverage than image processing can yield, but it is far from being perfect. Noise reduction has to be provided; blobs and falsepositive pixels have to be removed from the processed images. Furthermore, some vessel smoothing has to be applied to the generated segments. We based our smoothing method on Fourier Descriptors [26]. We give a mathematical description of the theory in Appendix A.
Image processing steps: (1) Binarize vasculature image obtained by semantic segmentation. (2) Extract skeleton from binary image by thinning. (3) Build an abstract graph from the skeleton. (4) Remove noise from graph and apply vessel tracking over the entire vasculature. (5) Reconstruct each extended vessel in the graph by harmonic descriptors smoothing.
Harmonic descriptor smoothing: Harmonic descriptors have multiple advantages. For instance, knowing the harmonic descriptors of a given vessel, it is straightforward to compute its first and second derivatives, yielding the local curvature. A by-product, i.e. averaging the curvature over the entire vasculature, gives an estimation of the tortuosity of the vessel network. Likewise, the angle made by two incident vessels can be readily computed.
• Experiments
As retinal blood vessels are the only deep vessels that can be observed in the human body, they could directly reflect the state of some cardiovascular diseases. They could also reflect the severity of DR [27]. We ran four experiments to test this assumption.
Severity classification of vasculature images: To obtain a baseline measure, we run experiments against the corresponding reconstructed vasculature images without the out-of vessels lesions (Scenario I). A technique called finetuning is used to make a pre-trained model adapt to a new dataset. We first train a model on a large dataset with millions of images. Then on the second step, we adjust the weights using the domain-specific dataset.
Fine-tuning often benefits medical domains with relatively small datasets. At the same time, fine-tuning carries the accuracy advantage of deep learning. In our case, we used the pretrained ResNet101 model [28]. The training was performed over 50 epochs, with a minibatch size of 8 images. Learning rate per minibatch was=[0.01] × 5+[0.001] × 5+[0.0001] × 5+[0.00001] with a × 2 regularization weight of 0.0005. On a Tesla V100-PCIE, training time amounted to 56 minutes.
Scenario I-A. First dataset was Normal+Mild vs. Moderate+Severe+Proliferative (No-Refer vs. Refer) containing segmented retinal vasculature images only. Training dataset consists of 5,988 vasculature images, validation dataset of 1,000 vasculature images. Classification results are to be found in TABLE 2.
| Classification results | Scenario | Accuracy | sensitivity | specificity | PPV | NPV |
|---|---|---|---|---|---|---|
| I-A | Observable vs. Referable | 93.80% | 96.00% | 91.60% | 92.00% | 95.80% |
| I-B | Non-sight threating vs. Sight threating | 96.70% | 97.20% | 96.20% | 96.20% | 97.20% |
| II-A | Observable vs. Referable | 98.10% | 98.80% | 97.40% | 97.40% | 98.80% |
| II-B | Non-sight threating vs. Sight threating | 98.80% | 99.00% | 98.60% | 98.60% | 99.00% |
TABLE 2: Classification results of (I-A), (I-B), (II-A), (II-B).
• Scenario I-B. Second dataset was Normal+Mild vs. Severe+Proliferative (Non- Sight Threatening vs. Sight Threatening) containing segmented retinal vasculature images only. Training dataset consists of 4,008 vasculature images, validation dataset of 1,000 vasculature images. Classification results are to be found in TABLE 2.
Severity classification of full retinal images: To check if lesions can discriminate more than vasculature alone, we re-run same experiments on the full images containing all potential lesions (Scenario II). We used the same training/validation datasets as in the above experiments.
Scenario II-A. Third dataset was Normal+Mild vs. Moderate+Severe+Proliferative (No-Refer vs. Refer) containing full retinal images only. Training dataset consists of 4,008 full images, validation dataset of 1,000 full images. Classification results are to be found in TABLE 3.
|
A | B |
|---|---|---|
| Vascular images | 93.80% | 96.70% |
| Full images (Baseline) | 98.10% | 98.80% |
| Mean vasculature tortuosity | Observable-2.86 | Non-Sight Threatening-2.86 |
| Referable-3.14 | Sight Threatening-3.26 |
TABLE 3: Summary of accuracy measures and mean tortuosity for both scenarios.
• Scenario II-B. Fourth dataset was Normal+Mild vs. Severe+Proliferative (Non- Sight Threatening vs. Sight Threatening) containing full retinal images only. Training dataset consists of 5,988 full images, validation dataset of 1,000 full images. Classification results are to be found in TABLE 2.
Results and Discussion
For scenario A, we can say that 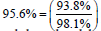 of
the success rate can be explained by the blood
vessel defects present in the microvasculature. In case of cenario B,
of
the success rate can be explained by the blood
vessel defects present in the microvasculature. In case of cenario B,  of the success rate
can be attributed to the vasculature itself.
of the success rate
can be attributed to the vasculature itself.
As everyone knows the low-level layers of a convolutional neural network match simple salient features such as lines (vertical, horizontal, and diagonal), corners, and contours [29]. Other intermediate level layers might, for instance, match curved lines and circles. Actually, in CNNs, each layer of nodes is trained on a distinct set of features based on the previous layer’s outcome. The deeper down into the neural network, the simpler the features the nodes can recognize, obviously because they aggregate and recombine features from the previous layer. As a matter of fact, related retinal vessel diseases tend to modify the morphological and topological structure of the vasculature by creating new vessels (neovascularization), increasing vessel curvature, widening branching angles, etc.
We make the hypothesis that the deep learning recognized geometric features are essential to help CNNs provide such good accuracy results. As shown by Cheung et al. [30], the retinal vascular tortuosity from retinal images may provide further information regarding effects of cardiovascular risk factors [31,32]. From our experiments, the success rate for cardiovascular risk detection can be attributed to the success rate of vasculature itself due to the fact that tortuosity as overlay on the vasculature image brings a differential layer of information, with its delta being larger in B than in A (TABLE 3).
Conclusion
There is a strong interest in the early detection of individuals with diabetes and hypertension. It is known that individuals with impaired glucose metabolism or diabetes have higher mortality from cardiovascular disease. In a similar fashion, individuals with high to standard blood pressure or pre-hypertension are more likely to develop cardiovascular events. The new tortuosity definition we explain in this paper can provide a high level of abstraction similar to what CNNs are offering and as such can help us better identify cardiovascular risks in patients.
References
- National Vital Statistics Reports. Technical Report. (2017).
- Laurence S Lim, Miao Li Chee, Carol Y Cheung, et al. Retinal Vessel Geometry and the Incidence and Progression of Diabetic Retinopathy. Invest Ophthalmol Vis Sci. 58(6): 200–205 (2017).
- Danny Y Lin, Mark S Blumenkranz, Rosemary J Brothers, et al. The Sensitivity and Specificity of Single-field Nonmydriatic Monochromatic Digital Fundus Photography with Remote Image Interpretation for Diabetic Retinopathy Screening: A Comparison with Ophthalmoscopy and tandardized Mydriatic Color Photography. Am J Ophthalmol. 134(2): 204–213 (2002).
- Rory Sayres, Ankur Taly, Ehsan Rahimy, et al. Using a Deep Learning algorithm and integrated gradients explanation to assist grading for Diabetic Retinophathy. Ophthalmol. 126(4): 552–564 (2019).
- Steven L Mansberger, Christina Sheppler, Gordon Barker, et al. Long-term Comparative Effectiveness of Telemedicine in Providing Diabetic Retinopathy Screening Examinations a Randomized Clinical Trial. JAMA Ophthalmol. 133(5): 518–525 (2015).
- Carol Yim-Lui Cheung, Ecosse Lamoureux, M Kamran Ikram, et al. Retinal Vascular Geometry in Asian Persons with Diabetes and Retinopathy. J Diabetes Sci Technol. 6(3): 595-605 (2012).
- Michael D Abràmoff, Philip T Lavin, Michele Birch, et al. 2018. Pivotal trial of an autonomous AI-based diagnostic system for detection of Diabetic Retinopathy in primary care offices. Digit Med. 1(2): 1–39 (2018).
- Henrietta Ho, Carol Y Cheung, Charumathi Sabanayagam, et al. Retinopathy signs improved prediction and reclassification of cardiovascular disease risk in diabetes: A prospective cohort study. Sci Rep. 7(2): 1-8 (2017).
- M Kamran Ikram, Carol Y Cheung, Mara Lorenzi, et al. Retinal vascular caliber as a biomarker for diabetes microvascular complications. Diabetes Care. 36(3): 750–759 (2017).
- Tien Yin Wong, Aruna Kamineni, Ronald Klein, et al. Quantitative Retinal Venular Caliber and Risk of Cardiovascular Disease in Older Persons. Arch Int Med. 166(21): 2388–2394 (2017).
- TC Hanff, AR Sharrett, TH Mosley, et al. Retinal Microvascular Abnormalities Predict Progression of Brain Microvascular Disease: An ARIC MRI Study. Stroke. 45(4): 1012–1017 (2014).
- Carol Yim-lui Cheung, Yi Ting Ong, M KamranIkram, et al. Microvascular network alterations in the retina of patients with Alzheimer’s disease. Alzheimers Dement. 10 (2): 135–142 (2014).
- Henrietta Ho, Carol Y Cheung, Charumathi Sabanayagam, et al. Retinopathy signs improved prediction and reclassification of cardiovascular disease risk in diabetes: A prospective cohort study. Sci Rep. 7(2): 1-8 (2017).
- Judith Hsia, Karen L Margolis, Charles B Eaton, et al. Prehypertension and cardiovascular disease risk in the Women’s Health Initiative. Circulation. 115(7): 855–860 (2007).
- M Kamran Ikram, Frank Jan de Jong, Johannes R Vingerling, et al. Are retinal arteriolar or venular diameters associated with markers for cardiovascular disorders? The Rotterdam Study. Invest Ophthalmol Vis Sci. 45(7): 2129–2134 (2004).
- Alicia J Jenkins, Mugdha V Joglekar, Anandwardhan A Hardikar, et al. Biomarkers in Diabetic Retinopathy. Rev Diabet Stud. 12(2): 159–195 (2015).
[Crossref]
- Rebecca L Thomas, Frank D Dunstan, Stephen D Luzio, et al. Prevalence of Diabetic Retinopathy within a national Diabetic Retinopathy screening service. Br J Ophthalmology. 99(1): 64–68 (2015).
- Michael D Knudtson, Kristine E Lee, Larry D Hubbard, et al. Revised formulas for summarizing retinal vessel diameters. Curr Eye Res. 27(3): 143–149 (2003).
- Laurence S Lim, Miao Li Chee, Carol Y Cheung, et al. Retinal Vessel Geometry and the Incidence and Progression of Diabetic Retinopathy. Invest Ophthalmol Vis Sci. 58(6): 200–205 (2017).
- Toufique Ahmed Soomro, Ahmed J Afifi, Lihong Zheng, et al. Deep Learning Models for Retinal Blood Vessels Segmentation: A Review. IEEE Access. 7(2): 71696–71717 (2019).
- Jasem Almotiri ,Khaled Elleithy, Abdelrahman Elleithy. Retinal Vessels Segmentation Techniques and Algorithms: A Survey. Appl Sci. 8(2): 155 (2018).
- Rolando Estrada, Michael J Allingham, Priyatham S Mettu, et al. 2015. Retinal artery-vein classification via topology estimation. IEEE Trans Med Imaging. 34(12): 2518–2534 (2015).
- TJ MacGillivray, Emanuele Trucco, JR Cameron, et al. Retinal imaging as a source of biomarkers for diagnosis, characterization and prognosis of chronic illness or long-term conditions. Brit J Radiol. 87(8): 20130832 (2014).
- Olaf Ronneberger, Philipp Fischer, Thomas Brox. U-Net: Convolutional Networks for Biomedical Image Segmentation. (2015).
- Charles T Zahn, Ralph Z Roskies. Fourier descriptors for plane closed curves. IEEE Trans Comput. 100(3): 269–281 (March 1972).
[Crossref]
- MM Fraz, P Remagnino, A Hoppe, et al. Blood Vessel Segmentation Methodologies in Retinal Images: A Survey. Comput Methods Programs Biomed. 108(1): 407-433 (2012).
- MD Zeiler, R Fergus. Visualizing and Understanding Convolutional Networks. (2013).
- Kaiming He, Xiangyu Zhang, Shaoqing Ren, et al. Deep Residual Learning for Image Recognition. (2015).
- Carol Yim-lui Cheung, Yingfeng Zheng, Wynne Hsu, et al. Retinal vascular tortuosity, blood pressure, and cardiovascular risk factors. Ophthalmology. 118(5): 812–818 (2011).
- Eric J Brunner, Martin J Shipley, Daniel R Witte, et al. Relation between blood glucose and coronary mortality over 33 years in the Whitehall Study. Diabetes Care. 29(1): 26–31.
- Judith Hsia, Karen L Margolis, Charles B Eaton, et al. Prehypertension and cardiovascular disease risk in the Women’s Health Initiative. Circulation. 115(7): 855–860 (2007).
- Rolando Estrada, Michael J Allingham, Priyatham S Mettu, et al. 2015. Retinal artery-vein classification via topology estimation. IEEE Trans Med Imaging. 34(12): 2518–2534 (2015).