Research Article - Imaging in Medicine (2017) Volume 9, Issue 1
Real-time ultrasound imaging of complex skeletal defects and fractures Preliminary results
Parmar BJ1, Chaudhry A1, Weiner BK2, Sabonghy EP3, Tasciotti E2and Righetti R*1
1Texas A&M University, Department of Electrical and Computer Engineering, College Station, Texas, USA
2The Houston Methodist Research Institute, Department of NanoMedicine, Houston, Texas, USA
3The University of Texas Health Science Center at Houston, Department of Orthopaedic Surgery, Houston, Texas, USA
- *Corresponding Author:
- Righetti R
Texas A&M University
Department of Electrical and Computer Engineering
College Station, Texas, USA
E-mail: righetti@ece.tamu.edu
Abstract
We report preliminary results on the use of ultrasound imaging techniques for real-time assessment of intact bones and bones with different types of fractures in animal samples ex vivo. Methods: Twenty-three cases of intact tibias and sixteen cases of fractured tibias obtained from rabbit, chicken and sheep samples were 2D and 3D scanned using a Sonix RP diagnostic ultrasound system and the results were statistically analyzed. Results: We report representative 2D and 3D results obtained for intact and fractured tibias in selected ex vivo rabbit, chicken and sheep animal samples. In selected cases, X-rays and CT data are also reported for a visual comparison with the ultrasound images. These preliminary results suggest that 2D and 3D real-time ultrasound imaging techniques have the potential to provide non-invasive and fast visualization of cortical defects in different types of bones. Conclusion: This study indicates that ultrasound imaging techniques can be used for a prompt assessment of bone defects including fractures and controlled defects. Off-line, more advanced image processing and analysis techniques can be used to further refine and improve the quality of the 3D ultrasound images especially in the case of bones located in deep tissues.
Keywords
3D imaging, 3D ultrasound imaging, bone imaging, bone defect, bone fracture, real-time imaging, orthopedics, ultrasound, X-ray.
Introduction
X-rays and Computerized Tomography (CT) are currently the gold standards for two-dimensional (2D) and three-dimensional (3D) imaging of skeletal tissues. The strength of these modalities lies in their superior sensitivity and specificity in the detection of skeletal pathologies and the associated skeletal response to the underlying etiology. These imaging methods are used in a number of musculoskeletal applications, such as the characterization of fractures and the temporal monitoring of subsequent healing, diagnostic patterns of involvement and bony response, tumors, measurement of deformity and surgical planning for their correction [1-6]. The weaknesses of these modalities, however, rest in their reliance upon radiation for image generation, the requirement of large, often structurally fixed, machinery, and the high costs. In particular, radiation exposure for the radiographic diagnosis, treatment (operative or non-operative), and follow-up of fractures can approach levels of 10 mSv, which may increase cancer risk [7-12], especially in children. Radiation of axial structures (shoulder, pelvis, hip or spine), often coupled with CT, poses a significantly greater risk [10,11].
While ultrasound imaging techniques have historically been less sensitive and specific for the diagnosis of skeletal disorders, some of their distinctive characteristics have long made them an attractive alternative imaging modality to standard x-ray and CT methods for bone assessment [13-18]. Potential advantages of these techniques include safety (no radiation), real-time imaging, portability, cost-effectiveness, and musculoskeletal physician operability. While 3D ultrasound imaging methods are widely deployed for surface structural and functional imaging in several medical areas including obstetrics, gynecology and cardiology, their utility for musculoskeletal imaging applications remains largely unexplored. Re-exploration of these methods is warranted, in light of the emergence of novel ultrasound technologies and systems with superior 3D and 4D ultrasound imaging capabilities and automated features.
The majority of the work retrievable in the literature on ultrasound bone imaging refers to the use of quantitative low-frequency, 2D ultrasound methods to assess bone density or detect bone abnormalities [19-22]. However, there is still a paucity of work that focuses on the use of ultrasound bone imaging using clinically available ultrasound scanners despite data showing promising results in children and military applications [18,23-27]. Only a few studies have been reported to date that investigate the use of 3D ultrasound techniques for bone applications [28,29]. Real-time and portable ultrasound imaging methods can potentially be very informative [29]. They could serve as complementary methods to X-Rays and CT, particularly in intra-operative and emergency medicine scenarios. The availability of these methods could enable fast diagnosis of fractures and monitoring of bone healing in a radiation-free environment, hence significantly impacting the management of a wide range of bone abnormalities.
We have reported a study, which has demonstrated that ultrasound imaging techniques can be used to assess bone defects with accuracy and resolution comparable to that of optical and X-ray methods in ex vivo bone samples [30]. In this paper, we focus on the real-time assessment of tissue samples with intact and fractured bones. More specifically, we want to investigate if fast, minimally processed 3D ultrasound images can be used to detect appendicular skeletal defects and complex bone fractures in a variety of tissue samples. A statistical analysis of the imaging contrast obtained when using these 3D methods for bone imaging is reported. Given the limited availability of literature on 3D ultrasound bone imaging, the results of this study can serve as a foundation for new and more complex studies involving the use of ultrasound imaging techniques for orthopedic applications.
Materials and Methods
Ultrasound imaging experiments were performed on bone samples of tibiae obtained from both mammalian (rabbit and sheep) and non-mammalian (chicken) animal samples. Unless otherwise specified, the reported results refer to specimens with intact soft tissue. The chicken samples were obtained from local markets. The rabbit samples were obtained by Dr. Humphrey (grant NS-62242) and the TAMU CMP tissue sharing program. Finally, the sheep samples were obtained from the Texas A&M Institute for Preclinical Studies (TIPS). This study was approved by the Texas A&M University Institutional Animal Care and Use Committee (IACUC) (ARO #60598-MS-DRP, Award W911NF-11-1-0266).
While the majority of the samples used in the current study involved bones within intact soft tissue samples, we also carried out some tests on excised bones (i.e., without the soft tissue). This was done so as to aid comparison of the results obtained from samples containing intact soft tissue with “ideal” imaging results obtained from the same bones without the soft tissue interfering with the modality. These specimens were embedded within clear gelatin phantoms so as to generate good quality 3D scans. The phantoms were created by mixing 5% by weight of gelatin in boiling water, as described in Kallel et al. [31].
All samples were scanned using a Sonix RP diagnostic ultrasound system (Ultrasonix Medical Corp., Richmond, BC, Canada). This system uses a 38 mm real-time linear array transducer with 128 channels, 5-14 MHz bandwidth, 50% fractional bandwidth at -6 dB, sampling frequency of 40 MHz and 1 mm beam width at the focus. Acquisitions were performed using a transmission frequency of 10 MHz. No significant attenuation was observed in the visualization of the soft tissue-bone interface when using ultrasonic signals in this frequency band. The focal spot was set at the location of the soft tissue-bone interface.
For each sample, sets of 128 equidistant and parallel B-mode images (2D ultrasound images) were acquired from the sample in the freehand acquisition mode both in a direction parallel to the bone axis as well as in a direction perpendicular to the bone axis [32]. The time taken to perform a 3D scan was in the typical range of a sonographic test (5-15 min). Once the bone was located in the B-mode image (typically within a few minutes), performing the 3D scan typically required less than a few seconds. In some cases, more than one 3D scan was performed but no more than four 3D scans were executed from the same area of interest. From each set of parallel B-mode images, a 3D volume was reconstructed by combining the images into a regular voxel grid using the scan length information and by displaying a volume rendering of the data [33]. In the Sonix RP system used for this study, the volume visualization is implemented using a commercially available 3D graphics toolkit (Open Inventor by Mercury with the VolumeViz extension, VSG, USA), which offers features such as volume rendering and slicing immediately after data acquisition. Following the reconstruction process, real-time intensitylevel post-processing imaging techniques were applied to qualitatively enhance image quality of the resulting 3D reconstructions [30,34]. These post-processing techniques were applied only to the 3D reconstructions with the sole purpose of visually improving bone surface localization.
To have an idea of the “quality” of the realtime 3D bone reconstructions, a semi-automated approach was used. First, a user manually selected a ROI that definitively corresponded to the bone in each image; a threshold was computed as the mean intensities of the pixels in this region; a 2D median filtering was applied to the entire image; a thresholding operation was applied to eliminate pixels corresponding to lower intensities (soft tissue); the number of non-zero pixels in the thresholded image was counted and normalized with respect to the non-zero pixels in the original image. For the remaining portion of the study, we will refer to this number as the “ratio number”. Higher ratio numbers should correspond to qualitatively better bone segmentations.
| Species | Bone | Integrity | # Cases | # Images |
|---|---|---|---|---|
| Chicken | Tibia | Intact | 12 | 8 |
| Fractured | 10 | 8 | ||
| Rabbit | Tibia | Intact | 5 | 6 |
| Fractured | 1 | 0 | ||
| Sheep | Tibia | Intact | 6 | 14 |
| Fractured | 5 | 6 |
Table 1. Summary of the number of cases of intact and fractured tibias analyzed in various species (chicken, rabbit and sheep) using ultrasound imaging.
Results
TABLE 1 summarizes the number of samples, animal type, bone status (intact or fractured), number of experiments performed and number of cases used for statistical analysis in this study. All data reported in this table refer to samples with intact soft tissue. The number of samples/ animals largely depended on their availability at the time of the experiments (for example, chicken drumsticks were easily retrievable from local markets, while rabbit and sheep samples were provided by independent ongoing studies).
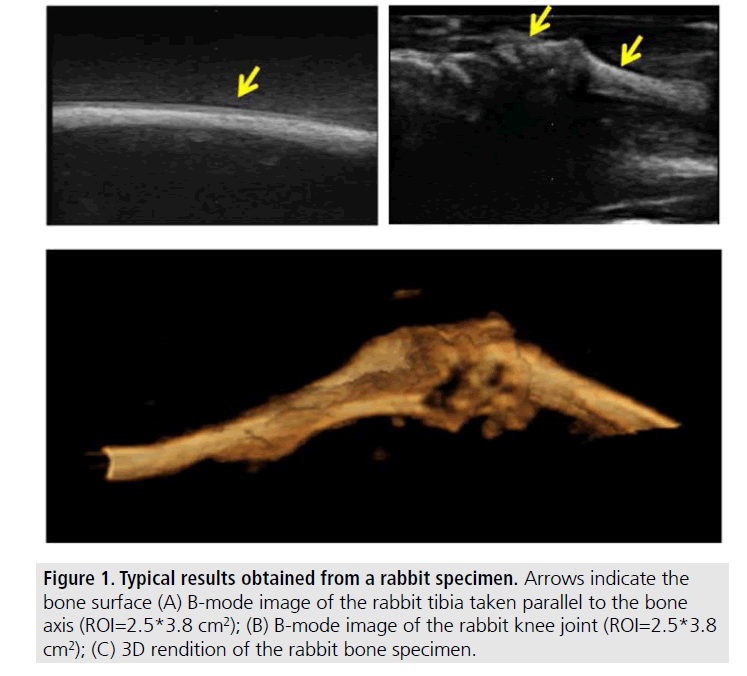
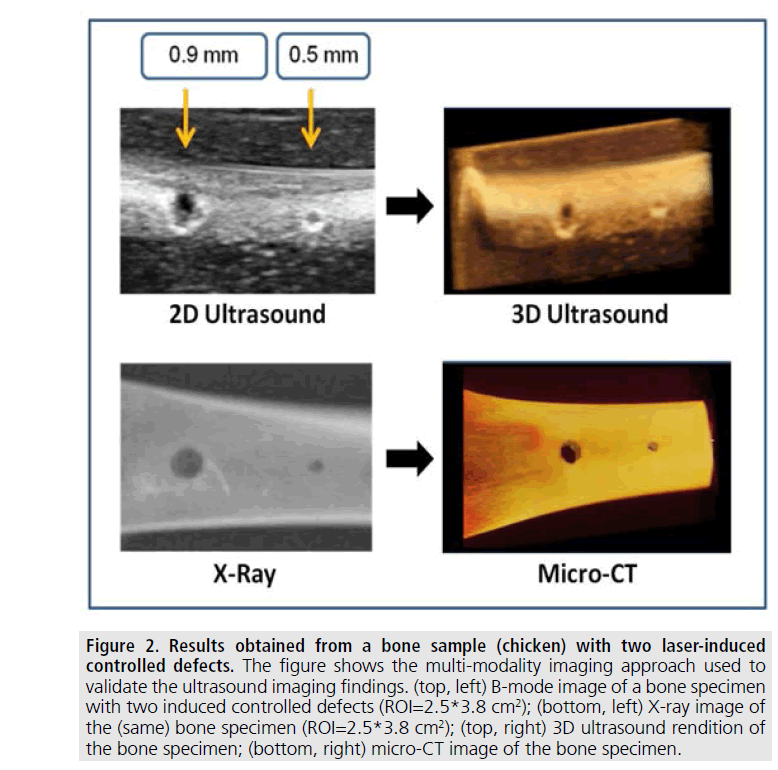
The first set of images shown in FIGURES 1 and 2 were obtained from excised bones and validated against X-rays and CT.
FIGURE 2 shows selected results that help qualitatively comparing the 2D and 3D ultrasound imaging results with conventional orthopedic imaging modalities. Specifically, these are results obtained from a chicken bone specimen with two sub-millimeter laser-induced controlled circular defects. Details of the process used to induce the defects are described in our earlier paper [30]. The figure shows the coregistered imaging results obtained from two independent 2D modalities - B-mode (top, left) and X-rays (bottom, left) applied to the specimen with the two defects. FIGURE 2 also shows two co-registered 3D renditions of the sample obtained using ultrasound (top, right) and micro-CT (bottom, right). As it can be seen from these results, at the diagnostic frequencies used for this study, real-time ultrasound imaging techniques allow depiction of sub-millimeter controlled bone defects with contrast-to-noise ratio and resolution adequate for deriving clinically relevant information. It is noteworthy that the time required for the generation of the 3D ultrasound rendition shown in FIGURE 2 was approximately a second, while the time required for the generation of the micro-CT image shown in FIGURE 2 was of the order of hours.
Figure 2.Results obtained from a bone sample (chicken) with two laser-induced controlled defects. The figure shows the multi-modality imaging approach used to validate the ultrasound imaging findings. (top, left) B-mode image of a bone specimen with two induced controlled defects (ROI=2.5*3.8 cm2); (bottom, left) X-ray image of the (same) bone specimen (ROI=2.5*3.8 cm2); (top, right) 3D ultrasound rendition of the bone specimen; (bottom, right) micro-CT image of the bone specimen.
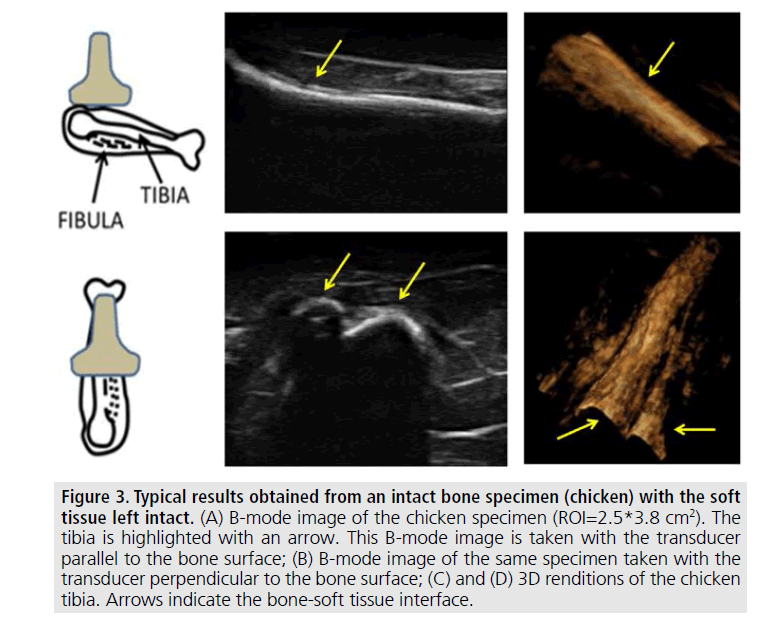
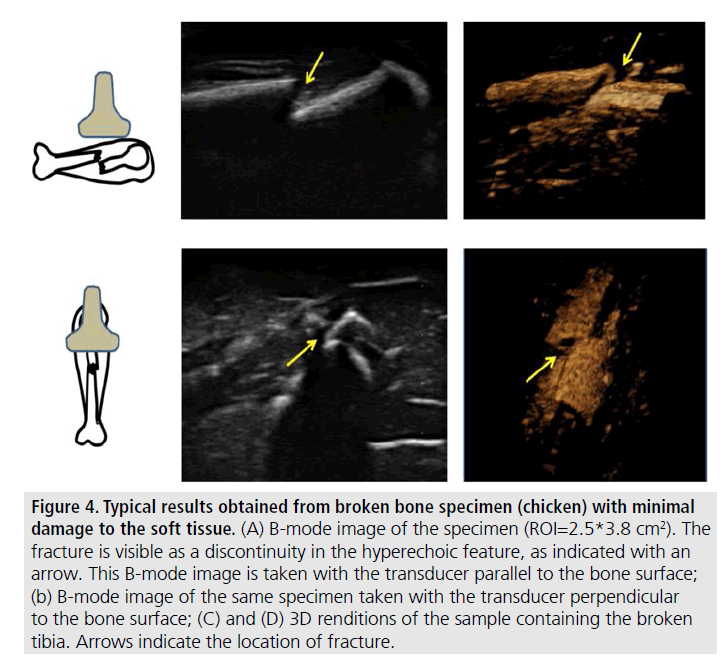
The remaining results pertain to images obtained from samples where the soft tissue was left intact (not in gelatin). FIGURES 3 and 4 show typical examples of 2D and 3D ultrasonic bone assessment in a chicken drumstick with intact tibia (FIGURE 3) and fractured tibia (FIGURE 4). FIGURE 3 (top row) shows 2D and 3D images of an intact tibia taken with the transducer parallel to the bone axis. FIGURE 3 (bottom row) shows 2D and 3D images of an intact tibia taken with the transducer perpendicular to the bone axis as also evident from the schematics on the left of the figure. In the B-mode images, the soft tissue bone-interface is visualized as a hyperechoic area with respect to the surrounding tissue. In all images, the tibia is clearly distinguishable from the surrounding tissue. However, in the 3D renditions, it is possible to clearly visualize both the tibia and the fibula. FIGURE 4, on the other hand, shows the results of 2D and 3D ultrasound imaging performed on a fractured tibia using a layout similar to that used in FIGURE 3. In the B-mode images, the fracture is visible as a step-like discontinuity in the bone surface outline (highlighted by the arrows). The location of the fracture (indicated by the yellow arrow) can be accurately visualized in all images. However, the 3D renditions may be used for a more complete assessment of the fracture as they appear to provide additional information related to the relative displacement and orientation between the two bone segments.
Figure 3.Typical results obtained from an intact bone specimen (chicken) with the soft tissue left intact. (A) B-mode image of the chicken specimen (ROI=2.5*3.8 cm2). The tibia is highlighted with an arrow. This B-mode image is taken with the transducer parallel to the bone surface; (B) B-mode image of the same specimen taken with the transducer perpendicular to the bone surface; (C) and (D) 3D renditions of the chicken tibia. Arrows indicate the bone-soft tissue interface.
Figure 4.Typical results obtained from broken bone specimen (chicken) with minimal damage to the soft tissue. (A) B-mode image of the specimen (ROI=2.5*3.8 cm2). The fracture is visible as a discontinuity in the hyperechoic feature, as indicated with an arrow. This B-mode image is taken with the transducer parallel to the bone surface; (b) B-mode image of the same specimen taken with the transducer perpendicular to the bone surface; (C) and (D) 3D renditions of the sample containing the broken tibia. Arrows indicate the location of fracture.
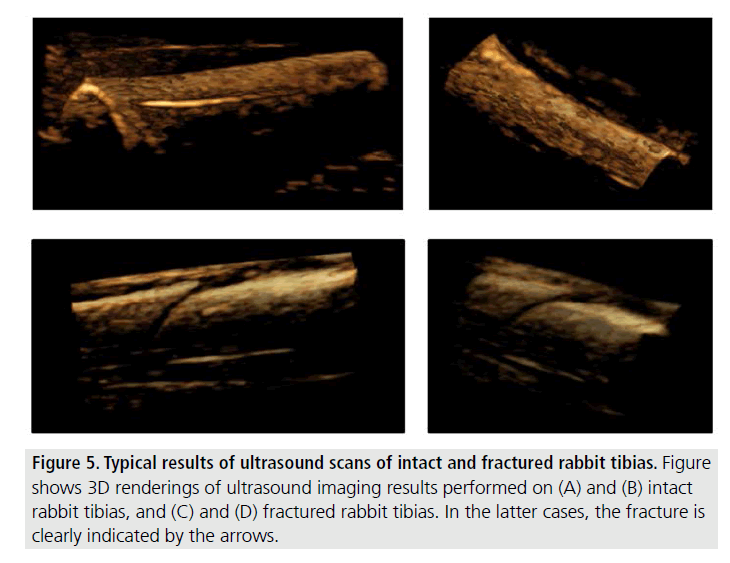
FIGURE 5 shows examples of 3D images obtained from mammalian (rabbit) specimens with an intact tibia (top row) and with a tibial fracture (bottom row).
Figure 5.Typical results of ultrasound scans of intact and fractured rabbit tibias. Figure shows 3D renderings of ultrasound imaging results performed on (A) and (B) intact rabbit tibias, and (C) and (D) fractured rabbit tibias. In the latter cases, the fracture is clearly indicated by the arrows.
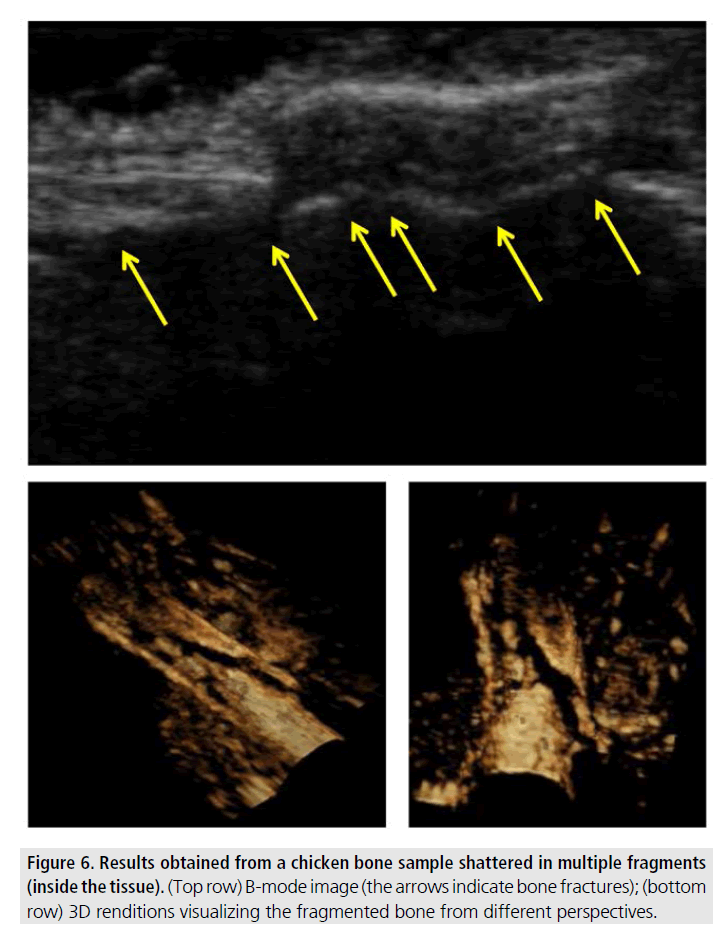
FIGURE 6 shows an example of ultrasonic imaging of a comminuted fracture in a chicken tibia. This type of fracture was induced in an intact tissue specimen by rapid application of a high external pressure. The figure shows a B-mode image of the specimen (top row), where several fractures are visible (indicated by the arrows). The 3D renditions provide a more comprehensive view of the various bone fragments and their relative positions inside the soft tissue.
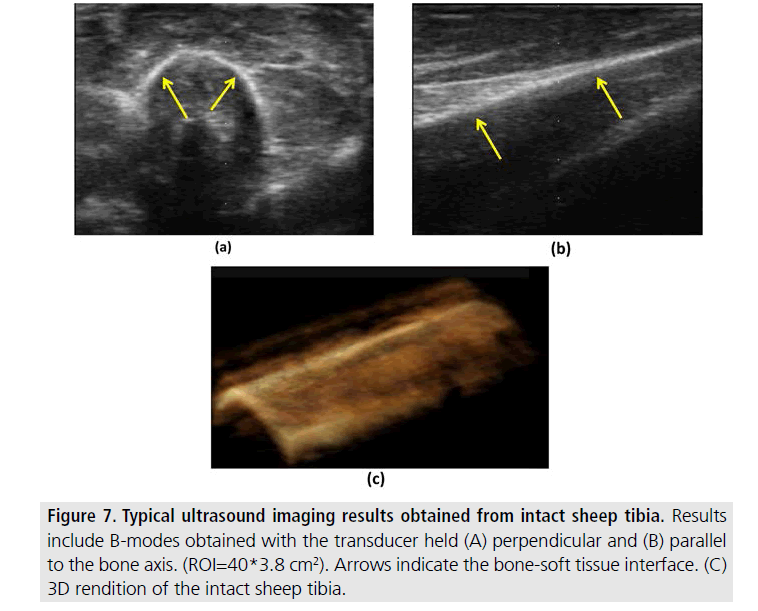
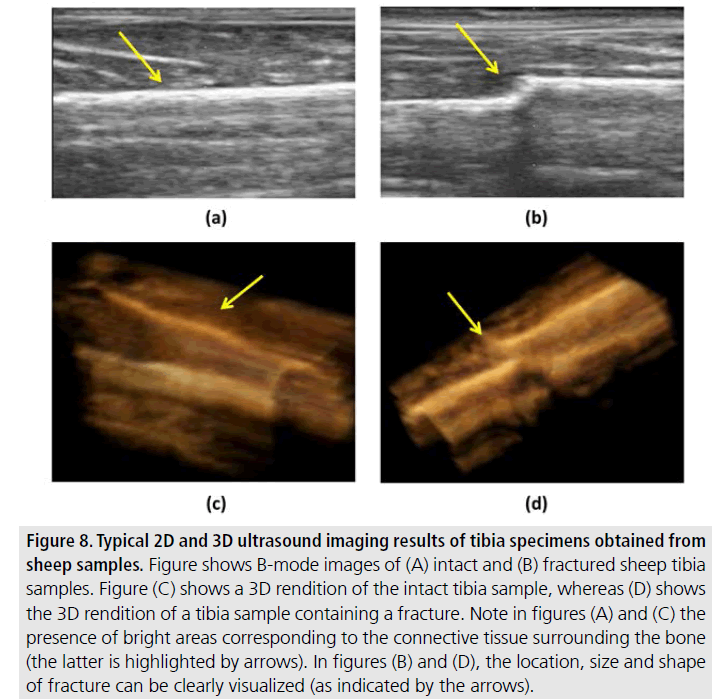
FIGURES 7 and 8 refer to data obtained from long bones in large animal specimens. FIGURE 7 shows two 2D views and a 3D rendition obtained from an intact sheep tibia. FIGURE 8 shows 2D and 3D renditions obtained from sheep tibias before (left) and after (right) fracture. While the presence of skin and connective tissue surrounding the bone may make bone localization more complicated and reduce contrast, it is still possible to clearly visualize the bone surface and detect the eventual presence of a bone defect even with minimal image post-processing methods such as those used in this study.
Figure 7.Typical ultrasound imaging results obtained from intact sheep tibia. Results include B-modes obtained with the transducer held (A) perpendicular and (B) parallel to the bone axis. (ROI=40*3.8 cm2). Arrows indicate the bone-soft tissue interface. (C) 3D rendition of the intact sheep tibia.
Figure 8.Typical 2D and 3D ultrasound imaging results of tibia specimens obtained from sheep samples. Figure shows B-mode images of (A) intact and (B) fractured sheep tibia samples. Figure (C) shows a 3D rendition of the intact tibia sample, whereas (D) shows the 3D rendition of a tibia sample containing a fracture. Note in figures (A) and (C) the presence of bright areas corresponding to the connective tissue surrounding the bone (the latter is highlighted by arrows). In figures (B) and (D), the location, size and shape of fracture can be clearly visualized (as indicated by the arrows).
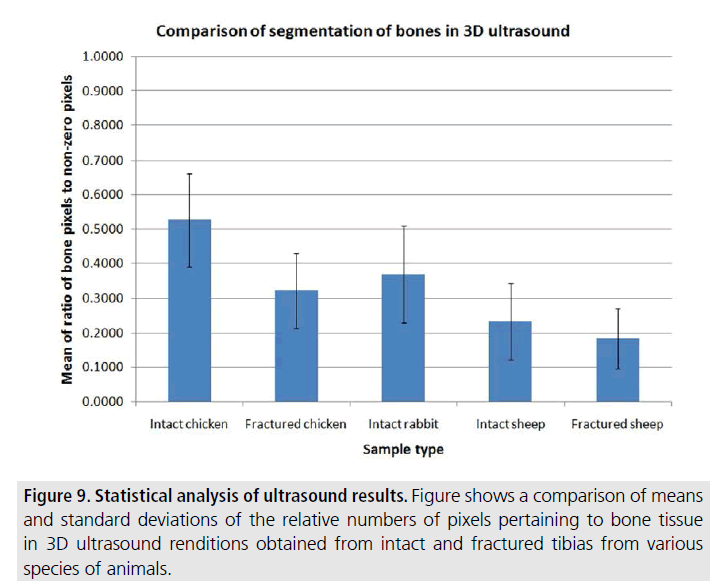
In FIGURE 9, we summarize our statistical results, by reporting the means and standard deviations of the ratio values in all analyzed cases for the various groups of tibias, based on species and integrity of the bone. As mentioned earlier, the ratio values provide a qualitative assessment of the 3D reconstruction, with higher numbers corresponding to “better” reconstructions. As per this graph, the intact chicken and rabbit cases have the highest ratio numbers. In the case of sheep data, the ratio numbers are typically lower than the chicken/rabbit most likely because these bones are positioned deep into the tissue and their echogenicity is in many cases not significantly different than that of soft tissue, suggesting the need of more sophisticated image processing methods.
Discussion
The use of ultrasound imaging techniques for bone and fracture assessment is becoming an attractive complementary technique with respect to X-rays and CT imaging methods, particularly in light of the risks associated with radiation exposure [8-12].
In this paper, we report preliminary results obtained using simple, fast and minimally processed 2D and 3D ultrasound images for visualizing different types of fractures and bony defects. From an imaging point of view, the animal bones and soft-tissues provide significant insight into human bony pathology. Since this study focused on the visualization of bone surfaces using ultrasound and did not deal with the estimation of internal bone properties, the use of animal specimens was found to be appropriate and convenient due to their abundant availability.
The results reported in this paper suggest that ultrasound imaging techniques may have significant potential as a new, safe, costeffective and real-time modality for bone imaging applications. Defects and fractures (and their characteristics) were demonstrated in the corresponding B-mode and 3D images. In general terms, it took about as much time to analyze the 3D ultrasound data as it takes to generate and analyze B-mode images in standard sonographic exams. Based on this preliminary study, the frequency requirements for ultrasound bone imaging techniques are the same as for any sonographic test. If the bone to be imaged is placed deep into the tissue, a lower frequency may be preferable. Ultimately, the success of the proposed methods depends on how clearly the bone surface is identifiable in the B-mode images used for the 3D reconstructions.
Figure 9.Statistical analysis of ultrasound results. Figure shows a comparison of means and standard deviations of the relative numbers of pixels pertaining to bone tissue in 3D ultrasound renditions obtained from intact and fractured tibias from various species of animals.
To our knowledge, the study reported in this paper is the first work that demonstrates the feasibility of real-time 3D ultrasound imaging of bone surfaces given a wide variety of bone defects and fractures and spanning a wide range of surface constitutions. These results demonstrate that it is feasible to generate real-time renditions of bone surfaces using standard diagnostic ultrasound scanners and that these images can be used to detect the presence of fractures and defects. In the presence of scattering or noise sources caused by the surrounding tissue, the use of post-processing imaging methods may be critical for proper 3D visualizations of bone surface and fractures. For this simple study, we applied modified intensity-slicing techniques that generalize thresholding methods, can be easily implemented and are computationally efficient and easy-to-use. We specifically avoided the use of very complex and computationally intense post-processing methods. The fact that we were able to obtain high quality 3D renditions despite the noise caused by the presence of the surrounding tissue and the relative simplistic post-processing methods is a demonstration of the significant potentials that these imaging techniques may have to be easily and widely adopted. This is especially relevant considering that most modern clinical scanners are equipped to perform 3D and postprocessing techniques similar to the ones used in our study. The statistical analysis carried out in this paper indicates that this simple postprocessing approach alone was not sufficient to produce high quality results in the case of sheep tibias. It should be noted that, even in the case of sheep tibias, the bones and fractures were still generally identifiable in the corresponding 3D renditions. However, the overall quality of these renditions was found to be lower than chicken/rabbit cases due to the presence of a relatively large amount of non-bone pixels in the 3D renditions (also reflected in the ratio numbers). In the recent past, several processing methods have been proposed to enhance and segment bone surfaces in 2D ultrasound images and improve the quality of 3D renditions [23,25]. However, these methods are generally computationally intense and not yet available in standard ultrasound systems.
The application of 3D ultrasound imaging techniques helped in the visualization of bone surfaces and allowed easier interpretation of the ultrasound results with respect to the case where 2D ultrasound imaging techniques alone are used. In general, the ability to interact with the reconstructed volume (such as rotating it around the various axes of rotation) in order to optimize visualization is a great advantage over any 2D imaging modality (including plain X-rays). The high resolution and contrast of the 3D ultrasound renditions may allow for the retrieval of useful information (maximum point of displacement, translation and rotation between bone fragments), which may prove clinically useful for fracture alignment during closed reduction and for the monitoring of bony healing. Based on these preliminary results, the major advantages of ultrasound techniques with respect to X-rays for bone imaging applications may include: visualization of multiple scanning planes; 3D information in real-time; availability of structural information regarding both soft tissue, bone and soft tissue-bone interface; no radiation; and greater sensitivity to soft-tissue trauma.
Conclusion
This study suggests that real-time ultrasound imaging techniques can be used to promptly scan bones for defects including fractures and controlled defects with relative ease. More sophisticated offline processing methods could be used to further refine and improve the visualization of the bone and provide higher quality 3D reconstructions.
Acknowledgement
This work is partially supported by funds from DARPA (grant W911NF-09-1-0044). The views, opinions and/or findings contained in this article are those of the authors and should not be interpreted as representing the official views or policies, either expressed or implied, of the Defense Advanced Research Projects Agency or the Department of Defense. “A” (Approved for Public Release, Distribution Unlimited).
References
- Greenfield GB. Radiology of bone diseases. 5th ed. Philadelphia, PA: Lippincott Williams & Wilkins (1990).
- DeLee JC, Drez JD, Miller MD. Orthopaedic Sports Medicine: Principles and Practice. 3rd ed. Philadelphia, PA: WB Saunders Co. (2009).
- Abdel-Dayem HM. The role of nuclear medicine in primary bone and soft tissue tumors. Semin. Nucl. Med. 27 355-363 (1997).
- Krishnamurthy GT, Tubis M, Hiss J et al. Distribution pattern of metastatic bone disease-A need for total body skeletal image. J. Am. Med. Ass. 237, 2504-2506 (1977).
- Kalpakcioglu BB, Morshed S, Engelke K et al. Advanced imaging of bone macrostructure and microstructure in bone fragility and fracture repair. J. Bone Joint Surg.-Am. 90, 68-78 (2008).
- Dijkman BG, Sprague S, Schemitsch EH et al. When is a fracture healed? Radiographic and clinical criteria. J. Orth. Trauma. 24, S76-S80 (2010).
- Sodickson A, Baeyens PF, Andriole KP et al. Recurrent CT, cumulative radiation exposure, and associated radiation-induced cancer risks from CT of adults. Radiology. 251, 175-184 (2009).
- Smith-Blindman R, Lipson J, Marcus R et al. Radiation dose associated with common CT examinations and the associated lifetime attributable risk of cancer. JAMA. Intern. Med. 169, 2078-2086 (2009).
- Berrington de Gonzalez A, Mahadevappa M et al. Projected cancer risks from CT scans performed in the United States in 2007. JAMA. Intern. Med. 169, 2071-2077 (2009).
- Redberg R. Cancer risks and radiation exposure from CT. JAMA. Intern. Med. 169, 2049-2050 (2009).
- Richards PJ, George J, Metelko M et al. Spine CT doses and cancer induction. Spine. 35, 430-433 (2010).
- Redberg RF, Smith-Bindman R. We are giving ourselves cancer.The New York Times Website. (2014).
- Banal F, Etchepare F, Rouhier B et al. Ultrasound ability in early diagnosis of stress fracture of metatarsal bone. Ann. Rheum. Dis. 65, 977-978 (2006).
- Bodner G, Stockl B, Fierlinger A et al. Sonographic findings in stress fractures of the lower limb: preliminary findings. Eur. Radiol. 15, 356-359 (2005).
- Wakefield RJ, Gibbon WW, Conaghan PG et al. The value of sonography in the detection of bone erosions in patients with rheumatoid arthritis - A comparison with conventional radiography. Semin. Arthritis. Rheum. 43, 2762-2770 (2000).
- Hirai T, Manders EK, Nagamoto K et al. Ultrasonic observation of facial bone fractures: Report of cases. J. Oral. Maxillofac. Surg. 54, 776-779 (1996).
- Williamson D, Watura R, Cobby M. Ultrasound imaging of forearm fractures in children: a viable alternative? J. Accid. Emerg. Med. 17, 22-24 (2000).
- Hübner U, Schlicht W, Outzen S et al. Ultrasound in the diagnosis of fractures in children. J. Bone. Joint.Surg.Br. 82, 1170-1173 (2000).
- Njeh CF, Boivin CM, Langton CM. The role of ultrasound in the assessment of osteoporosis: A review. Osteoporosis. Intern. 7, 7-22 (1997).
- Prins SH, Jorgensen HL, Jorgensen LV et al. The role of quantitative ultrasound in the assessment of bone: a review. Clin. Physiol. 18, 3-17 (1998).
- Gluer CC. Quantitative ultrasound techniques for the assessment of osteoporosis: Expert agreement on current status. J. Bone. Min. Res. 12, 1280-1288 (1997).
- Protopappas VC, Vavva MG, Fotiadis DI et al. Ultrasonic monitoring of bone fracture healing. IEEE Trans. Ultrason. Ferroelectr. Freq. Control. 55, 1243-1255 (2008).
- Hacihaliloglu I, Abugharbieh R, Hodgson AJ et al. Bone surface localization in ultrasound using image phase-based features. Ultras. Med. Biol. 35, 1475-1487 (2009).
- Karjalainen JP, Toyras J, Riekkinen O et al. Ultrasound backscatter imaging provides frequency-dependent information on structure, composition and mechanical properties of human trabecular bone. Ultras. Med. Biol. 35, 1376-1384 (2009).
- Hacihaliloglu I, Abugharbieh R, Hodgson A et al. Bone segmentation and fracture detection in ultrasound using 3D local phase features. Med. Image. Comput. Comput. Assist. Interv. 11, 287-295 (2008).
- Cho KH, Lee SM, Lee YH et al. Ultrasound diagnosis of either an occult or missed fracture of an extremity in pediatric-aged children. Korean. J. Radiol. 11, 84-94 (2010).
- Brooks AJ, Price V, Simms M et al. Handheld ultrasound diagnosis of extremity fractures. J. R. Army. Med. Corps. 150, 78-80 (2004).
- Ross E, MacGillivray T, Muir A et al. Imaging of the musculoskeletal system using 3D ultrasound. J. Bone. Joint. Surg. Br. 9, 451-452 (2009).
- Parmar BJ, Tasciotti E, Ferrari M et al. New ultrasound imaging techniques to visualize bone fractures, Annual Meeting National Center for Human Performance, Houston. TX. (2009).
- Parmar BJ, Longsine W, Sabonghy EP et al. Characterization of controlled bone defects using 2D and 3D ultrasound imaging techniques. Phys. Med. Biol. 55, 4839-4860 (2010).
- Kallel F, Prihoda CD, Ophir J. Contrast-transfer efficiency for continuously varying tissue modulii: Simulation and phantom validation. Ultrasound. Med. Biol. 27, 1115-1125 (2001).
- Gee A, Prager R, Treece G et al. Engineering a freehand 3D ultrasound system. Pattern. Recognit. Lett. 24, 757-77 (2003).
- Nelson TR, Elvins TT. Visualization of 3D ultrasound data. Comput. Graph. Appl. 13, 50-57 (2003).
- Gonzalez RC,Woods RE. Digital Image Processing, 3rd ed. Saddle River, NJ: Prentice Hall Upper. (2008).
