Review Article - Imaging in Medicine (2011) Volume 3, Issue 6
Picture-perfect: imaging techniques in juvenile idiopathic arthritis
Norah J Shire1 and Bernard J Dardzinski2*
1 351 Sumneytown Pike, North Wales, PA 19454, USA
2770 Sumneytown Pike, West Point, PA 19486, USA
- *Corresponding Author:
- Bernard J Dardzinski
770 Sumneytown Pike, West Point
PA 19486, USA
Tel.: +1 215 652 1726
Fax: +1 215 652 6913
E-mail: bernard.dardzinski@merck.com
Abstract
Juvenile idiopathic arthritis is a debilitating condition consisting of several categories of arthritis. Early detection, accurate diagnosis and monitoring of changes upon treatment are critical in order to minimize long-term sequelae. Imaging modalities, such as radiography, ultrasound and MRI are commonly employed to evaluate synovial inflammation, joint effusion, bone erosions and other disease manifestations. Challenges in pediatric populations arise from lack of technology appropriate for small joint imaging and the lack of available data for standardization and validation of imaging methods and disease grading. This review describes the optimal utility and advantages and disadvantages of various imaging methods, focusing on an in-depth review of current and novel MRI techniques and suggesting protocols for implementation.
Keywords
imaging; JIA; JRA; MRI; pediatric; rheumatology
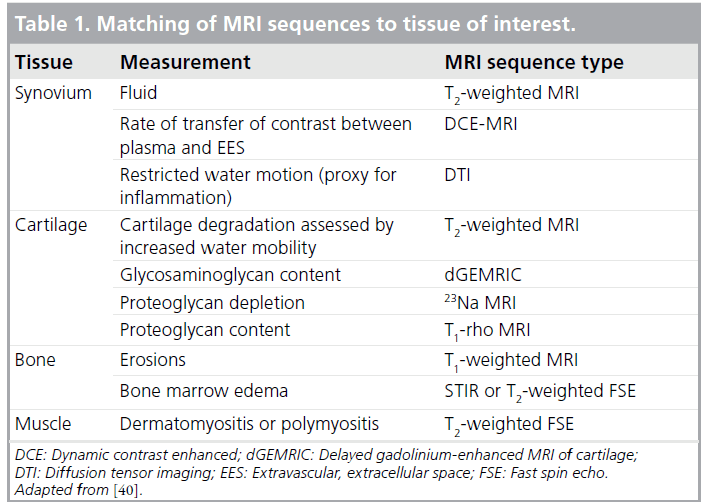
The International League of Associations for Rheumatology (ILAR) defines juvenile idiopathic arthritis (JIA) as any arthritis of unknown origin that begins prior to 16 years of age, persists for at least 6 weeks and is not associated with other known conditions [1]. It is the most common rheumatic disease in the pediatric population and can cause significant, long-term disability. A recent study from Spain estimated an annual incidence of 6.9 cases per 100,000 children under the age of 16 years and a prevalence of 40 cases per 100,000 [2]. Prior incidence estimates are comparable, ranging from 3.2 to 14 cases per 100,000 children per year [3–5]. As inflammatory cells infiltrate affected joints, the synovium undergoes increased fluid secretion and formation of pannus, which can erode bone and cartilage at the osteochondral junction and even into subchondral bone [6]. Outcomes of JIA range in severity from joint inflammation and stiffness to cartilage damage, bone erosion and growth impairment. It can persist through adolescence into adulthood with chronic morbidity, often requiring joint replacement surgery [7–10].
The ILAR classifies JIA into mutually exclusive categories of systemic arthritis, oligoarthritis, polyarthritis (factor-positive or -negative), psoriatic arthritis, enthesitis-related arthritis, and undifferentiated arthritis [1]. Imaging is critical for accurate diagnosis and categorization, monitoring of disease activity, treatment decisions [11] and patient follow-up. It is important to note that imaging modalities validated for use in adult populations may be less helpful with children as the disease course during skeletal growth may differ from that in adults. There are many imaging modalities available for these purposes. The aim of this review is to describe these imaging methods with a focus on MRI techniques and suggest protocols for implementation.
Conventional radiography
Conventional radiography remains the primary imaging method for JIA evaluation, at least in part because it is widely available and relatively inexpensive. Plain radiographs are important to exclude fractures, tumors and osteomyelitis, and if the initial evaluation of any of these conditions are clinically suspected, other imaging may be important in initial evaluation. Films may show features of JIA, including swelling of soft tissue, bone loss or erosions, joint space narrowing or misalignment, growth plate disturbances and periostitis [12]. These features are important for baseline assessment of disease severity and joint damage. Although screen films have historically been limited to displays of joint damage that appear late in disease progression, recent advances in digital radiography have improved data display and assessment. A study designed to evaluate the performance of digital radiography versus screen films determined that small, early erosions were visualized equally well by both methods [13]. However, an experiment with artificial erosions concluded that a flat-panel detector was superior to screen films, enabling the detection of bone erosions as small as 0.5 mm in diameter and depth [14] at clinical exposures. Ludwig et al. further posit that the exposure dose of ionizing radiation, one of the significant drawbacks of radiography, can be decreased by 50% while maintaining results comparable to typical films [14]. Although these advances are useful, radiography cannot be used to quantify the inflammatory activity of early disease, so other methods of assessment are needed.
Another disadvantage of radiography is standardization of assessment. Standardized tools are critical for evaluation of therapeutic benefit and disease progression; in fact, the US FDA requires evaluation of structural damage as an efficacy measure and states that slowing x-ray progression should be measured with a validated index for adults with rheumatoid arthritis [101]; however, methods validated for adult populations are not necessarily appropriate for pediatrics. Thus, several scoring mechanisms have been developed that are more appropriate for juvenile disease. One early method developed by Poznanski et al. established standards for normal carpal length in healthy children by measuring the ratio between radiometacarpal length and the second metacarpal bone length [15]. Advantages of this method include simplicity and practicality, and because this measurement is not dependent upon the degree of ossification of the carpal bones, it is appropriate for growing children and for those with advanced ossification. However, this system is only useful in those with wrist involvement and is not reliable with advanced erosive disease. More recently, the Dijkstra composite score was suggested as a method of scoring various features of JIA, such as soft tissue swelling, joint space narrowing, growth disturbances, osteopenia/osteoporosis, erosions, subchondral cysts and joint position in several joints [16,17]. As the authors noted, however, this was a somewhat complicated system that requires thorough radiologic knowledge of both normal and diseased joints, but it has the advantages of being sensitive to change and applicable to all joints. Other scoring methods have been developed or adapted to pediatric populations for specific joints, such as hip [18] and wrist/hand [19]. It is generally recognized, however, that other imaging methods are better suited for sensitive detection of very early inflammation and soft tissue changes, or much smaller erosions. Pediatric arthritis often has significant involvement of cartilage and synovium, which radiography is unable to accurately quantify; highly sensitive methods allow earlier assessment of joint damage and more rapid evaluation of therapeutic benefit.
Ultrasound
Ultrasound is a safe, relatively inexpensive and easily implemented method for assessing joint inflammation. Recent advances in resolution due to high frequency (12–15 MHz) linear probes have substantially improved joint visualization. This is extremely helpful for determining joint activity, since swelling and pain can be caused by factors other than JIA effusion. Moreover, the lack of radiation exposure renders sonography useful for longitudinal assessments, such as following treatment response or clinical course, although poor repeatability may require assessments to be conducted by the same sonographer over time. Sonography is also helpful for guiding aspiration or injection of joints.
Ultrasound can be used to determine severity of involvement of accessible joints, measuring features such as effusion volume, synovial thickness, bony erosions, and cartilage thinning or erosions. Spannow et al. have calculated normal reference ranges for both sexes for cartilage thickness of several joints, including knee, ankle and wrist, for children aged between 7 and 16 years, along with an algorithm for determining hyaline cartilage thickness [20]. It should be noted that the amount of inter- and intra-observer agreement can vary with ultrasound; one study demonstrated strong or acceptable agreement for several joints, but not for wrist [21]. However, the similarity of joint thickness between right and left extremities in healthy children that was found in this study provides a reference for determining the extent of disease activity in joint cartilage.
A recent study in knees of children with JIA concluded that ultrasound was 90% sensitive and 100% specific in the detection of effusion in clinically active knee joints, and detected effusion in 70% of clinically inactive joints; likewise, a synovial thickness greater than 2.3 mm had 94% positive and 84% negative predictive value for disease activity [22]. In this same study, ultrasound-determined synovial thickness of the knee correlated with disease activity score and articular indices, as well as biomarkers of disease activity, such as sedimentation rate and C-reactive protein level. Similarly, Magni- Manzoni et al. detected subclinical synovitis by ultrasound on 5.5% of 1560 clinical ‘normal’ joints [23]. Results from these studies and others [24] suggest that classification of disease based on clinical evaluation of joint involvement may be misleading.
Not all ultrasound studies have yielded such strong results, however. Sureda et al. were only able to document effusion in 60% of known clinical active knee joints, and similar findings were reported by Frosch et al. [25,26]. Recently, ultrasound was unable to reliably demonstrate ankle joint disease in patients with documented JIA, identifying effusion in less than 33% of clinically active joints [27]. Methods of measurement, such as determining bursa length versus volume, and ultrasound equipment, may play a role in such divergent results. Power and color Doppler ultrasound methods, which detect increases in synovial vascularization by measuring synovial blood flow, have improved the ability to measure inflammatory activity [28,29]. Such methods have been used to predict short-term relapse in patients in apparent clinical remission [30]. Although few studies have been conducted in children, a recent report combining grayscale ultrasound and power Doppler documented ongoing inflammation in children who had been in clinical remission for at least 3 months [31], and other studies have documented relapse in ankle joints [32] and subclinical synovitis in other joints [33] with Doppler ultrasound.
Other disadvantages of ultrasound include difficulty in assessing some joints, such as the temporo-mandibular joint, and the generally small size of joints in young children. Although inter-observer reproducibility can also play a role in variability of measurement, Magni-Manzoni et al. demonstrated that ultrasound can be a strongly reproducible modality, with interobserver reproducibilities of 83, 84 and 95% for determining the presence or absence of joint effusion, synovial hypertrophy and power Doppler signal, respectively [34]. It should be noted, however, that even reproducible results may need to be interpreted with caution. A recent MRI-based analysis of wrist joints in healthy children aged 6–15 years demonstrated a high prevalence of bony depressions, signal changes indicating bone marrow edema and significant joint fluid [35], suggesting that developing joints may be variable in appearance. This underscores the need for a baseline assessment in children with JIA.
MRI
MRI introduction
MRI-based methods have advanced dramatically over the past decade for imaging of JIA, and comprise the optimal imaging modality for assessing very early, pre-erosive stages of disease, and for determining response to therapy. MRI is most important in children with polyarticular disease, while its importance in the child with oligoarticular involvement is generally for exclusion of other diagnoses, such as co-existent trauma or tumor. MRI has its greatest use when radiographs fail to exclude these other conditions. They may be clinically suspected in all children with arthritis because of persisting well-localized bone tenderness on physical examination, and in children with active polyarticular arthritis in whom affected joints show progressive loss of motion or swelling despite optimized treatment. MRI is also important in documenting sacroiliitis in patients with severe enthesitis- related arthritis [36].
There are a broad range of sequences and protocols available, and it is critical to understand the tissue characteristics and disease pathology of interest to ensure the best protocol for each. Studies have demonstrated the superiority of MRI over radiography and ultrasound in assessment of bone erosions and soft tissue involvement [37–39]. Examples of MRI methods that are generally appropriate by tissue type are displayed in Table 1 (adapted from [40]). One difficulty with MRI is that standardized grading scores for joint disease activity and consensus definitions are not as well validated as in adults, and may be difficult to validate in growing joints regardless of how many patients are studied. Unlike the large body of information gathered and collated into Rheumatoid Arthritis MRI Score (RAMRIS) by the Outcome Measures in Rheumatology Clinical Trials (OMERACT) MRI group [41], pediatric data are more scarce. A recent study aimed to develop and validate a pediatric MRI scoring system for JIA and to compare this system to RAMRIS [42]. Overall, the pediatric MRI scoring system was highly reliable for assessment of erosions and conventional damage assessments, but did not correlate well with active disease parameters and was not as sensitive to change as RAMRIS. Interestingly, RAMRIS also provided valid and reliable assessments of synovitis. Interpretations from this study are limited by its small sample size (66 patients) and the lack of agematched healthy controls, but it is a start toward addressing the problem of consistent definitions and MRI-based scoring in pediatric patients.
Generally, disease processes that involve changes in water content, including joint effusion, should be imaged with sequences that are sensitive to increases in proton mobility, such as T2-weighted fast spin echo sequences. In the case of synovitis, a hallmark of disease activity in JIA, the synovium will be visualized as thick and irregular with MRI, and will have high signal intensity on T2-weighted sequences. Differentiation between joint effusion and synovium may be difficult due to similar signal intensity; heavily T2-weighted, fast spin echo sequences may help in this regard [43]. Furthermore, the child with arthritis who has weakness out of proportion to the clinical findings of arthritis may be developing dermatomyositis or polymyositis. MRI with T2-weighted images of the proximal lower extremities can identify sites of affected muscle, which are potential candidates for diagnostic biopsy.

Figure 1.Representative sagittal, fast-spin echo dual echo images with fat saturation MRIs of a knee of a 13-year-old male with mild juvenile idiopathic arthritis. The field of view = 180 mm, the data matrix was 256 × 256, slice thickness = 3 mm, slice gap = 1 mm, repetition time = 4000 ms, number of averages = 2, echo train length = 8, pixel bandwidth = 81 Hz, total acquisition time = 3 min 12 s. (A) Proton density image with echo time = 16 ms. (B) T2-weighted image with echo time = 80 ms.
Bone erosions are typical in advanced polyarticular disease and large lesions are easily identifiable by conventional radiography. Highfrequency ultrasound has also shown potential to detect changes in adult bone in patients with rheumatoid arthritis [44,45] and erosive osteoarthritis [46]. Erosive disease has been associated with poorer outcomes in JIA patients [47], and erosions that are detectable by radiography or ultrasound may indicate irreversible damage. Thus, early identification of small erosions is extremely helpful in determining prognosis and assessing treatment options. Malattia et al. demonstrated that MRI is superior to both radiography and ultrasound in revealing bone erosions in the wrist and in revealing erosions in patients with less than 3 years’ disease duration [37]. Utilizing a T1-weighted, 3D gradient echo sequence for image acquisition and multiplanar reconstruction was found to be optimal for identification of small erosions. This is consistent with studies in adult RA in which bone erosions were detected on average 2 years earlier with MRI than with conventional radiography [48]. Unfortunately, further data regarding MRI compared with radiography versus ultrasound are lacking in pediatric populations, and further studies are certainly warranted.
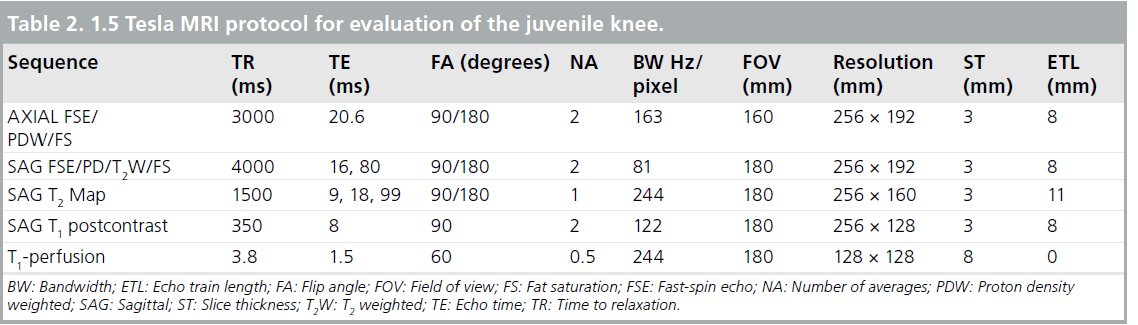
Proton density (PD) images are used for anatomical information to assess joint integrity. These two image sets are usually collected simultaneously as dual echo PD-, T2-weighted sequences collected in both the sagittal and axial planes [49]. A typical imaging protocol at 1.5 Tesla (T) for knee joint evaluation can be seen in Table 2. Representative PD-, T2-weighted images are shown in Figure 1.
Contrast-enhanced MRI
Although T2-weighted fast spin echo sequences are helpful for imaging inflamed synovium, the best method is with contrast-enhanced MRI [50,51]. The rate of enhancement of synovium with contrast is dependent in part on tissue vascularization and capillary permeability, both of which are highly correlated with synovial inflammation [52–54]. Assessing rate of enhancement (dynamic contrast-enhanced [DCE] MRI) is also useful for helping to distinguish between joint effusion and synovitis, both of which are disease attributes with high water content. Since the contrast agent can quickly diffuse into the synovial fluid and confound differentiation, a T1-weighted, fatsuppressed image should be acquired between 5 and 10 min post-contrast injection (Figure 2). A precontrast T1-weighted image can be used for subtraction to increase conspicuity. The volume of synovium can be calculated from the post-contrast images or from the subtracted images and can then be used to monitor treatment response as shown in Figure 3 [55]. If chemical shift saturation or water excitation gives incomplete or poor fat saturation, short-tau inversion recovery imaging, another water-sensitive technique that nullifies the fat signal, can be used for T2-weighting. DCE-MRI has been demonstrated to be both valid and reliable, with excellent intraclass correlation coefficients for inter-reader agreement of synovial inflammatory activity of wrist and hip joints [50]. It has also demonstrated early hip involvement in JIA patients without clinical evidence of disease activity [56].
Pharmacokinetic parameter mapping

Figure 2.T1-weighted, post-contrast MRI of a knee of a child with juvenile idiopathic arthritis. Hyperintense signal areas represent inflamed synovium. The field of view = 180 mm, the data matrix was 256 × 256, slice thickness = 5 mm, slice gap = 1 mm, repetition time = 350 ms, echo time = 8 ms, number of averages = 2, echo train length = 1, pixel bandwidth = 81 Hz, total acquisition time = 1 min 30 s.
Information gleaned from DCE-MRI can be enhanced even further using pharmacokinetic (Pk) modeling for quantitative mapping [51,57,58]. In this physiologically based model, signal enhancement time courses are described by a plasma compartment and the extracellular– extravascular space. Pk parameters that are representative of tissue signal enhancement patterns include Ktrans (the rate of contrast transfer from plasma to extravascular space ), Kep (the rate constant denoting the rate of contrast transfer from extravascular space to plasma), and Vp (the fraction of plasma space per unit volume of tissue) [51]. These are obtained by iteratively fitting the data to model equations by nonlinear leastsquares curve fitting on a pixel-by-pixel basis. To obtain the required data, dynamic images can be acquired every 5 s while the contrast agent is being injected (Figures 4 & 5). Overall, approximately 40 images are acquired. The first four are used as a baseline of precontrast steady-state of signal intensity. The fourth precontrast image (after T1-relaxation saturates) can be subtracted from the 40th image (post-contrast) to indicate areas of contrast agent uptake and synovitis (Figure 6). Color-coded parameter maps are generated, as shown in Figure 7. The parameters for each pixel are coded depending on their magnitudes, with minimum values as blue and maximum values as red, to facilitate visual comparisons during longitudinal assessments. Pk parameters have been shown to decrease in children under treatment over time, and provide specific, local information on synovial inflammation [58]. The total time for acquisition is approximately 3 min, so this dynamic methodology does not increase the total examination time and the software required is generally available on commercial imaging platforms.

Figure 3.T1-weighted images and segmentations to measure synovial volume in a knee of a child with juvenile idiopathic arthritis. MRI parameters are the same as Figure 2. Segmentation is performed with K-means clustering. (A) A typical segmentation example showing enhanced synovium with the red outline. (B) A representative slice with segmentation prior to treatment. Total synovial volume for all slices = 34 ml. (C) A representative slice with segmentation 1 year post-treatment. Total synovial volume for all slices = 11 ml.

Figure 4.Dynamic contrast-enhanced MRI. These are 3D gradient echo images of the hand. Each 3D volume takes 5 s to acquire. Four datasets are acquired prior to contrast agent injection. Thirty six more volumes are collected postinjection for a total of 40 datasets. The field of view = 180 mm, the data matrix was 128 × 128, slice thickness = 8 mm, slice gap = 0 mm, repetition time = 3.8 ms, echo time = 1.5 ms, number of averages = 0.5, pixel bandwidth = 244 Hz, total acquisition time = 5 s per volume.
T2 mapping
T2 relaxation mapping is another parametric technique that can be easily implemented to assess cartilage hydration or collagen orientation in normal as well as immature or diseased cartilage [59,60]. Typically, there is a general decrease in T2 relaxation from the cartilage surface to the deeper layers [61,62], but cartilage degradation that occurs with JIA has been shown to increase T2 relative to age-matched controls [63]. T2 relaxation maps are calculated from a series of multislice multiecho images (Figure 8). Magnitude, gray and color scale T2 maps are produced for evaluation (Figure 9). Typical maps showing elevated T2 in a 10‑year-old girl with JIA compared with a healthy 10-year-old boy are shown in Figure 10. The T2 change from the subchondral bone to the articular surface is graphed in Figure 11 for a girl with JIA, a healthy boy and for a healthy adult. T2 mapping is performed before contrast agent injection to preclude the effects of T1 and T2 shortening, although the effects of contrast on T2 are minimal [Dardzinski B, Unpublished Data]. Other techniques used to evaluate cartilage include contrast-free T1-rho or delayed gadolinium-enhanced MRI of cartilage (dGEMRIC) [64–66]. Parameter maps from these techniques evaluate proteoglycan content, which is critical in adults for maintaining cartilage stiffness and is decreased with disease. However, the importance of proteoglycan abnormalities in children with JIA has not been established.

Figure 5.Dynamic contrast-enhanced MRI of the hand.(A) A color-coded pharmacokinetic parameter map of the permeability constant, kp. (B) A normalized signal intensity versus time curve of the color-coded region of interest from the permeability map.
Alternative techniques: diffusion tensor imaging & 23Na MRI

Figure 6.3D subtraction image from a dynamic contrast-enhanced MRI series of the knee. The 4th volume image (precontrast) has been subtracted from the 40th volume image (post-contrast). This increases the conspicuity of regions of update of contrast agent. The hyperintense regions indicate perfusion of the distal femoral and proximal tibial physes (yellow arrows) as well as areas of synovitis (red arrows). Perfusion of physes is normal in children and can complicate segmentation of synovial volume.
Diffusion tensor- or diffusion-weighted imaging (DWI) is a technique that measures the Brownian motion of water [67,68], which is freely isotropic in pure liquid, but is anisotropic in tissue [69]. Diffusion is hindered by cellular membranes and organelles. By applying magnetic field gradients in multiple directions, the anisotropic behavior in the tissue compartment of interest can be assessed. The appeal of DTI is that it is contrast-free, thus avoiding possible adverse events with administration of gadolinium- based contrast agents. This technique has been applied to the brain to map fiber tract trajectories in white matter and to perform diffusion tractography [70]. The use of DTI to assess cartilage in knee joints is limited due to the short T2 relaxation time of cartilage (30–70 ms) [61], although a 3D steady-state DWI sequence has been proposed [71]. Conventional T2 relaxation time mapping provides a measure of cartilage hydration and reflects collagen orientation and breakdown [59]. One study in adults demonstrated that DTI performed as well as T1-weighted contrast-enhanced MRI at detecting synovial inflammation [72]. Another study found that DWI was able to identify cartilage maturation post-chondrocyte transplantation [73]. Although the contrast-free approach is a desirable one, challenges in implementation and analysis currently limit the utility of this technique.

Figure 7.Quantitative parameter maps from pharmacokinetic modeling of dynamic contrast-enhanced MRI data. (A) The volume transfer coefficient (Ktrans), which is the rate of transfer of the contrast agent from plasma to the extravascular, extracellular space. (B) The rate constant Kep, which is the rate of transfer of contrast agent from the extravascular, extracellular space to the plasma. (C) Displays vp, the fraction of plasma space per unit volume of tissue. This modeling permits early quantitative assessment of disease activity and treatment response.

Figure 8.The first nine of 11 multislice, multiecho images used to calculate T2 relaxation time maps. The field of view = 180 mm, the data matrix was 256 × 160, slice thickness = 3 mm, slice gap = 0 mm, repetition time = 1500 ms, echo time = 9, 18, … 99 ms, number of averages = 1, echo train length = 11, pixel bandwidth = 244 Hz, total acquisition time = 4 min.
Another alternative MRI method is 23Na MRI [74], which identifies areas of proteoglycan depletion through bonding of the positively charged sodium with negatively charged glycosaminoglycan molecules [75] and specific protocols have been suggested for cartilage assessment [76]. The major limitation of this technique is the low overall sodium content in cartilage, which limits the signal-to-noise ratio (SNR). MRI protocols using systems with higher (7 T) field strengths are being evaluated to help overcome this significant challenge [77–79].
Higher field strengths & other considerations
The use of 3 T MRI systems has increased over the past several years for small joint imaging [50–82]. The increase in field strength can be used to decrease scan time or increase resolution. This is due to the increase in SNR (Figure 12). Contrast to noise is also increased (Figure 13). For 3 T systems, protocols need to be modified from those implemented with 1.5 T systems due to increases in T1 and potential decreases in T2, depending on tissue type (Figures 14 & 15) [83]. For conventional sequences, repetition time (TR) needs to be increased and echo time (TE) needs to be decreased. The echo train length (ETL) can also be increased to shorten imaging time. A knee protocol consisting of three planes of fatsaturated intermediate-weighting (IW) can be implemented in 10 min if contrast is not needed (Figure 16). To suppress the fatty marrow, inversion time needs to be increased at 3 T due to the increase in T1, and should also be adjusted to the amount of fat present due to skeletal maturity (Figure 17). The receiver bandwidth also needs to be increased to reduce chemical shift artifact. With the increased SNR, high resolution images can be acquired in 3D and can be reformatted in any plane. The key to successful reformatting is to keep the in-plane resolution below 0.4 mm and the slice thickness below 0.7 mm (Figure 18).

Figure 9.T2 relaxation time maps of knee cartilage from a 13-year-old male with mild juvenile idiopathic arthritis calculated from the 11 echo images in Figure 8. (A) The magnitude image; (B) the grayscale T2 relaxation time map; (C) color-coded T2 relaxation time map.

Figure 10.Gradient echo images and T2 relaxation time maps from the patellar cartilage of a 10-year-old girl with juvenile idiopathic arthritis compared with a 10-year-old healthy boy. Although the gradient echo images do not reveal structural differences, the T2 maps show clear biochemical differences indicative of disease activity, indicated by yellow and red dashed ellipses. GRE: Gradient recalled echo; JIA: Juvenile idiopathic arthritis.
Along with the MRI protocol, coil type is also critical. Coils should provide a high SNR and there are choices available for most joints, including temporo-mandibular, shoulder, knee, and ankle; however, the size of the coil should match the anatomy to maintain a high SNR, and as most coils are sized for adults, this can require some creativity in pediatrics. For example, it is possible to use an adult wrist coil on the elbow of a small child. The size of the coil is important, especially in the pediatric setting where the anatomy is typically small.

Figure 11.T2 relaxation profiles across the patellar cartilage from the images in Figure 10. Note that the profiles across the cartilage are similar for a healthy boy and a healthy adult, but the profiles for the girl with JIA are elevated and relatively homogeneous from the subchondral bone to the articular surface. JIA: Juvenile idiopathic arthritis.

Figure 12.Signal-to-noise ratio measurements in the pediatric knee of an 11-year-old boy as a function of field strength and receiver bandwidth. The SNR is calculated as the signal from the tissue of interest divided by the standard deviation of the background noise. The increase in SNR at 3 T is 30–100% higher than at 1.5 T and varies with tissue type. The field of view = 160 mm, the data matrix was 256 × 192, 75% phase field of view, slice thickness = 3 mm, slice gap = 0 mm, repetition time = 3000 ms, echo time = 13 ms, number of averages = 1, echo train length = 7 (1.5 T) and 6 (3 T), pixel BW = 122, 244 Hz at 1.5 T 125, 250 Hz at 3 T. MRI Systems: 1.5 T GE Signa, 3 T Siemens Trio. BW: Bandwidth; ROI: Region of interest; SNR: Signal-to-noise ratio.
Limitations of MRI in pediatrics
Although MRI is a powerful and flexible technology for the assessment of joint disease in children, there are limitations. One such challenge, the lack of standardized grading systems for joint activity and the lack of consensus on definitions, has been addressed above. Natural variability in joint development [35] poses another difficulty, both in standardizing joint activity definitions and in evaluating disease. As suggested previously, baseline assessments for each child are very important in understanding joint involvement and changes over time. Another limitation is the inability to image more than one joint in a session; several sessions may be required to assess various joints with different MRI protocols. Bone scintigraphy may be helpful in cases where it is not possible to define the region for imaging. For example, children with nonlocalized extremity pain may have occult osteomyelitis. Scintigraphy can elucidate the involved areas, pointed to regions for further studies. Similarly, in children with chronic fever and lower extremity pain, bone scan may show changes typical of neuroblastoma, such as adrenal uptake or metastatic uptake in ribs.

Figure 13.Contrast-to-noise ratio measurements in the pediatric knee of an 11-year-old boy as a function of field strength and receiver bandwidth. The CNR is calculated by the difference in signal between two tissues of interest divided by the standard deviation of the background noise. The CNR is increased in most tissue types with increasing field strength. The field of view = 160 mm, the data matrix was 256 × 192, 75% phase field of view, slice thickness = 3 mm, slice gap = 0 mm, repetition time = 3000 ms, echo time = 13 ms, number of averages = 1, echo train length = 7 (1.5 T) and 6 (3 T), pixel BW = 122, 244 Hz at 1.5 T 125, 250 Hz at 3 T. MRI Systems: 1.5 T GE Signa, 3 T Siemens Trio. BW: Bandwidth; CNR: Contrast-to-noise ratio; ROI: Region of interest.

Figure 14.T1 relaxation time map in the pediatric knee showing field strength effect at 1.5 and 3 T. Top image: color-coded T1 relaxation time maps. Bottom table: quantitative T1 relaxation times for four tissue types at 1.5 and 3 T. The T1 relaxation time increases range from 8–40% depending on tissue type. Single slice saturation recovery images used to calculate T1. The field of view = 160 mm, the data matrix was 256 × 160, slice thickness = 3 mm, repetition time = 50, 67, 100, 200, 400, 750, 1250, 2000 and 3000 ms, echo time = 10 ms, number of averages = 1, echo train length = 3, pixel BW = 250 Hz, echo train length = 3. MRI Systems: 1.5 T GE Signa, 3 T Siemens Trio. ROI: Region of interest.
Finally, sedation during MRI may be required in small children; however, the advent of videocompatible MRI systems has alleviated this concern. In the authors’ experience, children as young as 3 years of age can watch engaging videos while being scanned, and frequently are reluctant to leave the scanner until the video is over! Finally, although anaphylactic or injection site reactions to contrast agent are rare, they have been reported in post-licensure experience [84], and safety in children younger than 2 years of age has not been established.

Figure 15.T2 relaxation time map in the pediatric knee showing field strength effect at 1.5 and 3 T. Left image: color-coded T2 relaxation time maps. Right table: quantitative T2 relaxation times for four tissue types at 1.5 and 3 T. The T2 relaxation times are generally constant but demonstrate small decreases in cartilage. Imaging parameters were the same as those in Figure 8. MRI Systems: 1.5 T GE Signa, 3 T Siemens Trio. ROI: Region of interest.

Figure 16.Intermediate-weighted, fast-spin echo images at 3 T in the pediatric knee. Axial, sagittal and coronal planes are displayed in (A, B & C), respectively. A typical protocol for one orientation would include: field of view = 140 mm, the data matrix was 320 × 256, slice thickness = 3 mm, slice gap = 1 mm, voxel size = 0.5 × 0.4 × 3.0 mm, repetition time = 3000 ms, echo time = 39 ms, number of averages = 1, pixel bandwidth = 130 Hz, echo train length = 7, echo spacing = 12.8 ms, total acquisition time = 3 min 49 s. MRI System: 3 T Siemens Trio.

Figure 17.Inversion recovery prepped fast (turbo) spin echo images for fat saturation (STIR or TIRM). TI must be increased from 150 ms at 1.5 T to approximately 210 ms at 3 T to obtain comparable fatty marrow suppression. This is related to the increase in T1 of fat by 40% at 3 T. The TI value required for adequate fat suppression may be related to the degree of skeletal maturity and fatty marrow conversion. In the above examples, TI = 210 ms achieved the desired contrast; however, this value may be different in other children and for other pathologies. (A) 12-year-old boy. (B) 16-year-old girl. Field of view = 140 mm, the data matrix was 320 × 256, slice thickness = 3 mm, slice gap = 1.5 mm, repetition time = 3500 ms, echo time = 13 ms, TI as shown in figure, number of averages = 1, pixel bandwidth = 130 Hz, echo train length = 7, total acquisition time = 2 min 9 s. MRI Systems: 1.5 T GE Signa, 3 T Siemens Trio. TI: Inversion time.
Conclusion
It is clear that there are several options for pediatric imaging in the context of JIA, from widely available, low-cost methods such as radiography and ultrasound, to more complex MRI-based techniques. As with adults, the earlier the disease is caught, the better the clinician is able to render an accurate diagnosis and assess treatment and follow-up options and avert long-term disability. Thus, the accessibility of conventional radiography and ultrasound may be outweighed by the need to gather as much information about affected joints as early as possible in the disease course, and to assess progress with treatment. Several MRI-based techniques are available for these purposes.

Figure 18.3D dual-echo steady-state gradient echo imaging in the sagittal plane and reformatted into the coronal and axial planes. (A) Images were acquired in the sagittal plane. (B) Coronal reformat of sagittal 3D volume. (C) Axial reformat of sagittal 3D volume. Field of view = 120 mm, the data matrix was 320 × 320, voxel size = 0.4 × 0.4 × 0.7 mm, repetition time = 15.3 ms, echo time = 4.4 ms, number of averages = 1, pixel bandwidth = 200 Hz, flip angle = 25 degrees, total acquisition time = 6 min 37 s. MRI System: 3 T Siemens Trio.
It is also clear that data in pediatric patients are sorely lacking for validation and standardization of imaging methods, especially in MRI.
Coils and protocols are generally developed for adults with RA or osteoarthritis and assumed to be translatable to the pediatric population. The field would benefit tremendously from larger pediatric studies or pooled data analyses to assist with protocol validation and standardization of MRI-based disease grading. However, large strides in pediatric research have certainly been made over the past decade, and continued improvements in both treatment options and in sensitive methods for imaging disease progression will undoubtedly improve the lives of many children living with JIA.
Future perspective
As 3 T and 7 T imaging systems are being introduced into mainstream imaging (7 T mainly for research), resulting increases in SNR and in resolution will facilitate enhanced imaging of small joints [85]. At 7 T it will also be possible to image sodium signal from cartilage [86]. With the improved SNR from higher field strengths, what is important for small joint imaging will be dedicated transmit–receive RF coils that will increase the SNR while reducing the specific absorption rate. Specific absorption rate becomes a problem for whole body transmit and phased array receive and will pose more of a challenge on 3 T systems as 7 T systems remain research only and lack body RF coils for excitation. Another important advance in MRI would be to have dedicated extremity gradient coils to increase resolution and speed as compared with fixed whole body gradients and that do not cause peripheral nerve stimulation.
An intriguing option in the future will be the use of optical imaging to probe angiogensis with nonspecific fluorescent probes. Such studies are currently being performed in adult rheumatoid arthritis. The use of idocyanine green contrast agent allows for nonspecific, fast and longitudinal imaging of disease activity. First applications are in the hands and wrist since the thickness of the hand does not severely limit depth penetration of photons. In the future it is likely that this technique can be used with specific probes to target the disease process of interest (e.g., integrins and proteases) and with handheld systems for other joints [87–95].
Financial & competing interests disclosure
The authors have no relevant affiliations or financial involvement with any organization or entity with a financial interest in or financial conflict with the subject matter or materials discussed in the manuscript. This includes employment, consultancies, honoraria, stock ownership or options, expert testimony, grants or patents received or pending, or royalties.
No writing assistance was utilized in the production of this manuscript.
References
- Petty Re, Southwood Tr, Manners P et al. International League of Associations for Rheumatology classification of juvenile idiopathic arthritis: second revision, Edmonton, 2001. J. Rheumatol. 31(2), 390–392 (2004).
- Modesto C, Anton J, Rodriguez B et al. Incidence and prevalence of juvenile idiopathic arthritis in Catalonia (Spain). Scand. J. Rheumatol. 39(6), 472–479 (2010).
- Gortmaker Sl, Sappenfield W. Chronic childhood disorders: prevalence and impact. Pediatr. Clin. North Am. 31(1), 3–18 (1984).
- Malleson Pn, Fung My, Rosenberg Am. The incidence of pediatric rheumatic diseases: results from the Canadian Pediatric Rheumatology Association Disease Registry. J. Rheumatol. 23(11), 1981–1987 (1996).
- Riise Or, Handeland Ks, Cvancarova M et al. Incidence and characteristics of arthritis in Norwegian children: a population-based study. Pediatrics 121(2), E299–E306 (2008).
- Ravelli A, Martini A. Juvenile idiopathic arthritis. Lancet 369(9563), 767–778 (2007).
- Magni-Manzoni S, Pistorio A, Labo E et al. A longitudinal analysis of physical functional disability over the course of juvenile idiopathic arthritis. Annals Rheum. Dis. 67(8), 1159–1164 (2008).
- Malviya A, Johnson-Lynn S, Avery P, Deehan D, Foster H. Juvenile idiopathic arthritis in adulthood and orthopaedic intervention. Clin. Rheumatol. 28(12), 1411–1417 (2009).
- Minden K, Niewerth M, Listing J et al. Long-term outcome in patients with juvenile idiopathic arthritis. Arthritis Rheum. 46(9), 2392–2401 (2002).
- Susic Gz, Stojanovic Rm, Pejnovic NN et al. Analysis of disease activity, functional disability, and articular damage in patients with juvenile idiopathic arthritis: a prospective outcome study. Clin. Exp. Rheumatol. 29, 337–344 (2011).
- Beukelman T, Patkar Nm, Saag Kg et al. 2011 American College of Rheumatology recommendations for the treatment of juvenile idiopathic arthritis: initiation and safety monitoring of therapeutic agents for the treatment of arthritis and systemic features. Arthritis Care Res (Hoboken). 63(4), 465–482 (2011).
- Cohen Pa, Job-Deslandre Ch, Lalande G, Adamsbaum C. Overview of the radiology of juvenile idiopathic arthritis (JIA). Eur. J. Radiol. 33(2), 94–101 (2000).
- Van Der Jagt Ej, Hofman S, Kraft Bm, Van Leeuwen Ma. Can we see enough? A comparative study of film-screen vs digital radiographs in small lesions in rheumatoid arthritis. Eur. Radiol. 10(2), 304–307 (2000).
- Ludwig K, Henschel A, Bernhardt Tm et al. Performance of a flat-panel detector in the detection of artificial erosive changes: comparison with conventional screen-film and storage-phosphor radiography. Eur. Radiol. 13(6), 1316–1323 (2003).
- Poznanski Ak, Hernandez Rj, Guire Ke, Bereza Ul, Garn Sm. Carpal length in children – a useful measurement in the diagnosis of rheumatoid arthritis and some concenital malformation syndromes. Radiology 129(3), 661–668 (1978).
- Van Rossum Ma, Boers M, Zwinderman AH et al. Development of a standardized method of assessment of radiographs and radiographic change in juvenile idiopathic arthritis: introduction of the Dijkstra composite score. Arthritis Rheum. 52(9), 2865–2872 (2005).
- Van Rossum Maj, Zwinderman Ah, Boers M et al. Radiologic features in juvenile idiopathic arthritis: a first step in the development of a standardized assessment method. Arthritis Rheum. 48, 507–515 (2003).
- Bertamino M, Rossi F, Pistorio A et al. Development and initial validation of a radiographic scoring system for the hip in juvenile idiopathic arthritis. J. Rheumatol. 37(2), 432–439 (2010).
- Ravelli A, Ioseliani M, Norambuena X et al. Adapted versions of the Sharp/van der Heijde score are reliable and valid for assessment of radiographic progression in juvenile idiopathic arthritis. Arthritis Rheum. 56, 3087–3095 (2007).
- Spannow Ah, Pfeiffer-Jensen M, Andersen Nt, Herlin T, Stenbog E. Ultrasonographic measurements of joint cartilage thickness in healthy children: age- and sex-related standard reference values. J. Rheumatol. 37(12), 2595–2601 (2010).
- Spannow Ah, Pfeiffer-Jensen M, Andersen Nt, Stenbog E, Herlin T. Inter- and intraobserver variation of ultrasonographic cartilage thickness assessments in small and large joints in healthy children. Pediatr. Rheumatol. Online J. 7, 12 (2009).
- Algergawy S, Haliem T, Al-Shaer O. Clinical, laboratory, and ultrasound assessment of the knee in juvenile rheumatoid arthritis. Clin. Med. Insights Arthritis Musculoskelet. Disord. 4, 21–27 (2011).
- Magni-Manzoni S, Epis O, Ravelli A et al. Comparison of clinical versus ultrasounddetermined synovitis in juvenile idiopathic arthritis. Arthritis Rheum. 61(11), 1497–1504 (2009).
- Haslam Ke, Mccann Lj, Wyatt S, Wakefield Rj. The detection of subclinical synovitis by ultrasound in oligoarticular juvenile idiopathic arthritis: a pilot study. Rheumatology (Oxford) 49(1), 123–127 (2009).
- Frosch M, Foell D, Ganser G, Roth J. Arthrosonography of hip and knee joints in the follow up of juvenile rheumatoid arthritis. Annals Rheum. Dis. 62(3), 242–244 (2003).
- Sureda D, Quiroga S, Arnal C, Boronat M, Andreu J, Casas L. Juvenile rheumatoid arthritis of the knee: evaluation with US. Radiology 190(2), 403–406 (1994).
- Pascoli L, Wright S, Mcallister C, Rooney M. Prospective evaluation of clinical and ultrasound findings in ankle disease in juvenile idiopathic arthritis: importance of ankle ultrasound. J. Rheumatol. 37(11), 2409–2414 (2010).
- Naredo E, Cabero F, Cruz A, Uson J, Palop Mj, Crespo M. Ultrasound guided musculoskeletal injections. Annals Rheum. Dis. 64(2), 341; author reply 341 (2005).
- Terslev L, Torp-Pedersen S, Qvistgaard E, Danneskiold-Samsoe B, Bliddal H. Estimation of inflammation by Doppler ultrasound: quantitative changes after intra-articular treatment in rheumatoid arthritis. Annals Rheum. Dis. 62(11), 1049–1053 (2003).
- Scire Ca, Montecucco C, Codullo V, Epis O, Todoerti M, Caporali R. Ultrasonographic evaluation of joint involvement in early rheumatoid arthritis in clinical remission: power Doppler signal predicts short-term relapse. Rheumatology (Oxford) 48(9), 1092–1097 (2009).
- Rebollo-Polo M, Koujok K, Weisser C, Jurencak R, Bruns A, Roth J. Ultrasound findings on patients with juvenile idiopathic arthritis in clinical remission. Arthritis Care Res. (Hoboken) 63(7), 1013–1019 (2011).
- Laurell L, Court-Payen M, Nielsen S, Zak M, Boesen M, Fasth A. Ultrasonography and color Doppler in juvenile idiopathic arthritis: diagnosis and follow-up of ultrasound-guided steroid injection in the ankle region. A descriptive interventional study. Pediatr. Rheumatol. Online J. 9(1), 4 (2011).
- Breton S, Jousse-Joulin S, Cangemi C et al. Comparison of clinical and ultrasonographic evaluations for peripheral synovitis in juvenile idiopathic arthritis. Semin. Arthritis Rheum. 41(2), 272–278 (2011).
- Magni-Manzoni S, Epis O, Ravelli A et al. Comparison of clinical versus ultrasounddetermined synovitis in juvenile idiopathic arthritis. Arthritis Rheum. 61, 1497–1504 (2009).
- Muller Ls, Avenarius D, Damasio B et al. The paediatric wrist revisited: redefining MR findings in healthy children. Ann. Rheum. Dis. 70(4), 605–610 (2011).
- Pagnini I, Savelli S, Matucci-Cerinic M, Fonda C, Cimaz R, Simonini G. Early predictors of juvenile sacroiliitis in enthesitisrelated arthritis. J. Rheumatol. 37, 2395–2401 (2010).
- Malattia C, Damasio Mb, Magnaguagno F et al. Magnetic resonance imaging, ultrasonography, and conventional radiography in the assessment of bone erosions in juvenile idiopathic arthritis. Arthritis Rheum. 59, 1764–1772 (2008).
- El-Miedany Ym , Housny Ih, Mansour Hm, Mourad Hg, Mehanna Am, Megeed Ma. Ultrasound versus MRI in the evaluation of juvenile idiopathic arthritis of the knee. Joint Bone Spine 68(3), 222–230 (2001).
- Miller E, Uleryk E, Doria As. Evidence-based outcomes of studies addressing diagnostic accuracy of MRI of juvenile idiopathic arthritis. AJR 192(5), 1209–1218 (2009).
- Borrero Cg, Mountz Jm, Mountz Jd. Emerging MRI methods in rheumatoid arthritis. Nat. Rev. Rheumatol. 7(2), 85–95 (2011).
- Ostergaard M, Peterfy C, Conaghan P et al. OMERACT Rheumatoid Arthritis Magnetic Resonance Imaging Studies. Core set of MRI acquisitions, joint pathology definitions, and the OMERACT RA-MRI scoring system. J. Rheumatol. 30(6), 1385–1386 (2003).
- Malattia C, Damasio Mb, Pistorio A et al. Development and preliminary validation of a paediatric-targeted MRI scoring system for the assessment of disease activity and damage in juvenile idiopathic arthritis. Annals Rheum. Dis. 70(3), 440–446 (2011).
- Ostergaard M, Ejbjerg B. Magnetic resonance imaging of the synovium in rheumatoid arthritis. Semin. Musculoskelet. Radiol. 8(4), 287–299 (2004).
- Wakefield Rj, Gibbon Ww, Conaghan PG et al. The value of sonography in the detection of bone erosions in patients with rheumatoid arthritis: a comparison with conventional radiography. Arthritis Rheum. 43(12), 2762–2770 (2000).
- Gutierrez M, Filippucci E, Ruta S et al. Inter-observer reliability of high-resolution ultrasonography in the assessment of bone erosions in patients with rheumatoid arthritis: experience of an intensive dedicated training programme. Rheumatology (Oxford) 50(2), 373–380 (2011).
- Wittoek R, Jans L, Lambrecht V, Carron P, Verstraete K, Verbruggen G. Reliability and construct validity of ultrasonography of soft tissue and destructive changes in erosive osteoarthritis of the interphalangeal finger joints: a comparison with MRI. Ann. Rheum. Dis. 70(2), 278–283 (2011).
- Magni-Manzoni S, Rossi F, Pistorio A et al. Prognostic factors for radiographic progression, radiographic damage, and disability in juvenile idiopathic arthritis. Arthritis Rheum. 48(12), 3509–3517 (2003).
- Ostergaard M, Hansen M, Stoltenberg M et al. New radiographic bone erosions in the wrists of patients with rheumatoid arthritis are detectable with magnetic resonance imaging a median of two years earlier. Arthritis Rheum. 48(8), 2128–2131 (2003).
- Gylys-Morin Vm, Graham Tb, Blebea JS et al. Knee in early juvenile rheumatoid arthritis: MR imaging findings. Radiology 220(3), 696–706 (2001).
- Malattia C, Damasio Mb, Basso C et al. Dynamic contrast-enhanced magnetic resonance imaging in the assessment of disease activity in patients with juvenile idiopathic arthritis. Rheumatology (Oxford) 49(1), 178–185 (2010).
- Workie Dw, Dardzinski Bj, Graham Tb, Laor T, Bommer Wa, O’Brien Kj. Quantification of dynamic contrast-enhanced MR imaging of the knee in children with juvenile rheumatoid arthritis based on pharmacokinetic modeling. Magn. Reson. Imaging 22(9), 1201–1210 (2004).
- Konig H, Sieper J, Wolf Kj. Rheumatoid arthritis: evaluation of hypervascular and fibrous pannus with dynamic MR imaging enhanced with Gd-DTPA. Radiology 176(2), 473–477 (1990).
- Reiser Mf, Bongartz Gp, Erlemann R et al. Gadolinium-DTPA in rheumatoid arthritis and related diseases: first results with dynamic magnetic resonance imaging. Skelet. Radiol. 18(8), 591–597 (1989).
- Yamato M, Tamai K, Yamaguchi T, Ohno W. MRI of the knee in rheumatoid arthritis: Gd-DTPA perfusion dynamics. J. Comput. Assist. Tomograph. 17(5), 781–785 (1993).
- Graham Tb, Laor T, Dardzinski Bj. Quantitative magnetic resonance imaging of the hands and wrists of children with juvenile rheumatoid arthritis. J. Rheumatol. 32(9), 1811–1820 (2005).
- Argyropoulou Mi, Fanis Sl, Xenakis T, Efremidis Sc, Siamopoulou A. The role of MRI in the evaluation of hip joint disease in clinical subtypes of juvenile idiopathic arthritis. Br. J. Radiol. 75(891), 229–233 (2002).
- Workie Dw, Dardzinski Bj. Quantifying dynamic contrast-enhanced MRI of the knee in children with juvenile rheumatoid arthritis using an arterial input function (AIF) extracted from popliteal artery enhancement, and the effect of the choice of the AIF on the kinetic parameters. Magn. Reson. Med. 54(3), 560–568 (2005).
- Workie Dw, Graham Tb, Laor T et al. Quantitative MR characterization of disease activity in the knee in children with juvenile idiopathic arthritis: a longitudinal pilot study. Pediatr. Radiol. 37(6), 535–543 (2007).
- Dardzinski Bj, Laor T, Schmithorst Vj, Klosterman L, Graham Tb. Mapping T2 relaxation time in the pediatric knee: feasibility with a clinical 1.5-T MR imaging system. Radiology 225(1), 233–239 (2002).
- Kight Ac, Dardzinski Bj, Laor T, Graham Tb. Magnetic resonance imaging evaluation of the effects of juvenile rheumatoid arthritis on distal femoral weight-bearing cartilage. Arthritis Rheum. 50, 901–905 (2004).
- Dardzinski Bj, Mosher Tj, Li S, Van Slyke Ma, Smith Mb. Spatial variation of T2 in human articular cartilage. Radiology 205(2), 546–550 (1997).
- Mosher Tj, Dardzinski Bj. Cartilage MRI T2 relaxation time mapping: overview and applications. Semin. Musculoskelet. Radiol. 8(4), 355–368 (2004).
- Kight Ac, Dardzinski Bj, Laor T, Graham Tb. Magnetic resonance imaging evaluation of the effects of juvenile rheumatoid arthritis on distal femoral weight-bearing cartilage. Arthritis Rheum. 50(3), 901–905 (2004).
- Bashir A, Gray Ml, Boutin Rd, Burstein D. Glycosaminoglycan in articular cartilage: in vivo assessment with delayed Gd(DTPA) (2-)-enhanced MR imaging. Radiology 205(2), 551–558 (1997).
- Bashir A, Gray Ml, Burstein D. Gd-DTPA2- as a measure of cartilage degradation. Magn. Reson. Med. 36(5), 665–673 (1996).
- Regatte Rr, Akella Sv, Wheaton Aj, Borthakur A, Kneeland Jb, Reddy R. T1rho-relaxation mapping of human femoral-tibial cartilage in vivo. J. Magn. Reson. Imaging 18(3), 336–341 (2003).
- Brown R. A brief account of microscopical observations made on the particles contained in the pollen of plants. The Philosophical Magazine 4, 161–173 (1828).
- Einstein A. Investigations on the theory of the brownian movement. Annalen Der Physik 322(8), 549–560 (1905).
- Basser Pj. Inferring microstructural features and the physiological state of tissues from diffusion-weighted images. NMR Biomed. 8(7–8), 333–344 (1995).
- Basser Pj, Pajevic S, Pierpaoli C, Duda J, Aldroubi A. In vivo fiber tractography using DT-MRI data. Magn. Reson. Med. 44(4), 625–632 (2000).
- Miller Kl, Hargreaves Ba, Gold Ge, Pauly Jm. Steady-state diffusion-weighted imaging of in vivo knee cartilage. Magn. Reson. Med. 51(2), 394–398 (2004).
- Agarwal V, Kumar M, Singh Jk, Rathore Rk, Misra R, Gupta Rk. Diffusion tensor anisotropy magnetic resonance imaging: a new tool to assess synovial inflammation. Rheumatology (Oxford) 48(4), 378–382 (2009).
- Friedrich Km, Mamisch Tc, Plank C et al. Diffusion-weighted imaging for the follow-up of patients after matrix-associated autologous chondrocyte transplantation. Eur. J. Radiol. 73(3), 622–628 (2010).
- Perman Wh, Turski Pa, Houston Lw, Glover Gh, Hayes Ce. Methodology of in vivo human sodium MR imaging at 1.5 T. Radiology 160(3), 811–820 (1986).
- Reddy R, Insko Ek, Noyszewski Ea, Dandora R, Kneeland Jb, Leigh Js. Sodium MRI of human articular cartilage in vivo. Magn. Reson. Med. 39(5), 697–701 (1998).
- Shapiro Em, Borthakur A, Gougoutas A, Reddy R. 23Na MRI accurately measures fixed charge density in articular cartilage. Magn. Reson. Med. 47(2), 284–291 (2002).
- Madelin G, Lee Js, Inati S, Jerschow A, Regatte Rr. Sodium inversion recovery MRI of the knee joint in vivo at 7T. J. Magn. Reson. Imaging 207(1), 42–52 (2011).
- Trattnig S, Welsch Gh, Juras V et al. 23Na MR imaging at 7 T after knee matrixassociated autologous chondrocyte transplantation preliminary results. Radiology 257(1), 175–184 (2011).
- Wang L, Wu Y, Chang G et al. Rapid isotropic 3D-sodium MRI of the knee joint in vivo at 7T. J. Magn. Reson. Imaging 30(3), 606–614 (2009).
- Shapiro L, Staroswiecki E, Gold G. Magnetic resonance imaging of the knee: optimizing 3 Tesla imaging. Semin. Roentgenol. 45(4), 238–249 (2010).
- Chavhan Gb, Babyn Ps. Pediatric musculoskeletal imaging at 3 Tesla. Semin. Musculoskelet. Radiol. 13(3), 181–195 (2009).
- Amrami Kk, Felmlee Jp. 3-Tesla imaging of the wrist and hand: techniques and applications. Semin. Musculoskelet. Radiol. 12(3), 223–237 (2008).
- Stanisz Gj, Odrobina Ee, Pun J et al. T1, T2 relaxation and magnetization transfer in tissue at 3T. Magn. Reson. Med. 54(3), 507–512 (2005).
- Magnevist® injection, package insert. Bayer Healthcare Pharmaceuticals, Inc., Wayne, NJ, USA.
- Friedrich Km, Chang G, Vieira Rl et al. In vivo 7.0-tesla magnetic resonance imaging of the wrist and hand: technical aspects and applications. Semin. Musculoskelet. Radiol. 13(1), 74–84 (2009).
- Staroswiecki E, Bangerter Nk, Gurney Pt, Grafendorfer T, Gold Ge, Hargreaves Ba. In vivo sodium imaging of human patellar cartilage with a 3D cones sequence at 3 T and 7 T. J. Magn. Reson. Imaging 32(2), 446–451 (2010).
- Ntziachristos V, Bremer C, Weissleder R. Fluorescence imaging with near-infrared light: new technological advances that enable in vivo molecular imaging. Euro. Radiol. 13, 195–208 (2003).
- Peterson Jd, Labranche Tp, Vasquez KO et al. Optical tomographic imaging discrim inates between disease-modifying anti-rheumatic drug (DMARD) and non-DMARD efficacy in collagen antibody-induced arthritis. Arthritis Res. Ther. 12, R105 (2010).
- Meier R, Krug C, Golovko D et al. Indocyanine green-enhanced imaging of antigen-induced arthritis with an integrated optical imaging/radiography system. Arthritis Rheum. 62, 2322–2327 (2010).
- Biswal S, Resnick Dl, Hoffman Jm, Gambhir Ss. Molecular imaging: integration of molecular imaging into the musculoskeletal imaging practice. Radiology 244, 651–671 (2007).
- Pysz Ma, Gambhir Ss, Willmann Jk. Molecular imaging: current status and emerging strategies. Clinical Radiol. 65, 500–516 (2010).
- Bremer C, Ntziachristos V, Weissleder R. Optical-based molecular imaging: contrast agents and potential medical applications. Euro. Radiol. 13, 231–243 (2003).
- Bremer C, Werner S, Langer HE. assessing activity of rheumatic arthritis with fluorescence optical imaging. Euro. Musculoskelet. Rev. 4, 96–100 (2009).
- Gompels Ll, Lim Nh, Vincent T, Paleolog Em. In vivo optical imaging in arthritis – an enlightening future? Rheumatology (Oxford) 49, 1436–1446 (2010).
- Mcdonald Dm, Choyke Pl. Imaging of angiogenesis: from microscope to clinic. Nat. Med. 9, 713-725 (2003).


