Review Article - Imaging in Medicine (2013) Volume 5, Issue 1
Myocardial perfusion imaging with PET
Ryo Nakazato1, Daniel S Berman1,2, Erick Alexanderson3,4 & Piotr Slomka*1,21Departments of Imaging & Medicine, & Cedars-Sinai Heart Institute, Cedars-Sinai Medical Center, Los Angeles, CA, USA
2David Geffen School of Medicine, University of California Los Angeles, Los Angeles, CA, USA
3Cardiovascular Imaging & Nuclear Cardiology Department, Instituto Nacional de Cardiología ‘Ignacio Chávez’, Mexico City, Mexico
4Facultad de Medicina, Universidad Nacional Autónoma de México, Mexico City, Mexico
- Corresponding Author:
- Piotr Slomka
Departments of Imaging & Medicine, & Cedars-Sinai Heart Institute
Cedars-Sinai Medical Center, Los Angeles, CA, USA
Tel: +1 310 423 4348
E-mail: piotr.slomka@cshs.org
Abstract
Keywords
3D ▪ attenuation correction ▪ myocardial blood flow ▪ myocardial flow reserve ▪ myocardial perfusion ▪ quantification
Noninvasive cardiac imaging is often performed for the assessment of coronary anatomy, myocardial perfusion and left ventricular function in patients with known or suspected coronary artery disease (CAD). The results of these tests are used for patient risk stratification, evaluation of myocardial ischemia as a cause of symptoms and assessment of ongoing disease management. PET-myocardial perfusion imaging (MPI) allows accurate measurement of myocardial hypoperfusion and function at stress and rest, as well as assessment of the absolute myocardial blood flow (MBF) in the same study. This article reviews the latest techniques and clinical applications of PET-MPI, including the MBF quantification.
The basics of PET imaging
PET imaging is based on the coincidence detection of photons emitted from the decay of radiolabeled tracers introduced into the body to map a particular physiological process. PET imaging can produce 3D images of radionuclide distribution in the body. PET imaging can produce 3D images of radionuclide distribution in the body and uses positron emitting radiotracers. Subsequent annihilation of the positron (by a collision with a free electron) results in the production of two 511-keV γ-rays emitted in opposite directions (approximately at 180° to each other). These annihilation γ-rays are detected in coincidence at opposite sides of the PET detector ring (Figure 1). A PET scanner consists of several stationary 360° detector rings allowing simultaneous detection of coincidence events in all directions (3D) or in each plane (2D). In cardiac PET imaging, the entire region around the heart is covered in the scanner field-of-view. Standalone PET scanners use the rotating rod for acquiring attenuation correction data while the most current PET scanners are configured for hybrid PET/CT imaging and use a CT component for the attenuation correction scan.

Figure 1: Principle of coincident photon detection by a PET scanner. Annihilation g-rays are detected in coincidence at opposite sides of the PET detector ring.
Myocardial perfusion can be measured in 3D by mapping the distribution of the radiopharmaceutical at stress and rest. Absolute concentration of radiotracer in the heart MBq/ml can be dynamically mapped in 3D, allowing imaging of the first-pass activity as it distributes in the myocardium. Subsequent high quality 3D images of perfusion are typically collected over 2–10 min, depending on the type of isotope. In hybrid PET/CT scanners, a PET scan is combined with the fast CT scan delineating anatomical structures surrounding the heart [1]. The CT scan is subsequently used for photon attenuation and scatter correction of PET data, allowing accurate depiction of perfusion in the myocardium.
PET tracers
Although several myocardial perfusion PET tracers are available, the most widely used in clinical practice are rubidium-82 (82Rb) and nitrogen-13-ammonia (13N-ammonia).
Rubidium-82
82Rb is a potassium analog that is a generator product with a physical half-life of 76 s and kinetic properties similar to those of Thallium-201 (201Tl) in SPECT. Owing to the distinct advantage of not requiring an on-site cyclotron, 82Rb is the most widely used radionuclide for assessment of myocardial perfusion with PET in the USA.
Nitrogen-13-ammonia
13N-ammonia is a cyclotron product and has a physical half-life of 9.96 min. After injection, 13N-ammonia rapidly disappears from the circulation after its cell-trapping conversion to glutamine, permitting the acquisition of images of excellent quality. Although the sequestration of 13N-ammonia in the lungs is usually minimal, it may be increased in patients with depressed left ventricular systolic function or chronic pulmonary disease and, occasionally, in smokers. This may, in turn, adversely affect the quality of the images. In these cases, it may be necessary to increase the time between injection and image acquisition to optimize the contrast between myocardial and background activity. However, this delay may complicate the measurement of quantitative myocardial perfusion, which requires rapid sequential imaging of the first pass arterial input and myocardial uptake in the same imaging session. 13N-ammonia allows high-resolution imaging and exhibits favorable extraction characteristics, but its use is limited to the sites with an on-site cyclotron.
Oxygen-15-water
Theoretically, the oxygen-15-water (15O-water) radiotracer is ideal for quantitative flow measurements by PET for two reasons: it diffuses freely across the myocyte membranes and the tissue retention of 15O-water uptake is not affected by metabolic factors. However, the noisy low-count images make 15O-water unusable for routine diagnostic clinical imaging, which is why clinical PET laboratories do not typically use this tracer [2]. In addition, unlike 82Rb or 13N-ammonia, 15O-water is neither an approved tracer nor reimbursed for clinical imaging in the USA.
Fluorine-18-flurpiridaz
A new PET myocardial perfusion tracer fluorine- 18-flurpiridaz (18F-flurpiridaz) has recently been introduced. Owing to its smaller kinetic positron energy and consequently short positron range, an 18F-tagged agent can take the full advantage of PET spatial resolution.18F-flurpiridaz has a relatively long physical half-life of 110 min as compared with currently available tracers, and therefore does not require cyclotron on-site. However, the half-life of this tracer may be too long for rapid sequential stress–rest imaging due to the residual activity, and will require a delay between stress and rest acquisition and/or the use of different doses for stress and rest. Phase I and II clinical studies have been completed with 18F-flurpiridaz [3,4], and Phase III studies are currently ongoing [5]. In a Phase II trial, PET MPI with 18F-flurpiridaz was safe and superior to SPECT MPI for image quality, interpretative certainty and overall CAD diagnosis [3].
As compared with SPECT images in the same patients, 18F-f lurpiridaz PET images demonstrated better defect contrast [3,5]. Promising results have been obtained for the measurement of absolute MBF and myocardial flow reserve [6,7]. Preliminary data suggested that absolute MBF may be measured in humans using 18F-flurpiridaz [8].
Table 1 summarizes the features of PET-MPI tracers. Figure 2 illustrates approximately the myocardial extraction as a function of the blood flow for different PET perfusion tracers [9–11]. Preliminary validation of 18F-flurpiridaz myocardial retention with microspheres was reported and it is similar to 13N-ammonia [12]. While the literature documents differences in extraction with flow between 13N-ammonia and 82Rb, the flow models appropriate for each of those tracers account for the extraction differences, such that comparable flow measurements are obtained with both tracers.
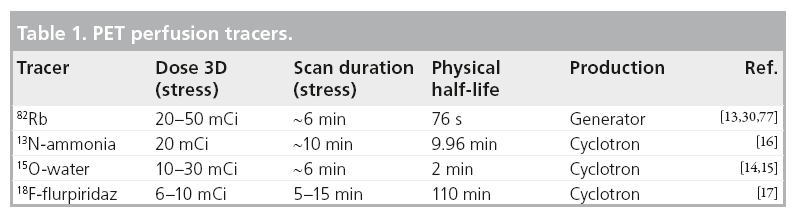

Figure 2: Radiotracer first-pass extraction for 15O-water, 13N-ammonia and 82Rb. The graph represents estimates of the pharmacokinetic relationship between net uptake (K1) and myocardial blood flow for each tracer [78]. 15O-water has demonstrated a linear function suggesting a directly proportional model [79]. 82Rb [9] and 13N-ammonia [10] exhibit nonlinear characteristics.
Clinical protocols
In general, a PET stress–rest study can be performed in a shorter time than a SPECT study due to the shorter half-life of radiotracers. A stress–rest myocardial stress–rest perfusion study with 82Rb and CT attenuation correction can be completed in 30 min [13]. A typical 82Rb protocol could be as follows: after a topogram acquisition used for patient positioning, a CT transmission scan is acquired [13]. Subsequently, the patient is injected with 25–50 mCi of 82Rb at rest. A 6-min rest imaging acquisition is simultaneously initiated with the start of the rest 82Rb infusion. Immediately after completion of rest imaging, a second stress CT transmission scan is performed. Pharmacologic stress is most commonly performed by adenosine or regadenoson infusion. A total of 2 min after the adenosine infusion, 25–50 mCi of 82Rb is administered using a separate intravenous line in the other arm. A 6-min stress imaging acquisition is simultaneously initiated with the start of the rest 82Rb infusion. Rest and stress CT transmission scans are typically acquired at endexpiration breath-hold, and patients are instructed to breathe normally during the PET acquisition [13]. The 15O-water tracer has a similarly short decay time and a similar protocol is followed with 10–30 mCi of 15O-water injected in order to measure the activity for each stress and rest scan and activity is measured for 5–6 min [14,15].
A 13N-ammonia protocol requires a waiting period for 13N-ammonia decay between the stress and rest scans, but can be completed within 80 min as follows [16]: after a topogram acquisition used for patient positioning, a CT transmission scan is acquired. Subsequently, patients are injected with 20 mCi of 13N-ammonia at rest. A 10-min rest imaging acquisition starts a few seconds before the rest 13N-ammonia injection. A total of 30 min later, after completion of rest imaging, a second stress CT transmission scan is acquired. Pharmacologic stress is typically performed by adenosine or regadenoson infusion. A total of 3 min after the adenosine infusion, 20 mCi of 13N-ammonia is administered using a separate intravenous line in the other arm. Stress image acquisition starts a few seconds before the stress 13N-ammonia injection [16].
Example protocols for 82Rb, 15O-water and 13N-ammonia are shown in Figure 3. Although finalized protocols for 18F-f lurpiridaz MPI have not yet been established, imaging for 18F-flurpiridaz in humans was reported with rest perfusion images acquired immediately upon infusion of 2.3–4.5 mCi of 18F-flurpiridaz with a 30-min interval between rest and stress for adenosine and a 60-min interval for exercise stress and stress-injected dose of 6.4–9.6 mCi [17].

Figure 3: Examples of cardiac PET imaging protocols with 82Rb or
13N-ammonia and 15O-water.
†CTAC map acquisition.
CTAC: CT-based attenuation correction; Pharm: Pharmacologic.
Attenuation correction
A key strength of PET, as compared with SPECT, is the routine availability of accurate attenuation correction (AC). Unlike in SPECT, AC is mandatory for PET-MPI due to coincidence effect amplifying the effect of attenuation. AC has traditionally been performed with transmission sources on standalone PET scanners. In PET/CT, the AC maps are derived from noncontrast nongated CT images, which can be rapidly acquired (within a few seconds) and repeated for rest and stress perfusion studies to ensure perfect alignment with PET scan. Almost all new PET scanner models are currently sold in the hybrid PET/CT configuration, in which the CT-based AC has replaced the traditional transmission CT-based AC technique. CT-based AC for PET studies has proven challenging for myocardial perfusion imaging owing to the effects of possible respiratory and cardiac motion in general [18–20]. However, respiratory gating has not yet been routinely deployed and clinical PET centers do not currently use it in clinical cardiac PET imaging protocols. It has been shown that there are significant differences between traditional transmission CT-based AC and CT-based AC applied to cardiac PET/CT studies, which may remain after alignment of CT maps to emission data [20,21]. Although this problem is not yet fully resolved, careful visual verification of alignment usually ensures that these artifacts are minimized. New methods for automatic registration of CT and PET maps are also proposed to reduce these artifacts [22].
Latest equipment
Recent PET/CT scanners from all vendors operate in 3D coincidence detection mode without interplane septa. In this mode, all coincident photon pairs are detected. The principal advantage of the 3D mode is a significantly higher photon sensitivity (fourto six-times) compared with traditional 2D mode, at the expense of a higher scatter fraction [23]. Importantly, the technical limitations of quantitative 3D PET perfusion imaging are still substantial due to possible scanner saturation with standard bolus doses of radionuclides. In some cases, quantitative PET may require low-dose slow infusion of radionuclide to avoid scanner saturation during first-past arterial activity. For some equipment, it has been reported that the useful counts or activity for adequate diagnostic imaging are lower with 3D imaging [24]. However, it has been reported that MBF measurements obtained in 3D PET are comparable with 2D PET imaging in the canine model [25].
These limitations are currently being addressed by the vendors. Specifically for cardiac applications, 3D PET scanners have been recently optimized to cope with high count levels in first-pass 82Rb imaging for MBF measurements [26] and with additional 82Rb γ-prompt decays affecting 3D imaging [27]. Although 3D 82Rb acquisitions were previously compared with the 2D 82Rb acquisitions for the standalone scanners [28], the image statistics and image reconstructions applied are significantly different [29]. Recently, two studies assessing diagnostic performance of PET/CT scanners for detection of obstructive CAD using the 3D mode have been reported and demonstrated high diagnostic accuracy [13,30]. It should be noted that the invasive coronary angiography was used as the gold standard for the presence of obstructive CAD in these studies and not as a standard for CAD severity.
Further technical advances relevant to PET perfusion imaging include the new highdefinition iterative reconstruction techniques based on scanner-specific 3D modeling of system resolution with effective tomographic resolution as low as 2 mm [31]. Preliminary application of these improved PET reconstruction methods for cardiac imaging have been reported [32]. Further image quality improvements have been proposed [33] by combining new reconstruction with cardiac motion-frozen techniques to reduce blurring due to cardiac motion [34]. These techniques require ECG-gated images where the statistical content of each gated image is substantially reduced; however, the overall image perfusion statistics are preserved as the counts are added after spatial alignment. Clinical validation of these techniques have been performed in SPECT but not yet in PET [35].
Radiation dose considerations
Although the initial application of the new 3D PET/CT technology was in the field of oncology, the 3D acquisition and new software methods offer a potential for dose reduction in cardiac imaging, beyond already low radiation levels. New PET systems registering the photon events in the list mode allow reconstruction of both relative myocardial perfusion and absolute MBF data from the same scan. Due to the increased sensitivity of 3D PET, it is possible to obtain high-quality 82Rb perfusion images at doses as low as 20 mCi [30,36]. In the study by Kaster et al., a weight-based low-dose 82Rb 0.12 mCi/lb was used [30]. In this study, a custom elution system was used for delivery of a 30-s constant activity rate infusion allowing consistent count rates and image contrast between patients [37]. The estimated patient radiation doses have recently been revised down to 3.7 mSv for 82Rb PET scans obtained on a standard 2D scanner with 80 mCi total injected dose (stress plus rest) by more precise patient-specific calculations [38]. Therefore, the effective radiation dose of stress–rest 82Rb scans obtained in the 3D mode could be further reduced to approximately 1.85 mSv (<1 mSv for stress scan). Similarly, the doses for the other cardiac PET tracers are very low. For example, the radiation dose from a single 3D PET perfusion study is 0.8 mSv for 15O-water and 1 mSv for 13N-ammonia [39]. From the preliminary reports, the injected dose of 18F-flurpridaz is 2.91 ± 0.70 mCi at rest, 6.76 ± 1.78 mCi at stress when for pharmacological stress and 1.93 ± 0.37 mCi at rest, 6.48 ± 1.23 mCi stress for exercise stress [3]. The mean effective radiation dose to the patients from these injections is estimated to be approximately 6.4 and 4.8 mSv for the pharmacological and exercise stress–rest protocols, respectively [3].
Relative quantification of perfusion
MPI with dedicated PET and integrated PET/ CT provides a highly accurate evaluation for detection of obstructive CAD [13,40–42]. Overall, in the previous reports of PET-MPI diagnostic performance, the average sensitivity for detecting at least one coronary artery with ≥50% stenosis was 89% (range: 83–100%), whereas the average specificity was 89% (range: 73–100%) [43]. The majority of previous results were obtained with standalone 2D PET scanners rather than with integrated PET/CT systems and with visual scoring of perfusion defects in 17-segment model analogous to SPECT perfusion scoring. Limited data exist regarding the diagnostic accuracy of PET/CT-MPI [43]. To date, three studies analyze 82Rb PET/CT diagnostic performance with quantitative methods (Figure 4). High diagnostic performance (i.e., sensitivity and specificity) is demonstrated by three different software implementations for 2D [42] and 3D PET imaging [13,30]. Kaster et al. achieved 100% sensitivity for detection of obstructive CAD when transient ischemic dilation results were also considered [30]. Note that due to different characteristics of perfusion for different tracers, for example reduced isotope concentration in the lateral wall for the 13N-ammonia imaging [44], software for the relative analysis of relative PET perfusion requires isotope-specific normal limits. Examples of perfusion images and quantification results for the 82Rb and 13N-ammonia are shown in Figures 5 & 6.


Figure 5: Abnormal 82Rb PET images and quantitative polar maps from a
patient with 90% proximal left anterior descending artery stenosis. A
reversible perfusion defect is seen in the anterior, septal and apical walls on both
the images (A) and the polar maps (B). Stress and ischemic (reversible) TPD were
both 15%.
HLA: Horizontal long axis; SA: Short axis; TPD: Total perfusion deficit; VLA: Vertical
long axis.
Reproduced with permission from [13].

Figure 6: Abnormal 13N-ammonia PET images and quantitative polar maps from a patient with 90% right coronary artery stenosis. A reversible perfusion defect is seen in the inferior wall both on the images (A) and the polar maps (B). Stress and ischemic (reversible) TPD were 9 and 6%, respectively. HLA: Horizontal long axis; SA: Short axis; TPD: Total perfusion deficit; VLA: Vertical long axis.
Flow quantification
With standard list-mode acquisition offered by modern PET/CT scanners, dynamic firstpass perfusion images can be obtained with a single injection of the radiopharmaceutical and without additional imaging time or radiation to the patient. Dynamic imaging is essential for the assessment of absolute MBF. To obtain MBF values, image-derived time–activity curves from the arterial blood and myocardial tissue regions are used as input to a tracer kinetic model (Figure 7). The kinetic model describes the exchange of tracer between the blood and the tissue over time. The rate of uptake of the tracer into the myocardial tissue provides an estimate of MBF on an absolute scale of ml/min/g. This technique also allows the calculation of the myocardial flow reserve (MFR), which is defined as the ratio of MBF at peak hyperemia to resting MBF. Automated image analysis tools are required for reliable and robust clinical use of dynamic data for MBF quantification [26]. These clinical tools combine advances in the automated detection of the myocardium with established kinetic modeling techniques, and allow rapid and automated analysis of dynamic scans. An example of the output from the MBF quantification program is shown in Figure 8.

Figure 7: Myocardial blood flow assessment. For 82Rb and 13N-ammonia a simplified one-tissue compartment model can be applied to compute myocardial blood flow. The rate of exchange of a tracer from the arterial blood into the myocardial tissue compartment, K1, is related to myocardial blood flow in ml/min/g as a function of the extraction fraction (see Figure 2). The tracer clearance rate from the myocardium is described by k2. K1: Net tracer uptake; k2: Washout.

Figure 8: Example of the software output for the dynamic 82Rb quantification in a 66-year-old male who had 90% stenosis on invasive coronary angiography in the left anterior descending artery. First-pass images curves and polar maps with abnormal stress MBF (1.72 ml/min/g), and decreased MFR (1.53) in the left anterior descending artery territory are shown. MBF: Myocardial blood flow; MFR: Myocardial flow reserve.
Different modeling tools for calculation of MBF and MFR have been developed by several groups [45–49], employing different methods of segmenting and sampling of the myocardial and blood-pool activity to obtain input curves. Nevertheless, the agreement in absolute values of MBF and MFR between these tools is relatively high. In one study, three existing clinical implementations of the kinetic modeling packages for the computation of regional stress and rest flow and MFR for 13N-ammonia with one- and two-tissue compartment models were compared with each other, demonstrating excellent agreement in flow and flow reserve for each vascular territory [45]. Similarly, flow and flow reserve obtained with 82Rb tracers demonstrated very good agreement in a comparison between different software programs for the routine kinetic quantification of data from multiple sites, scanners and protocols [49].
MBF analysis may potentially be able to identify multivessel disease and predict the extent of ischemia more accurately than relative perfusion imaging [2,50]. The ability to quantify absolute MBF with stress PET-MPI permits identification of patients in whom the relative regional distribution of tracer may appear normal owing to a balanced reduction of blood flow [51,52]. A study using 13N-ammonia PET (n = 27) demonstrated that absolute quantification of stress MBF is superior to the measurement of relative tracer uptake (quantified manually) for identification of hemodynamically significant CAD [53]. In a preliminary study with a small population (n = 12), it was reported that there is additional diagnostic information by MBF quantification over the relative perfusion visual assessment using 82Rb PET [54]. Another report demonstrated that the quantification of MFR in 13N-ammonia PET/CT-MPI provides added diagnostic value for detection of CAD over visual analysis of relative MPI [55]. However, further investigation is warranted since other studies by quantitative analysis of relative PET images alone demonstrate very high sensitivity and accuracy (Figure 4) [13,30,42].
Nevertheless, without knowing coronary anatomy, the MFR should be interpreted with caution as reduced MFR may originate from microvascular and/or epicardial stenosis. Owing to the relatively low specificity of abnormal MBF reserve, the interpretation of MBF reserve with PET needs to be placed in the proper clinical context with the underlying coronary anatomy and cardiovascular risk factors.
Prognostically, MFR demonstrated value as an additional marker for adverse cardiac events [56–59]. Herzog et al. [56] and Ziadi et al. [58] have evaluated the prognostic value of MFR measured by 13N-ammonia and 82Rb PET, respectively, in more than 900 patients referred for assessment of ischemia, including patients with and without known CAD. In patients with normal and abnormal relative 82Rb PET perfusion, subgroups with reduced MFR had a worse prognosis than their normal 82Rb MFR counterparts; and MFR on 82Rb PET was an independent predictor of hard events (hazard ratio [HR]: 3.3; 95% CI: 1.1–9.5; p < 0.029) and major cardiac events (HR: 2.4; 95% CI: 1.4–4.4; p < 0.003) after adjusting for relative MPI and other confounding variables. Although the studies were retrospective, the quantitative results were not reported to clinicians and, therefore, did not influence therapeutic decisions.
Abnormal stress flow or MFR can also have important implications for risk stratification of patients with normal MPI. Normal MPI scan predicts low risk of major cardiac events [60]. However, abnormal stress MBF or MFR can identify an important subset of individuals with normal MPI by relative analysis, but adverse prognosis related to extensive epicardial CAD [48,52,53] or subclinical CAD and microvascular dysfunction [61]. In such patients, the presence of abnormal stress MBF or MFR as well as traditional high-risk imaging parameters including ischemic ECG changes, transient ischemic dilatation and reduced ejection fraction response during stress can serve as important indicators for either noninvasive or invasive coronary angiography to exclude severe obstructive CAD. Alternatively, coronary calcium score can be used to predict low likelihood of obstructive CAD, at least in patients without typical symptoms [62–64]. Even in the absence of obstructive epicardial disease, unexpectedly low MFR can predict increased risk of cardiac events and, therefore, indicate to the clinician to consider aggressive therapy for possible risk factors of CAD [61].
Although absolute quantification of myocardial perfusion has great clinical potential, there are several limitations that need to be recognized. The knowledge of the optimal cutoff values for absolute perfusion needs to be studied in large populations and for various tracers. Furthermore, additional information is needed regarding expected flow and flow reserve values in different subpopulations, such as diabetic and obese patients, patients with heart failure and revascularized patients.
Combined PET/CT angiography functional/anatomical imaging
Up to 20% of patients with an intermediate pretest likelihood of CAD who undergo coronary CT angiography (CTA) may need nuclear testing to provide functional information to guide management [65]. PET/CT scanners are often integrated with high-resolution multislice CT state-of-the-art scanners; therefore, it is possible to combine coronary CTA anatomical imaging and coronary calcium scoring with PET imaging in one scanning session. A recent study reported combined physiologic and anatomic imaging with a hybrid stress-only PET/CTA technique [48]. In 104 patients, the hybrid technique had a higher positive predictive value for detection of CAD than either technique alone (81% for CT, 86% for PET and 100% for the hybrid technique) and a similarly higher specificity (87, 91 and 100%, respectively). The mean radiation dose in most of the patients was 9.3 mSv when prospective triggering was used, and this value was comparable with a mean estimated radiation dose of 7 mSv for invasive angiography. It is thought that the 3D fusion approach with PET/CT for functional and anatomical imaging may allow an accurate assignment of epicardial lesions to the subtended ischemic myocardial territory [66–70]. Note that this approach has been used to date only by a few highly experienced institutions and is not accepted as a clinical routine. In the multimodality scanning protocols with the hybrid PET/CT scanner, PET and CTA scans are not truly simultaneous and are acquired with differing breathing protocols, resulting in significant misalignments of the images from the two modalities. Subsequently, cardiac PET and coronary CT angiography images cannot be accurately fused by hardware registration alone, and may require software correction for truly integrated displays of coronary anatomy and myocardial perfusion [71].
PET versus SPECT
Compared with SPECT-MPI, PET-MPI has several distinct advantages. PET has improved image quality as compared with SPECT, due to the improved count statistics, robust attenuation and scatter correction, as well as better tracer characteristics. PET has demonstrated higher diagnostic accuracy for detection of CAD than SPECT [72]. A recent meta-analysis reported that 82Rb PET is more accurate for the detection of obstructive CAD than SPECT [73]. In one study comparing gated 82Rb PET and technetium-99m sestamibi SPECT images, a smaller number of PET scans were considered ‘equivocal’ [72]. Furthermore, since stress images can be obtained immediately after infusion of a vasodilator, the results of a stress-gated PET represent peak stress wall motion unlike in SPECT where stress images are acquired up to 45 min after stress. Although vasodilator stressgated images are not equivalent to exercise-gated images, investigators have found that the failure to demonstrate an increased ejection fraction on stress-gated PET images compared with rest images is strongly associated with the presence of extensive CAD [41]. This ejection fraction reserve has been shown to be prognostically significant [74]. In addition, routine AC and fast imaging allows absolute quantification of activity that is not easily possible in SPECT. Finally, compared with SPECT, PET perfusion stress/rest imaging can be performed with much lower doses (typically <4 mSv, including AC scan), especially on new 3D PET/CT scanners [75].
Nevertheless, advances in SPECT imaging hardware and software such as new cadmium zinc telluride cameras and iterative reconstruction with resolution recovery are improving SPECT imaging. As a result, shorter acquisition times and/or lower tracer doses produce higher quality SPECT images than before [75,76]. To date, direct comparisons of new SPECT technology and PET imaging have not been performed.
Conclusion
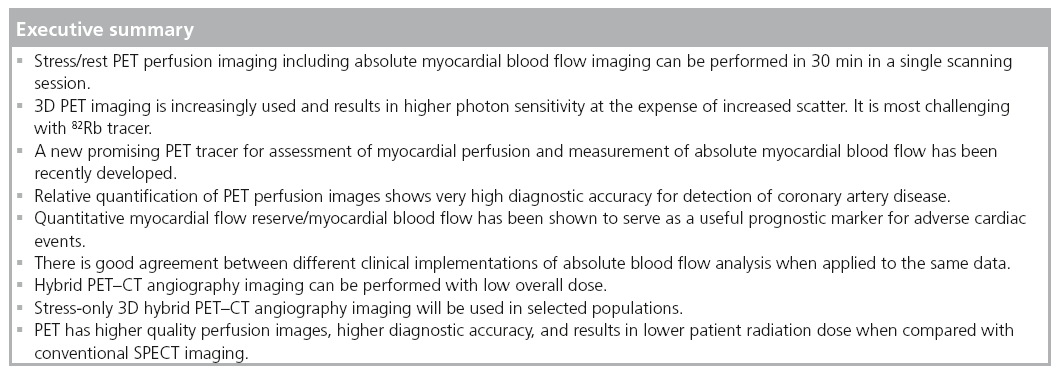
Stress/rest PET perfusion imaging, including absolute MBF imaging, can be performed in 30 min in a single scanning session with modern PET/CT equipment. Relative quantification of PET perfusion images shows very high diagnostic accuracy for detection of CAD and quantitative MFR/MBF has been shown to serve as a useful prognostic marker for adverse cardiac events. There is good agreement between different clinical implementations of absolute blood flow analysis when applied to the same data. Hybrid PET–CTA imaging can be performed on PET/CT scanners with a low overall dose. When compared with SPECT, PET has higher quality perfusion images, higher diagnostic accuracy and results in lower patient radiation dose.
Future perspective
Quantitative diagnostic and prognostic evaluation of relative myocardial perfusion and absolute blood flow will be used as a clinical routine. Further reduction of radiation dose will be archived (<2 mSv) and stress-only protocols will be routinely used for specific populations (such as people with no known CAD). New myocardial perfusion tracers beyond 13N-ammonia and 82Rb, such as 18F-flurpiridaz, will be available. AC issue will finally be resolved with fully automated coregistration. Obtaining coronary calcium scan and AC from one CT scan will be possible. Stress-only 3D hybrid PET–CTA imaging will be used in subgroups of patients.
Acknowledgement
The authors would like to thank A Oganyan for editing and proofreading the manuscript.
Disclaimer
The contents of this article are solely the responsibility of the authors and do not necessarily represent the official views of the National Heart, Lung and Blood Institute.
Financial & competing interests disclosure
This article was supported in part by grant R01HL089765 from the National Heart, Lung and Blood Institute/NIH. Cedars-Sinai Medical Center receives royalties for the quantitative assessment of function, perfusion and viability, a portion of which is distributed to some of the authors of this manuscript (D Berman and P Slomka). The authors have no other relevant affiliations or financial involvement with any organization or entity with a financial interest in or financial conflict with the subject matter or materials discussed in the manuscript apart from those disclosed.
No writing assistance was utilized in the production of this manuscript.
References
- Koepfli P, Hany TF, Wyss CA et al. CT attenuation correction for myocardial perfusion quantification using a PET/CT hybrid scanner. J. Nucl. Med. 45(4), 537–542 (2004).
- Knuuti J, Kajander S, Mäki M, Ukkonen H. Quantification of myocardial blood flow will reform the detection of CAD. J. Nucl. Cardiol. 16(4), 497–506 (2009).
- Berman DS, Maddahi J, Tamarappoo BK et al. Phase II safety and clinical comparison with single-photon emission computed tomography myocardial perfusion imaging for detection of coronary artery disease: flurpiridaz F 18 positron emission tomography. J. Am. Coll. Cardiol. pii: S0735–S1097(12), 05659–05668 (2012).
- Maddahi J, Czernin J, Lazewatsky J et al. Phase I, first-in-human study of BMS747158, a novel F-18-labeled tracer for myocardial perfusion PET: dosimetry, biodistribution, safety and imaging characteristics after a single injection at rest. J. Nucl. Med. 52(9), 1490–1498 (2011).
- Maddahi J. Properties of an ideal PET perfusion tracer: new PET tracer cases and data. J. Nucl. Cardiol. 19(Suppl. 1), S30–S37 (2012).
- Nekolla SG, Reder S, Saraste A et al. Evaluation of the novel myocardial perfusion positron-emission tomography tracer 18F-BMS-747158–02: comparison to 13N-ammonia and validation with microspheres in a pig model. Circulation 119(17), 2333–2342 (2009).
- Huisman MC, Higuchi T, Reder S et al. Initial characterization of an 18F-labeled myocardial perfusion tracer. J. Nucl. Med. 49(4), 630–636 (2008).
- Maddahi J, Huang S, Truong D et al. Preliminary results of absolute quantification of rest and stress myocardial blood flow with flurpiridaz F-18 PET in normal and coronary artery disease patients in a single-center study. J. Nucl. Cardiol. 17, Abstract 743 (2010).
- Goldstein RA, Mullani NA, Marani SK, Fisher DJ, Gould KL, O’Brien HA. Myocardial perfusion with rubidium-82. II. Effects of metabolic and pharmacologic interventions. J. Nucl. Med. 24(10), 907–915 (1983).
- Schelbert HR, Phelps ME, Huang SC et al. N-13 ammonia as an indicator of myocardial blood flow. Circulation 63(6), 1259–1272 (1981).
- Lortie M, Beanlands RS, Yoshinaga K, Klein R, Dasilva JN, Dekemp RA. Quantification of myocardial blood flow with 82Rb dynamic PET imaging. Eur. J. Nucl. Med. Mol. Imaging 34(11), 1765–1774 (2007).
- Sherif HM, Nekolla SG, Saraste A et al. Simplified quantification of myocardial flow reserve with flurpiridaz F 18: validation with microspheres in a pig model. J. Nucl. Med. 52(4), 617–624 (2011).
- Nakazato R, Berman DS, Dey D et al. Automated quantitative Rb-82 3D PET/CT myocardial perfusion imaging: normal limits and correlation with invasive coronary angiography. J. Nucl. Cardiol. 19(2), 265–276 (2012).
- Kajander SA, Joutsiniemi E, Saraste M et al. Clinical value of absolute quantification of myocardial perfusion with (15)O-water in coronary artery disease. Circ. Cardiovasc. Imaging 4(6), 678–684 (2011).
- Lubberink M, Harms HJ, Halbmeijer R, De Haan S, Knaapen P, Lammertsma AA. Lowdose quantitative myocardial blood flow imaging using 15O-water and PET without attenuation correction. J. Nucl. Med. 51(4), 575–580 (2010).
- Rosas EA, Slomka PJ, García-Rojas L et al. Functional impact of coronary stenosis observed on coronary computed tomography angiography: comparison with 13N-ammonia PET. Arch. Med. Res. 41(8), 642–648 (2010).
- Woo J, Tamarappoo B, Dey D et al. Automatic 3D registration of dynamic stress and rest (82)Rb and flurpiridaz F 18 myocardial perfusion PET data for patient motion detection and correction. Med. Phys. 38(11), 6313–6326 (2011).
- Pan T, Mawlawi O, Nehmeh SA et al. Attenuation correction of PET images with respiration-averaged CT images in PET/CT. J. Nucl. Med. 46(9), 1481–1487 (2005).
- Bacharach SL. PET/CT attenuation correction: breathing lessons. J. Nucl. Med. 48(5), 677–679 (2007).
- Gould KL, Pan T, Loghin C, Johnson NP, Guha A, Sdringola S. Frequent diagnostic errors in cardiac PET/CT due to misregistration of CT attenuation and emission PET images: a definitive analysis of causes, consequences, and corrections. J. Nucl. Med. 48(7), 1112–1121 (2007).
- Slomka PJ, Le Meunier L, Hayes SW et al. Comparison of myocardial perfusion 82Rb PET performed with CT- and transmission CT-based attenuation correction. J. Nucl. Med. 49(12), 1992–1998 (2008).
- Nordberg P, Declerck J, Brady M. Pre-reconstruction rigid body registration for positron emission tomography: an initial validation against ground truth. Conf. Proc. IEEE Eng. Med. Biol. Soc. 2010, 5612–5615 (2010).
- Knešaurek K, Machac J, Krynyckyi BR, Almeida OD. Comparison of 2-dimensional and 3-dimensional 82Rb myocardial perfusion PET imaging. J. Nucl. Med. 44(8), 1350–1356 (2003).
- Macdonald LR, Schmitz RE, Alessio AM et al. Measured count-rate performance of the Discovery STE PET/CT scanner in 2D, 3D and partial collimation acquisition modes. Phys. Med. Biol. 53(14), 3723–3738 (2008).
- Lekx KS, Dekemp RA, Beanlands RS et al. 3D versus 2D dynamic 82Rb myocardial blood flow imaging in a canine model of stunned and infarcted myocardium. Nucl. Med. Commun. 31(1), 75–81 (2010).
- Klein R, Beanlands R, Dekemp R. Quantification of myocardial blood flow and flow reserve: technical aspects. J. Nucl. Cardiol. 17(4), 555–570 (2010).
- Esteves F, Nye J, Khan A et al. Promptgamma compensation in Rb-82 myocardial perfusion 3D PET/CT. J. Nucl. Cardiol. 17(2), 247–253 (2010).
- Knesaurek K, Machac J, Krynyckyi BR, Almeida OD. Comparison of 2-dimensional and 3-dimensional 82Rb myocardial perfusion PET imaging. J. Nucl. Med. 44(8), 1350–1356 (2003).
- Votaw JR, White M. Comparison of 2-dimensional and 3-dimensional cardiac 82Rb PET studies. J. Nucl. Med. 42(5), 701–706 (2001).
- Kaster T, Mylonas I, Renaud JM, Wells GA, Beanlands RS, Dekemp RA. Accuracy of low-dose rubidium-82 myocardial perfusion imaging for detection of coronary artery disease using 3D PET and normal database interpretation. J. Nucl. Cardiol. 19(6), 1135–1145 (2012).
- Panin VY, Kehren F, Michel C, Casey M. Fully 3-D PET reconstruction with system matrix derived from point source measurements. IEEE Trans. Med. Imaging 25(7), 907–921 (2006).
- Le Meunier L, Slomka P, Dey D et al. Enhanced definition PET for cardiac imaging. J. Nucl. Cardiol. 17(3), 414–426 (2010).
- Le Meunier L, Slomka PJ, Dey D et al. Motion frozen (18)F-FDG cardiac PET. J. Nucl. Cardiol. 18(2), 259–266 (2011).
- Slomka PJ, Nishina H, Berman DS et al. ‘Motion-frozen’ display and quantification of myocardial perfusion. J. Nucl. Med. 45(7), 1128–1134 (2004).
- Suzuki Y, Slomka P, Wolak A et al. Motionfrozen myocardial perfusion SPECT improves detection of coronary artery disease in obese patients. J. Nucl. Med. 49(7), 1075–1079 (2008).
- Schwaiger M, Ziegler SI, Nekolla SG. PET/ CT challenge for the non-invasive diagnosis of coronary artery disease. Eur. J. Radiol. 73(3), 494–503 (2010).
- Klein R, Adler A, Beanlands RS, Dekemp RA. Precision-controlled elution of a 82Sr/82Rb generator for cardiac perfusion imaging with positron emission tomography. Phys. Med. Biol. 52(3), 659–673 (2007).
- Senthamizhchelvan S, Bravo PE, Esaias C et al. Human biodistribution and radiation dosimetry of 82Rb. J. Nucl. Med. 51(10), 1592–1599 (2010).
- Knuuti J. Integrated positron emission tomography/computed tomography (PET/ CT) in coronary disease. Heart 95(17), 1457–1463 (2009).
- Sampson UK, Dorbala S, Limaye A, Kwong R, Di Carli MF. Diagnostic accuracy of rubidium-82 myocardial perfusion imaging with hybrid positron emission tomography/ computed tomography in the detection of coronary artery disease. J. Am. Coll. Cardiol. 49(10), 1052–1058 (2007).
- Dorbala S, Vangala D, Sampson U, Limaye A, Kwong R, Di Carli MF. Value of vasodilator left ventricular ejection fraction reserve in evaluating the magnitude of myocardium at risk and the extent of angiographic coronary artery disease: a 82Rb PET/CT study. J. Nucl. Med. 48(3), 349–358 (2007).
- Santana CA, Folks RD, Garcia EV et al. Quantitative (82)Rb PET/CT: development and validation of myocardial perfusion database. J. Nucl. Med. 48(7), 1122–1128 (2007).
- Beanlands RS, Chow BJ, Dick A et al. CCS/ CAR/CANM/CNCS/CanSCMR joint position statement on advanced noninvasive cardiac imaging using positron emission tomography, magnetic resonance imaging and multidetector computed tomographic angiography in the diagnosis and evaluation of ischemic heart disease – executive summary. Can. J. Cardiol. 23(2), 107–119 (2007).
- Klingensmith WC, Noonan C, Goldberg JH, Buchwald D, Kimball JT, Manson SM. Decreased perfusion in the lateral wall of the left ventricle in PET/CT studies with 13N-ammonia: evaluation in healthy adults. J. Nucl. Med. Technol. 37(4), 215–219 (2009).
- Slomka PJ, Alexanderson E, Jácome R et al. Comparison of clinical tools for measurements of regional stress and rest myocardial blood flow assessed with 13N-ammonia PET/CT. J. Nucl. Med. 53(2), 171–181 (2012).
- Klein R, Renaud JM, Ziadi MC et al. Intraand inter-operator repeatability of myocardial blood flow and myocardial flow reserve measurements using rubidium-82 PET and a highly automated analysis program. J. Nucl. Cardiol. 17(4), 600–616 (2010).
- El Fakhri G, Kardan A, Sitek A et al. Reproducibility and accuracy of quantitative myocardial blood flow assessment with (82) Rb PET: comparison with (13)N-ammonia PET. J. Nucl. Med. 50(7), 1062–1071 (2009).
- Kajander S, Joutsiniemi E, Saraste M et al. Cardiac positron emission tomography/ computed tomography imaging accurately detects anatomically and functionally significant coronary artery disease. Circulation 122(6), 603–613 (2010).
- Dekemp RA, Slomka PJ, Dederck J et al. Reproducible imaging of myocardial flow reserve with rubidium-82 PET – a multicentre multi-vendor comparison study. Eur. Heart J. Suppl. 13(Suppl. A), A76 (2011).
- Beanlands RS, Ziadi MC, Williams K. Quantification of myocardial flow reserve using positron emission imaging the journey to clinical use. J. Am. Coll. Cardiol. 54(2), 157–159 (2009).
- Parkash R, Dekemp RA, Ruddy TD et al. Potential utility of rubidium 82 PET quantification in patients with 3-vessel coronary artery disease. J. Nucl. Cardiol. 11(4), 440–449 (2004).
- Ziadi MC, Dekemp RA, Williams K et al. Does quantification of myocardial flow reserve using rubidium-82 positron emission tomography facilitate detection of multivessel coronary artery disease? J. Nucl. Cardiol. 19(4), 670–680 (2012).
- Hajjiri MM, Leavitt MB, Zheng H, Spooner AE, Fischman AJ, Gewirtz H. Comparison of positron emission tomography measurement of adenosine-stimulated absolute myocardial blood flow versus relative myocardial tracer content for physiological assessment of coronary artery stenosis severity and location. JACC Cardiovasc. Imaging 2(6), 751–758 (2009).
- Yoshinaga K, Katoh C, Manabe O et al. Incremental diagnostic value of regional myocardial blood flow quantification over relative perfusion imaging with generatorproduced rubidium-82 PET. Circ. J. 75(11), 2628–2634 (2011).
- Fiechter M, Ghadri JR, Gebhard C et al. Diagnostic value of 13N-ammonia myocardial perfusion PET: added value of myocardial flow reserve. J. Nucl. Med. 53(8), 1230–1234 (2012).
- Herzog BA, Husmann L, Valenta I et al. Long-term prognostic value of 13N-ammonia myocardial perfusion positron emission tomography added value of coronary flow reserve. J. Am. Coll. Cardiol. 54(2), 150–156 (2009).
- Fukushima K, Javadi MS, Higuchi T et al. Prediction of short-term cardiovascular events using quantification of global myocardial flow reserve in patients referred for clinical 82Rb PET perfusion imaging. J. Nucl. Med. 52(5), 726–732 (2011).
- Ziadi MC, Dekemp RA, Williams KA et al. Impaired myocardial flow reserve on rubidium-82 positron emission tomography imaging predicts adverse outcomes in patients assessed for myocardial ischemia. J. Am. Coll. Cardiol. 58(7), 740–748 (2011).
- Murthy VL, Naya M, Foster CR et al. Improved cardiac risk assessment with noninvasive measures of coronary flow reserve. Circulation 124(20), 2215–2224 (2011).
- Hachamovitch R, Berman D, Shaw L et al. Incremental prognostic value of myocardial perfusion single photon emission computed tomography for the prediction of cardiac death: differential stratification for risk of cardiac death and myocardial infarction. Circulation 97(6), 535–543 (1998).
- Schindler TH, Schelbert HR, Quercioli A, Dilsizian V. Cardiac PET imaging for the detection and monitoring of coronary artery disease and microvascular health. JACC Cardiovasc. Imaging 3(6), 623–640 (2010).
- Greenland P, Bonow RO, Brundage BH et al. ACCF/AHA 2007 clinical expert consensus document on coronary artery calcium scoring by computed tomography in global cardiovascular risk assessment and in evaluation of patients with chest pain: a report of the American College of Cardiology Foundation Clinical Expert Consensus Task Force (ACCF/AHA Writing Committee to Update the 2000 Expert Consensus Document on Electron Beam Computed Tomography) developed in collaboration with the Society of Atherosclerosis Imaging and Prevention and the Society of Cardiovascular Computed Tomography. J. Am. Coll. Cardiol. 49(3), 378–402 (2007).
- Schepis T, Gaemperli O, Koepfli P et al. Added value of coronary artery calcium score as an adjunct to gated SPECT for the evaluation of coronary artery disease in an intermediate-risk population. J. Nucl. Med. 48(9), 1424–1430 (2007).
- Schenker MP, Dorbala S, Hong EC et al. Interrelation of coronary calcification, myocardial ischemia, and outcomes in patients with intermediate likelihood of coronary artery disease: a combined positron emission tomography/computed tomography study. Circulation 117(13), 1693–1700 (2008).
- Slomka PJ, Berman DS, Germano G. Applications and software techniques for integrated cardiac multimodality imaging. Exp. Rev. Cardiovasc. Ther. 6(1), 27–41 (2008).
- Gaemperli O, Bengel FM, Kaufmann PA. Cardiac hybrid imaging. Eur. Heart J. 32(17), 2100–2108 (2011).
- Flotats A, Knuuti J, Gutberlet M et al. Hybrid cardiac imaging: SPECT/CT and PET/CT. A joint position statement by the European Association of Nuclear Medicine (EANM), the European Society of Cardiac Radiology (ESCR) and the European Council of Nuclear Cardiology (ECNC). Eur. J. Nucl. Med. Mol. Imaging 38(1), 201–212 (2011).
- Danad I, Raijmakers PG, Appelman YE et al. Hybrid imaging using quantitative H215O PET and CT-based coronary angiography for the detection of coronary artery disease. J. Nucl. Med. 54, 55–63 (2013).
- Namdar M, Hany TF, Koepfli P et al. Integrated PET/CT for the assessment of coronary artery disease: a feasibility study. J. Nucl. Med. 46(6), 930–935 (2005).
- Plass A, Emmert MY, Gaemperli O et al. The potential value of hybrid positron emission tomography/dual-source computed tomography imaging in coronary bypass surgery. Heart Surg. Forum 14(5), E283–E290 (2011).
- Nakazato R, Dey D, Alexánderson E et al. Automatic alignment of myocardial perfusion PET and 64-slice coronary CT angiography on hybrid PET/CT. J. Nucl. Cardiol. 19(3), 482–491 (2012).
- Bateman TM, Heller GV, Mcghie AI et al. Diagnostic accuracy of rest/stress ECG-gated Rb-82 myocardial perfusion PET: comparison with ECG-gated Tc-99m sestamibi SPECT. J. Nucl. Cardiol. 13(1), 24–33 (2006).
- McArdle BA, Dowsley TF, Dekemp RA, Wells GA, Beanlands RS. Does rubidium-82 PET have superior accuracy to SPECT perfusion imaging for the diagnosis of obstructive coronary disease? A systematic review and meta-analysis. J. Am. Coll. Cardiol. 60(18), 1828–1837 (2012).
- Dorbala S, Hachamovitch R, Curillova Z et al. Incremental prognostic value of gated Rb-82 positron emission tomography myocardial perfusion imaging over clinical variables and rest LVEF. JACC Cardiovasc. Imaging 2(7), 846–854 (2009).
- Slomka PJ, Dey D, Duvall WL, Henzlova MJ, Berman DS, Germano G. Advances in nuclear cardiac instrumentation with a view towards reduced radiation exposure. Curr. Cardiol. Rep. 14(2), 208–216 (2012).
- Garcia EV. Physical attributes, limitations, and future potential for PET and SPECT. J. Nucl. Cardiol. 19(Suppl. 1), S19–S29 (2012).
- Schwaiger M, Ziegler SI, Nekolla SG. PET/ CT challenge for the non-invasive diagnosis of coronary artery disease. Eur. J. Radiol. 73(3), 494–503 (2010).
- Saraste A, Kajander S, Han C, Nesterov SV, Knuuti J. PET: is myocardial flow quantification a clinical reality? J. Nucl. Cardiol. 19(5), 1044–1059 (2012).
- Ukkonen H, Knuuti J, Katoh C et al. Use of [11C]acetate and [15O]O2 PET for the assessment of myocardial oxygen utilization in patients with chronic myocardial infarction. Eur. J. Nucl. Med. 28(3), 334–339 (2001).
• • Describes new PET myocardial perfusion tracer 18F-flurpiridaz.
• First report of diagnostic accuracy for the automated quantitative 82Rb 3D PET/CT myocardial perfusion imaging in the detection of obstructive coronary artery disease.
• Describes cardiac hybrid PET/CT imaging that combines anatomy and function.
• • Describes prognostic value of myocardial flow reserve quantification using 82Rb PET beyond relative myocardial perfusion imaging.
• • First report showing the addition of myocardial flow reserve to clinical variables and PET parameters resulted in improvement of reclassification.
• Systemic review and meta-analysis of 82Rb PET in comparison to SPECT.
• • Summary of recent technical myocardial perfusion imaging advances and the potential role of developments in radiation dose reduction.


