Review Article - Imaging in Medicine (2012) Volume 4, Issue 6
MRI assessment of neonatal brain maturation
Nadine J Girard*1,2, Philippe Dory-Lautrec1, Mériam Koob3,4 & Anca Melania Dediu11Department of Neuroradiology, APHM, Hopital Timone, 264 rue Saint Pierre, 13285, Marseille Cedex 5, France
2Université Aix Marseille, UMR CNRS 7339, 13001, Marseille, France
3Department of Radiology 2, Hopitaux Universitaires de Strasbourg, 67098, Strasbourg, France
4Université de Strasbourg, UMR CNRS 7237, 67098, Strasbourg, France
- Corresponding Author:
- Nadine J Girard
Department of Neuroradiology
APHM, Hopital Timone, 264 rue Saint Pierre
13285, Marseille Cedex 5, France
Tel: +33 491 386 525
Fax: +33 491 386 833
E-mail: nadine.girard@ap-hm.fr
Abstract
MRI is currently the method of choice to evaluate brain maturation. MRI provides improved anatomical details and accurate depiction of the morphological and signal changes of normal brain development and its disorders. It also gives insight into the microstructure of brain tissue and into mechanisms of injury through diffusion-weighted imaging and diffusion-tensor imaging, and into the brain’s biochemical composition through proton MR spectroscopy. Computational automated techniques are emerging that help to generate a 3D fetal atlas by motion-corrected high resolution images, to more precisely identify volumetric brain growth, cortical folding over gestational age and white matter organization. Validations by clinical studies are still needed, especially in applying the computational methods in the different groups of pathology encountered in the pre- and neo-natal periods.
Keywords
brain ▪ diffusion MRI ▪ fetus ▪ human development ▪ infant ▪ MRI ▪ MR spectroscopy ▪ newborn
Brain maturation begins in the second trimester and continues progressively to reach an adult-like pattern at approximately 2 years of age. Consequently, different windows of brain vulnerability and different diseases are encountered in infants and neonates compared with older children and adults. Although ultrasonography and CT can show the changes in brain morphology, these techniques are insensitive to myelination, which is one of the most important events occurring during brain maturation. MRI is currently the method of choice to evaluate brain maturation. Owing to improvements in neonatal intensive care, indications of brain MRI in neonates have spread widely in the past 10 years. Moreover, highly premature neonates are also receiving brain MRI. However, MRI is most commonly performed at term-equivalent age to look for white matter damage that is not indicated on the ultrasound scan rather than in the first 2-week period after birth for medical decisionmaking. Although an ultrasonography scan is still a rapid imaging method to assess the neonatal brain, MRI provides improved anatomical details and identifies the cortex and subarachnoid spaces that are not affected by calvaria, in contrast to ultrasonography. MRI also provides an accurate depiction of the morphological and signal changes of normal brain development and of its disorders. It gives insight into mechanisms of injury through diffusion-weighted imaging and diffusion tensor imaging (DTI), as well as the microstructure of brain tissue, and biochemical composition through proton MR spectroscopy.
MR sequences to assess brain maturation
In neonates and young infants, the standard MRI protocol consists of axial and coronal T2-weighted images (WIs), sagittal and axial gradient echo T1-WI, axial diffusion or diffusion tensor images, and proton spectroscopy [1,2]. T1-WIs are generally acquired using gradient echo images, spin echo images or inversion recovery images. Gradient echo and inversion recovery T1-WIs allow excellent gray–white matter differentiation, especially in infants less than 6 months of age. T2-WIs can be acquired using spin echo, fast-spin echo or turbo-spin echo techniques. Fast-spin echo and turbo-spin echo images show myelin maturation at an earlier age than spin echo images due to increased magnetization-transfer effects [3], and are obtained in a shorter acquisition time. Heavily T2-weighted sequences are used in infants less than 12 months of age to compensate for the long T1 values due to the increased cerebral water content [4]. Although fluid-attenuated inversion recovery sequences are considered highly efficient in assessing the white matter, these images demonstrate a paradoxical signal pattern through infancy. In neonates the white matter is of low signal intensity as on T1-WI, then of high signal intensity in infants and young children, and reaches the mature aspect of low signal intensity, as on T2-WI at approximately 4–5 years of age. Alternatives for T1 and T2-WIs consist of 3D T1 and T2 images whenever possible. Proton spectroscopy pulse sequences can be acquired by mono- or multi-voxel techniques. Owing to its robustness, the point resolved spectroscopy sequence is commonly used, with short (30–35 ms) and long echo times (145 ms) [5]. Monovoxel techniques are preferred in both the pre- and post-natal period for spectroscopy in a clinical setting. Indeed, chemical shift imaging (CSI) [6], also named MR spectroscopic imaging, while able to provide metabolic information from a slice or a volume with identification of spatial repartition of metabolites, is still technically difficult to acquire (especially due to contaminations), process and interpret (especially because a spatial processing is necessary with the spectral processing), and is extremely sensitive to movement [7]. Moreover, the shape of the voxel is more complicated and the sequence is longer compared with the monovoxel technique. Another disadvantage of CSI is that the experiment cannot be stopped (i.e., due to movement or clinical instability) because all the lines, columns and slices of the CSI are needed to acquire spectra. Recently, 3D CSI acquisitions with automatic postprocessing have been developed to improve reproducibility in the assessment of longitudinal follow-up of patients [8]. Diffusion images show the changing microstructure of the developing brain. Echo planar diffusion images are routinely and easily performed in the neonate with an acquisition time of 1–1.5 min [1,2]. Sensitization gradients are applied following the three axes (x, y and z). Generated images consist of trace images and maps of apparent diffusion coefficient (ADC). Diffusion images are also obtained by DTI. Diffusion of water in the white matter becomes more restricted and gains anisotropy, which is based on structural orientation. Such information is obtained with measurements made after diffusion gradients have been applied in multiple directions (at least six non-collinear) [1,2]. Acquisition time of this type of sequence is from 3 to 4 min with six directions; 5–6 min with 12 directions; and even longer with 20–60 directions, provided the pixel size is isotropic. Shorter acquisition times can be obtained with nonisotropic pixels. The images generated include trace images, and ADC, fractional anisotropy (FA) and color-coded orientation maps. This technique shows the white matter parcellation assessed by tractography, which permits monitoring of FA and ADC in a specific tract. However, owing to low FA in neonates, postprocessing of the tractography tool has to be changed compared with the mature brain.
In utero, MRI protocol includes T2-WI obtained in the three anatomical planes relative to the fetal head with half-Fourier acquisition single shot turbo spin-echo (HASTE) and true fast imaging with steady-state precession (TRUE FISP) images, at least one plane with T1-WI, diffusion WI in the axial plane by using the standard sequence with three b values or DTI [9,10]. Sedating the mother is sometimes necessary in order to obtain a complete evaluation of the brain, as in the neonatal period, including T1-WIs, which require longer sequences than T2-WI. Sedation is obtained by maternal premedication with flunitrazepam administered orally 15 min to 1 h before the MR examination. Images are generally obtained through anterior (body)- and posterior (spinal)-phased array coils to achieve a high enough signal-to-noise ratio. Consequently, high-resolution MRI (e.g., 3D T1-weighted acquisition with 1-mm thick contiguous sections) is not available in utero in comparison with the neonatal period. By contrast, 3D T2-weighted sequence (TRUE FISP sequence) may be performed and are helpful in evaluating the midline anatomy, as well as the cortical sulcation. Regarding T1-WI, gradient echo images are preferred because of the excellent differentiation between the cortical ribbon, white matter and ventricular walls in contrast to spin-echo images. Images obtained from HASTE sequence are true T2-WIs with low susceptibility weighting and sequential slice capability, resulting in a very high contrast of the multilayered appearance of the developing brain. TRUE FISP are not as clear as HASTE images but are sensitive to susceptibility. The pulse sequence used in utero to obtain diffusion images is similar to that used in the postnatal period with three b-values and ADC map. DTI is also performed in utero and is extremely challenging due to the many sources of errors and artifacts [11]. The authors routinely use a sequence with 12 or 30 directions and isotropic images of 2.2 mm with an acceptable acquisition time of 5 and 7 min, respectively. Spectroscopy may be performed when the mother and fetus are not moving. In contrast to the postnatal period, the number of acquisitions is increased to get enough signals in the spectra, leading to an acquisition time of 6 to 7 min for each sequence with short and long echo-time; this is three- to four-fold longer compared with acquisition times obtained in neonates. However, shorter acquisition times are available with higher field strength (3T) and spectra of good resolution (Figure 1).

Figure 1: In utero spectroscopy. Spectra obtained with short echo time at 3T (A) and 1.5T (B) in two different fetuses at a gestational age of 34 weeks. Note the better resolution of the spectrum at 3T obtained in shorter acquisition time compared with 1.5T.
Other advanced MRI techniques that have been performed may contribute to clinical assessment of brain maturation in the future. These techniques include magnetization transfer [12,13], quantitative T2 measurement [14], functional connectivity mapping [15–17] and multiparametric mapping of myelin water fraction [18].
What is brain maturation?
Brain maturation follows cerebral morphogenesis, which takes place during the embryonal period (from 0 to 8 weeks of gestation) and consists roughly of three steps: histogenesis of the cortex and development of commissures from 7 to 23 weeks of gestation; cortical morphogenesis and white matter development from 20 to 40 weeks of gestation; and brain myelination from 18 weeks of gestation to adolescence and beyond [19]. This section will focus on events occurring from 18 weeks and beyond that are responsible for MRI changes, because MRI is performed in vivo for clinical purpose from 18 weeks onwards.
Brain maturation consists of changes in brain morphology and brain composition. Changes in brain morphology include an increase in brain volume, changes in surface configuration due to the developing sulcation, changes in ventricular shape and a decrease in volume of the subarachnoid spaces, which are mostly seen during the fetal period and arewell identified by fetal brain MRI. From midgestation through to infancy brain growth reflects changes in brain composition. This includes neuronal differentiation and synapse formation (synaptogenesis; axonal and collateral formation, dendritic arborization and spine formation, and organization of the six layers of the cortex); glial cell differentiation and formation of myelin; programmed cell death; neurotransmitter development; and vascular development. Gliogenesis and myelination are the primary events responsible for changes in MR signal [1,4,20–26].
■ Changes in morphology
Sulcation
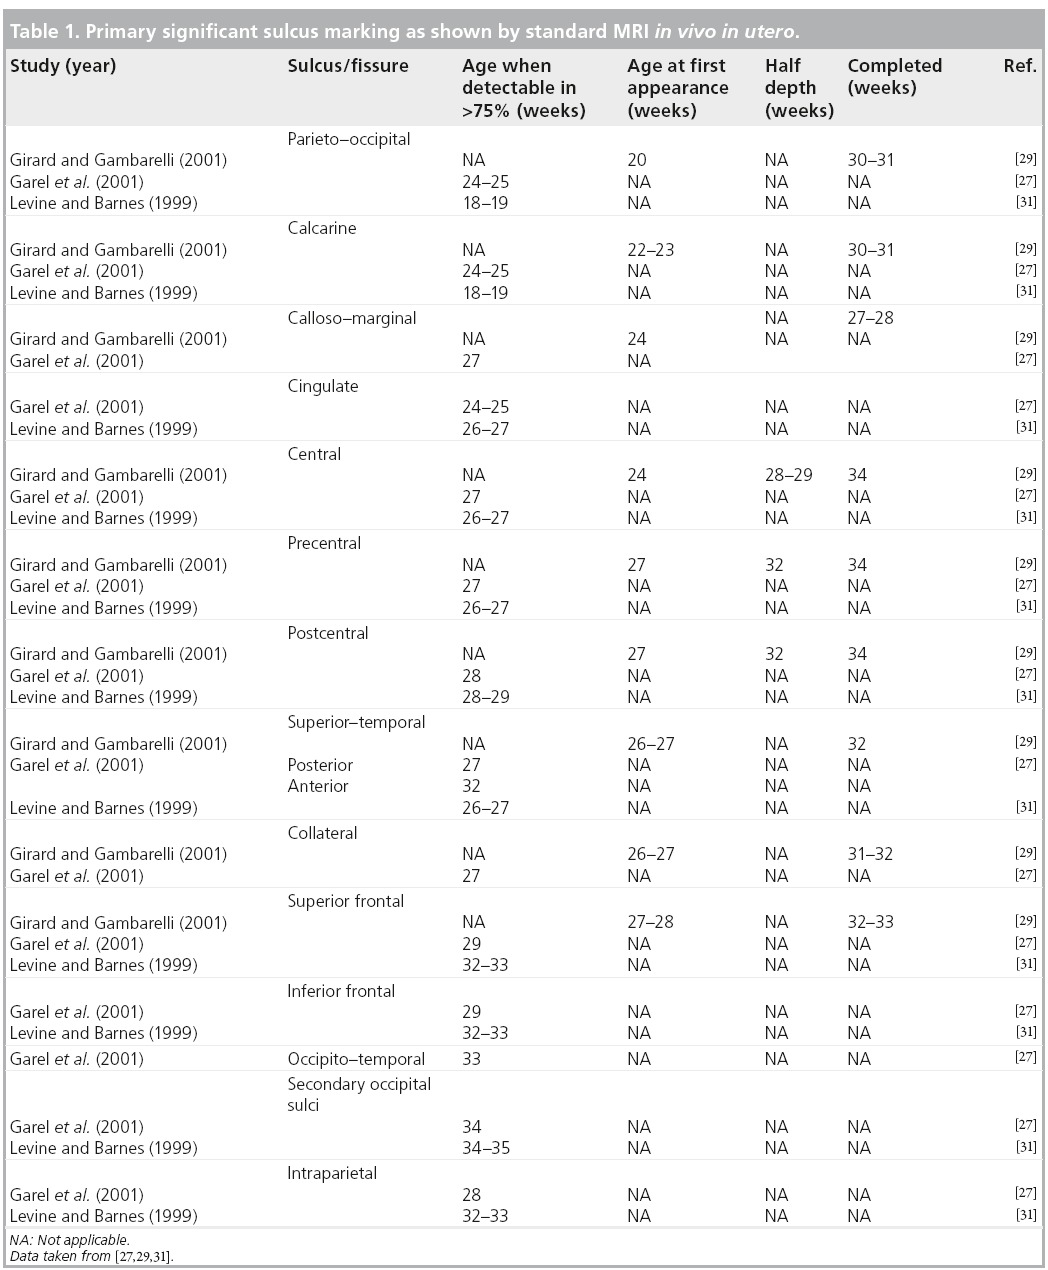
It is known that the gyri appear in a regular sequence, with acceleration of sulcation occurring after 30 weeks [27–30]. Primary sulci form first, followed by more complex secondary and tertiary sulci. Brain gyration is well identified by conventional sequences [31], with a dramatic change from an agyric brain to a convoluted pattern happening between 20 and 35 weeks (Figure 2).

Figure 2: Sagittal views (half-Fourier single shot turbo spin-echo images) from 21 to 36 weeks in different fetuses. Note the dramatic changes from an agyric brain to a convoluted pattern at 36 weeks. Also note the low signal of the medulla, posterior pons and the mesencephalon.
The more significant landmarks [27,28,32], which show time delay on MRI compared with histology [20], are summarized in Table 1. Gyration displays a near definitive shape by week 35 with regards to primary and secondary sulci, becoming complex after birth. The sylvian fissure, although seen early at weeks 18–20, is the last to show it’s achieved shape that depends upon the development of the frontal and temporal operculum. Therefore, an open insula can be considered as a marker of different clinical conditions, such as prematurity, aminoacidopathies and abnormal cortical development. The formation of sulci is not symmetrical between the two hemispheres with regards to shape and timing [29]. This pattern is still identified after birth and in infants, especially in the perisylvian regions [33,34].
In the posterior fossa, the subdivisions of the cerebellum appear with first the posterolateral or flocculonodular fissure at week 9, then at week 12, the primary fissure separating the anterior and posterior lobes of the cerebellum. With MRI, the primary fissure, the posterolateral fissure and the superior posterior fissure are identified at 20 weeks. The cerebellar vermis covers the fourth ventricle by 20 weeks of gestation. The prepyramidal– prebiventer sulcus and the secondary and horizontal fissures are identified at 22 weeks. Although the convoluted pattern of the cerebellum is seen from 30 weeks onwards and always identified beyond 33 weeks, the cerebellar surface appears quite smooth until 31–32 weeks [31,35]. The shape of the brainstem is characteristic and seen early at 20 weeks with the typical anterior bulging of the pons that is an important anatomical landmark in the assessment of posterior fossa [36]. Indeed, the majority of hereditary cerebellar atrophy does not end in significant pontine flattening, except for pontocerebellar hypoplasias and disorder of glycosylation, such as congenital disorders of glycosylation 1a, which are of prenatal onset [37]. Similarly, cerebellar disruptions of prenatal onset can display pontine hypoplasia (or atrophy). The diameter of the cerebellar hemispheres has been measured by fetal MRI and increases during gestation [38].
Although MRI shows the developing gyrif ication, motion correction may be necessary, especially to avoid maternal sedation. Motion-corrected high resolution images helps to generate a 3D fetal atlas [39–42]. Software based on segmentation are emerging and are necessary to more precisely identify volumetric brain growth, and cortical folding over gestational age (GA) [43]. These software are able to show the changes in shape and depth of sulci (Figure 3) [44–46], to extract cortical surface, white and gray matter, ventricles and germinal matrix [39]. These types of atlas are obtained after 3D reconstructions from T2 WI and application of curvature index, and are still part of research protocols. The identification of cortical folding through automated computational techniques will help in the future to detect abnormalities of brain development at an early stage; especially malformations of cortical development, at an early stage (Figure 4). Although several genes are associated with gyration abnormalities, the mechanisms responsible for normal gyration are still not understood. Indeed, the appearance of sulci and gyri coincides with three major attributes of fetal developmental events. First, the developmental presence of the subplate, which is essential for thalamocortical and long and short cortico–cortical fiber growth; second, the exponential cortical surface growth; and finally, the differentiation of the future cortex [47]. The formation of sulci may be the consequence of cortical growth, of differential growth between the inner and outer strata of the cortex and of mechanical phenomena caused by the differential tension exerted by white matter fibers on the cerebral cortex [48,49]. Sulcal roots corresponding to the first dimples appearing on the cortical surface, which are constant and form early [46], also play an important role in understanding the variability of the cortical folding [50–52].

Figure 3: 3D reconstructions after application of a curvature index in different fetuses across the prenatal period. The insula, the central sulcus and other primary sulci are becoming deeper with regards to gestational age. Courtesy of I de Macedo Santos, F De Guio, F Rousseau, D Rivière and JF Mangin.

Figure 4: Polymicrogyria at 25 weeks. (A) Axial T2 half-Fourier single shot turbo spin-echo and (B, top row) 3D reconstructions with curvature index compared with (B, bottom row) the normal appearance (26 weeks). The surface of the brain is disorganized with abnormal depth and orientation of the insula. Abnormal depressions are seen in the frontal and temporal areas bilaterally that probably correspond to the future abnormal sulci. Courtesy of I de Macedo Santos, F De Guio, F Rousseau, D Rivière and JF Mangin.
Ventricles, germinal matrix & subarachnoid spaces
The lateral ventricular shape changes throughout pregnancy. At the end of the second month, lateral ventricles are large and globular, indented by the striatum and ganglionic eminence. At 15 weeks, the lateral ventricular width is twothirds that of the cerebrum; at 17 weeks, it is less than half; and at 20 weeks, it is one-third the cerebral width. This aspect corresponds to the so-called ‘relative fetal hydrocephalus’ (also known as ‘colpocephaly’), especially at the level of the atrium, which reflects the relatively greater size of the lateral ventricles as compared with the developing cerebral parenchyma, since the ventricular size is quite constant from 20 to 40 weeks of GA (7.6 ± 0.6 mm) generally accepted with a superior limit of 10 mm. The cavum septi pellucid is also visible by fetal MRI as a fluidfilled cavity between the lateral ventricles until approximately the time of birth.
The subarachnoid spaces are also prominent in young fetuses and are diffusively enlarged up to 31 weeks (before the acceleration of gyrification). However, prominence of the subarachnoid spaces still persists in some fetuses at the parieto–occipital level. It can be associated with mild uni- or bi-lateral ventriculomegaly and these aspects are thought to reflect the vacuolization of the primary meninges, which is known to occur from ventral to dorsal and posterior to anterior, leading to posterior accumulation of cerebrospinal fluid [53].
The germinal matrices volume increases between 13 and 26 weeks. Half of its volume is lost between 26 and 28 weeks, and gradually regresses. This 2-week period is associated with a high risk of hemorrhage of the germinal matrix coupled with a high fibrinolytic activity at that time.
■ Changes in brain composition
Changes in brain composition are characterized by changes in cellular density, an increase in complex lipid content due to the evolving process of myelination, a decrease in water content mostly in the white matter, developing fiber networks, both in the white matter and cortex, neurotransmitters and neurotransmitter– receptors interactions. Cell types are produced sequentially: first, the neurons, followed by astrocytes and finally, oligodendrocytes. The so-called ‘premyelinating stage’ corresponds to the complex process that includes the reduction in total water content, the rise in lipid concentration, the proliferation and maturation of oligodendrocyte precursors, and the ensheathment of axons by premyelin [54].
Neuronal differentiation & synapse formation
After proliferation and migration have occurred, growth of neuronal cells and processes will determine the final appearance of the cortex.
The cortical vertical laminar pattern starts to become evident by 23–25 weeks in the cerebral hemispheres [55]. Each layer of the sixlayered cortex contains specific neurons with specific connections. Layer II and layer III are connected to the homolateral and contralateral cortex, respectively. Layer IV receives afferences from the thalamus. Layer VI sends efferences to the thalamus, whereas layer V gives efferences to other structures than the thalamus [56,57]. Layer I receives input from other cortical areas. This schematic arrangement is identical in all cerebral neocortical areas, whatever their future functional specializations. The radial organization of the developing cortex can be identified by DTI in the preterm cerebral cortex. McKinstry et al. showed that the major axes are oriented radially in the cortex at 26 weeks GA and that this feature is much less prominent by 35 weeks GA [58]. Ex utero fetal specimen studies of the cerebral hemisphere demonstrated that FA varies with GA in a nonmonotonic manner: FA increases from 12 weeks to the late second to early third trimester, reaches a peak and then starts decreasing. FA reaches its peak value later in the frontal cortex. The FA changes are thought to represent the radial organization of neuronal cells followed by a loss of radial orientation [59]. A similar time course from 20 weeks on was shown in the cerebellar hemispheres [60]. In a clinical setting, lack of cortical anisotropy before 27 weeks help to identify abnormalities of cortical development.
Axons are forming and growing towards intra- and sub-cortical targets while dendrites of neurons grow and synapses form. Extrinsic and intrinsic factors are involved in the control of dendritic growth, guidance and branching [61]. The dendritic development of cortical neurons is slow during the first two trimesters of gestation [21,61], accelerating from the third trimester of gestation onwards, remaining very active until the end of the first postnatal year and continuing until the age of 5 years. Dendrites of neurons in the subplate and the deepest cortical layers mature earlier than those of more superficial cortical layers. Axons can be short (such as in case of interneurons), and others can display considerable length (such as in callosal fibers and the corticospinal tract). The length of axons and dendrites increases five- to ten-times during the first six postnatal months. Axonal growth and elongation in the cerebral white matter is marked from 21 to 64 weeks and decrease beyond 17 postnatal months [62]. Increased growth is seen between 27 and 40 weeks, the time at which white matter damage associated with periventricular leukomalacia most often occurs.
Synaptic connections increase along with dendritic development. First synapses are found in the spinal cord at 8 weeks and in the cerebral cortex at 9–10 weeks [63]. Synaptic density increases after the formation of the cortical plate at a rate of 4% per week until 24–26 weeks, followed by a dramatic increase from 28 weeks onwards. Synaptogenesis is heterochronous with regional differences. Maximum synaptic density is reached in the primary sensory areas (auditory and visual cortex) at the age of 3 months, whereas it occurs later, at 3.5 years, in the prefrontal cortex [64]. The time course of synaptogenesis resembles that of myelination. Maturational differences are also seen in the different types of cortical layer. Cortical layers that receive primary afferent input and that give rise to efferent fibers develop more rapidly than those involved with information processing. Layer-specific differences in synaptic density are also seen, with synaptic density lower in layers I, V, and VI than in layers II–IV. Synaptogenesis depends on axonal and dendritic growth. Communication between neurons at synapses is mediated by neurotransmitter release, postsynaptic receptor ion channels and cell-adhesion molecules [65]. Axon–astrocyte contacts also regulate synapse formation through factors produced by astrocytes.
The subplate is an important transient structure because it is a temporary goal of afferent fibers originating from the thalamus, brainstem nuclei, and the contra and ipsilateral hemispheres [66]. The subplate also acts as a reservoir for maturing neurons and transient synapses. The subplate is thick at 23–25 weeks and thus well identified on fetal brain MRI. It regresses after 31 weeks, coinciding with expansion of gyration, and disappears after birth [67,68].
Glial cells & formation of myelin
Functions of astrocytes include the regulation of composition of the extracellular environment and formation of synaptic connections. Astrocytes are also functionally coupled with oligodendrocytes through the astrocytic processes in contact with oligodendrocytes. In addition, astrocytes are involved in the metabolism of neurotransmitters Glx and GABA, in the detoxification of ammonia and in the glycogen pathway. The inability of astrocytes to realize their functions is seen in Alexander’s disease, which is caused by a mutation in the GFAP gene; GFAP is a marker of astrocytes [69].
The main function of oligodendrocytes is the formation of myelin. Oligodendrocyte progenitors are abundant until 27 weeks, followed by gradual transformation in mature myelin-producing cells. It should be noted that the target of periventricular leukomalacia, which is typically seen before 32 weeks, is an immature oligodendrocyte [70]. Myelin is a highly organized multilamellar structure formed by the plasma membrane of oligodendrocytes. This membrane surrounds neuronal axons and facilitates electrical impulse conduction. Biochemically, myelin contains small numbers of specific proteins and lipids, which are integrated into the membrane marked by a high degree of stability. One-third of the myelin lipids consist of two galactolipids; the galactocerebrosides and sulfatides that occupy the extracellular face of the membrane and are known from animal models to transduce developmental signals, to facilitate the protein trafficking and stabilize the membrane, in addition to being responsible for axon–myelin interaction. Proteo–lipid protein is a specific protein that stabilizes the myelin membrane, although the mechanism remains unclear. Myelin basic protein is also a specific protein that interacts with the cytoplasm faces of the sheath and facilitates the compaction of the myelin membrane. When wrapping around an axon, the oligodendrocytic extension undergoes a process of compaction, resulting in a loss of cytoplasm; this is responsible for the loss of mobile protons and, as a consequence, loss of MR signal, especially on T2-WIs. Besides the intense proliferation of oligodendrocytes taking place before the onset of myelination, there is a period of greatly increased lipid synthesis in the oligodendrocytes that will affect the MR signal. Cellular and biochemical processes of brain maturation are complex and any failure in synthesis of specific proteins or lipids will produce myelination disorders. Absence of the specific proteins will produce unstable myelin, such as in Pelizaeus–Marzbacher disease with absence of myelination. Absence of the specific myelin basic protein is part of the 18p-syndrome. Enzymatic defects in lipid synthesis, glycogen synthesis and others will produce the so-called leucodystrophies.
General rules of brain myelination are well known from histological studies. CNS myelination progresses in predictable sequences from caudal (spinal cord and brainstem) to rostral (telencephalon). It begins at 12–13 weeks in the spinal cord and continues well after birth (at least into the third decade) in the intracortical fibers of the cerebral cortex. In the cortex, myelination spreads in a concentric fashion, whereas in the subcortical white matter, myelination follows functionally defined bundles. Sensory pathways myelinate before motor pathways. Associative areas are the last to be myelinated. In a given cortical–subcortical functional unit, the cortex is generally myelinated first. Myelination of different parts of the brain develops at different times, at different speeds, and at a variable speed for a given structure; indeed, the rate of myelination in a particular pathway may change over time, such that the onset of myelination prior to or at birth is not necessarily associated with early myelination. In telencephalic sites, myelination progresses from the central sulcus outward towards all poles; the occipital pole myelinates before the frontal pole, which in turn myelinates before the temporal pole. As a consequence, a disease that leads to disruption of normal myelination in the neonatal period (such as leucodystrophies due to an inborn error of metabolism manifesting prior or at birth) will display brain damage in unmyelinated areas, especially at the level of frontal and temporal poles as well as in the anterior brainstem. On the other hand, a disease known to affect preferentially mature areas, such as birth asphyxia, will result in brain lesions predominantly of the central area, basal ganglia and posterior brainstem. At birth, large areas of the cortex, such as the primary areas (central, calcarine and auditive regions), are already myelinated, whereas the subcortical white matter is not. Biochemical sequences closely follow the anatomic sequences, they are identical in the different sites of myelination but occur at different times. This probably contributes to the regional variability of many inborn disorders of CNS white matter. The most rapid changes in myelination occur between mid-gestation and the second postnatal year. Two partially overlapping stages can be identified by histology: a period of oligodendrocyte proliferation and differentiation, and a period of rapid myelin synthesis and deposition.
Effects of brain composition changes on the MR signal & signal patterns in brain maturation
The effects on the MR signal are a shortening of T1 (bright signal) and of T2 (dark signal) [4,22]. The primary mechanisms responsible for the signal changes [1] are the decreased water content, mainly in the white matter, which affects T2, T1 and diffusion images; the increased density of cells (astrocytes and oligodendrocytes) that affect T1, T2 and diffusion images of the white matter and germinal matrix; the increase in complex lipid content in the white matter; and the MR properties of lipids with magnetization transfer effect from galactocerebrosides resulting in T1 and T2 WI shortening of white matter [71]. White matter bundle orientation and formation of membranes of myelin are responsible for changes in diffusivity.
■ T1- & T2-WIs
A change of signal is apparent first on T1-WI then on T2-WI because T1- and T2-WI probably express different mechanisms. T1 weighting is sensitive to the proliferation of cells and myelin precursors. Alteration of the T1 signal is thought to be due to increasing cholesterol and galactocerebrosides within the cell membranes of the oligodendrocyte myelin processes. Other factors are also of importance, such as the hydrophilic properties of some constituents of myelin. Cholesterol, glycolipids and portions of the myelin proteins are hydrophilic and bond strongly with water molecules, leading to a decrease in the amount of free water and shortening of T1 [22]. Although also dependent upon the biochemical changes in brain composition, T2 weighting is more sensitive to mature myelin and density of cells. As myelin sheaths from oligodendrocytes are wrapped tightly around the axons, the myelin replaces free water in the interstitial space.
The high density of cells packed in the cortex, basal ganglia and the germinal matrix, and the intense proliferation of glial cells before the onset of myelination within the white matter, are responsible for the multilayered pattern of the cerebral hemisphere seen in utero, first described on fetal MRI in 1992 [27,23–25] and followed by many reports (Figure 5) [26,67,68,72,73]. From the ventricular margin to the pial surface of the brain, the ventricular zone lining the lateral ventricles with the adjacent germinal matrix appears dark on T2-WIs and bright on T1-WIs. The periventricular zone, located just superficial to the ventricular zone, is a thin area of increased T2 and decreased T1 signal; the intermediate zones lie superficial to the periventricular zone and appear as bands of slightly hypointense T2 and hyperintense T1 signal; the subplate zone appears as a band of hyperintense T2 signal and hypointense T1 signal below the cortical plate; and the cortical plate appears dark on T2-WIs and bright on T1-WIs and is similar in signal intensity to the germinal matrix. The layer of migrating cells is transient and can be identified up to 30 weeks. It shows progressive vanishing within the deep white matter areas, merging in its intensity with the subventricular zone centrally and the subcortical white matter peripherally. After the 30th gestational week (GW), the multilayered pattern is less conspicuous and the intermediate layer of migrating cells is barely visible (Figure 6), when the subplate zone becomes less conspicuous and therefore no longer distinguished from the underlying intermediate zones in most areas of the developing brain. From 30 weeks onwards, some residual nests of cells can persist and appear as periventricular nodules of low T2 and slightly bright T1, predominantly in the frontal areas that do not have to be mistaken with nodules of leukomalacia and periventricular heterotopia [31]. The timing of the dissolution of the subplate varies in different regions of the brain: the subplate persists longest in the gyral crests of association areas in histologic and post-mortem MRI studies of the fetal brain [47]. The change in subplate signal intensity during MRI is thought to result from a decrease in the hydrophilic extracellular matrix component of the subplate, as axons accumulate in the upper part of the subplate zone before reaching the overlying cortex [68]. This was recently observed in fetal MRI studies, with the subplate persisting longest in the anterior temporal lobes [74]. The identification of the intermediate layers of migrant and differentiating cells before 28–30 weeks is an important landmark to consider during the fetal period. Indeed, its absence is seen in white matter damage in young fetuses. By contrast, a persistent subcortical band beyond 28–30 weeks is encountered in malformations of cortical development, such as heterotopias and agyria-pachygyria. It may also be seen in glutamatergic toxicity, whatever its cause [75]. Periventricular crossroads are also identified in the developing white matter of low intensity on T1-WI and high intensity on T2-WI, which are special sites of periventricular white matter where the growing fibers find their axonal guidance molecules during growth and pathway selection with the hydrophilic extracellular matrix [47,73]. Six crossroads have been described. The most prominent crossroads are in the frontal lobe, where they are located above and lateral to the anterior horn of the lateral ventricles (Figure 5). The occipital crossroad is located lateral to the posterior ventricular occipital horn. The parietal crossroad is located anterior lateral to the ventricular atrium and centered at the retrolenticular internal capsule. The temporal crossroad is located anterior and lateral to the temporal horn (Figure 6). On fetal MR scans, these crossroads become detectable at approximately 20 weeks and persist to postterm stages. They are also seen on MR scans of preterm babies where they manifest as a ‘caplike’ appearance (Figure 7) [76].

Figure 5: Multilayered appearance of the cerebral hemisphere at 23–25 weeks. Coronal T2- (A) and T1- (B) weighted image. The germinal matrix, the intermediate layers and the cortical ribbon display low T2 signal and high T1 signal. By contrast, the subplate, which is thick at that age and located below the cortex, and the periventricular zone show a high T2 signal and low T1 signal. The basal ganglia also displays a T1 hyperintensity and T2 hypointensity. Two frontal crossroads (arrows) are identified above and lateral to the frontal horns. Note the relatively large subarachnoid spaces.

Figure 6: 30–31 weeks, axial T2 (half-fourier single shot turbo spin-echo; half-Fourier acquisition single shot turbo spin-echo) image obtained at 3T. The multilayered appearance is not clearly identified anymore due to the merging in intensity of the intermediate layer with the surrounding white matter. Note the residual nests of cell in the frontal white matter close to the frontal horns that manifest as nodules of slightly low T2 signal. Also note the temporal crossroad that appears hyperintense (arrow).

Figure 7: Normal T2 appearance in highly premature neonate at 25 weeks. (A) Axial and (B) coronal T2-weighted image. Arrows indicate the crossroads, which show a cap-like appearance in the frontal, parietal and occipital areas. Note the multilayered appearance of the cerebellum with low T2 intensity of the deep gray nuclei, an intermediate T2 hyperintense band of parenchyma and the superficial T2 hypointense developing cortex. Also note the small nodule of very low intensity of the left cerebellar cortex, corresponding to a focal hemorrhage.
The basal ganglia also show a slight T1 hyperintensity and T2 hypointensity related to the high density of cells (Figure 5) quite early at 20–22 weeks. These signal changes are transiently conspicuous at 29–30 weeks compared with previous stages, especially on T1-WI. This appearance may mimic lesions of hypoxic-ischemic origin. A transient nodular organization due to cell aggregations has been described on post-mortem MRI [47], with a characteristic granularity of the striatum in the midfetal phase. The developmental appearance of the thalamic nuclei is not clearly identified on MRI in utero. However, it is possible to distinguish several territories on post-mortem MRI, including the dorsomedial complex and pulvinar territories, which are of lower MRI signal intensity due to a rich extracellular matrix content on T1-WIs, and the ventral territories, which have a higher MRI signal due to a high cell density.
In the posterior fossa, a transient layer known as the lamina dessicans is visible between the molecular layer and the deeper internal granular layer from 20 to 32 weeks [38,77,78]. This layer is a site of accumulation of multiple cell processes, including brainstem afferents, and is unique to humans. The lamina dessicans disappears first from the archicerebellum (flocculus) and later from the neocerebellum (hemispheres). On fetal MRI, the cerebellar hemispheres appear multilayered (Figure 7) as early as 21 weeks, with a central area of T2 hypointensity and T1 hyperintensity corresponding to the deep gray nuclei, an intermediate T2 hyperintense band of parenchyma and superficial T2 hypointense developing cortex, including the external granular layer. The flocculonodular lobule is hypointense on T2-WIs by 30–31 weeks.
Signal changes from brain myelination (Table 2) are detected early in utero and are seen on T1 (Figure 8) and T2 WI (Figure 2) in the medulla, dorsal pons and mesencephalon at 20 weeks. T1 changes are observed in the posterior limb of the internal capsule from 33 weeks onwards and in the proximal portion of the optic radiations from 35 weeks onwards (Figure 9). The white matter underlying the central area appears hyperintense on T1-WI and hypointense on T2-WI from 35 weeks onwards (Figure 10). Primary areas of the cortex (central area, calcarine area, and auditive area of the medial temporal lobe) also show a bright signal on T1-WIs and a low signal on T2-WIs compared with the cortex of other cerebral regions. This pattern is identifiable early in gestation and becomes conspicuous near term. At birth, large areas of the cortex are already myelinated, whereas the subcortical white matter is not. Postnatally this pattern is still identified until 2 months of age [4]. Later on, owing to the concentric spreading of myelination within the cortex, this MR appearance is difficult to depict because the different cortical areas display identical signals.
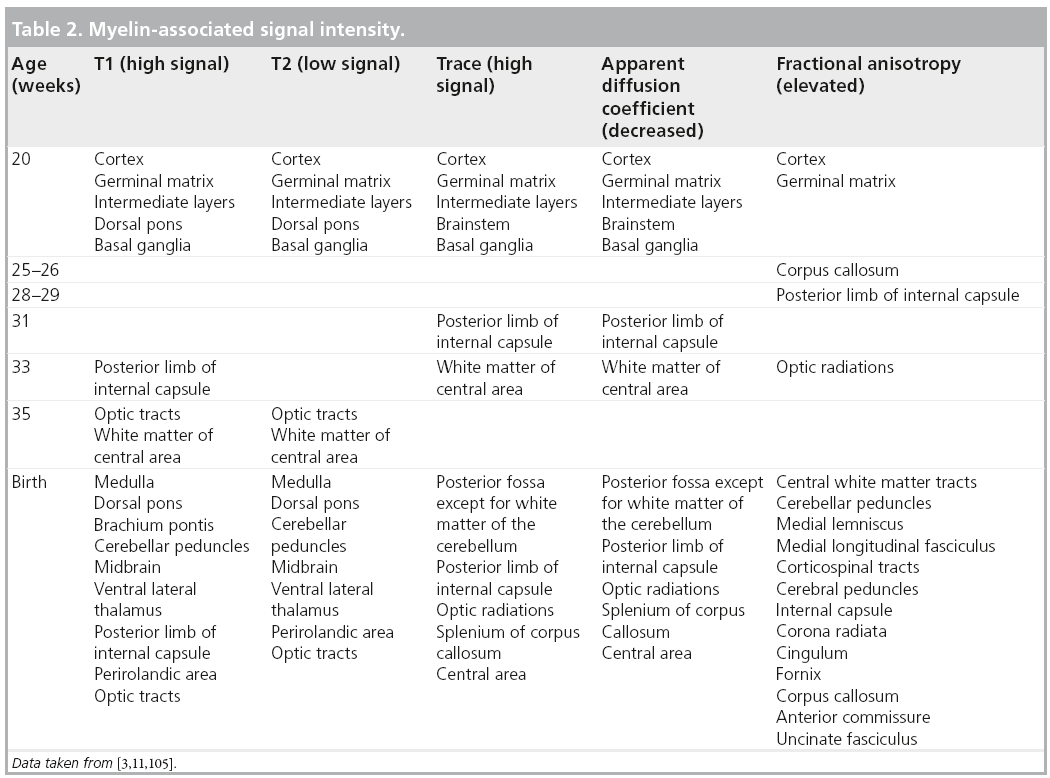

Figure 8: Axial T1-weighted image of myelinated-associated T1 hyperintensity at 25 weeks. The medulla, the dorsal pons and the mesencephalon appear hyperintense.

Figure 9: Myelinated-associated T1 hyperintensity. Myelinated-associated T1 hyperintensity at (A) 33 weeks and (B) 36 weeks in two different fetuses. Note the T1 hyperintensity within the posterior limb of the internal capsule at 33 weeks and within the optic tracts (proximal portion of the optic radiations) at 36 weeks (arrow).

Figure 10: Myelinated-associated signal changes at 37 weeks, axial T2 (half-fourier single shot turbo spin-echo; half-Fourier acquisition single shot turbo spin-echo) and T1 images. The white matter underlying the central area shows hypointensity on T2-weighted image and slight hyperintensity on T1-weighted image. Note that the central sulcus appears brighter than the adjacent cortex on T1-weighted image (arrow).
Finally, at birth and during the first month of life, characteristic milestones are identified on T1- (Figure 11) and T2-WI (Figure 12) : myelinated-associated T1 hyperintesity and T2 hypointensity is seen in the medulla, the dorsal pons, the midbrain peduncles, the superior and inferior cerebellar peduncles, and the ventral lateral thalamus. The anterior pons is not fully myelinated until 2 months of age. The white matter underlying the central area and the optic tract also shows similar signal changes. The cortex of the rolandic, calcarine and hippocampal areas is brighter on T1 WI and of lower signal on T2 WI compared with the other cortical regions. The posterior limb of the internal capsule displays T1 hyperintensity while not yet fully mature on T2-WI. This is an important landmark when assessing birth asphyxia at term. Indeed, its absence signifies central white matter edema and is usually encountered with basal ganglia involvement. The posterolateral portions of the lentiform nucleus and the ventral territories of the thalamus have higher MRI signal on T1-WIs and lower on T2-WIs due to high cell density compared with the dorsomedial complex and pulvinar territories, which are of lower MRI signal intensity on T1-WIs and of higher on T2-WIs due to a rich extracellular matrix content.

Figure 11: Characteristic milestones observed in a neonate on T2-weighted images (obtained at 3T). Myelination-associated T2 hypointensity is seen in the medulla, the dorsal pons, midbrain peduncles, inferior cerebellar peduncles, ventral lateral thalamus and posterior lateral areas of the lentiform nucleus. The white matter of the central area and the optic tract also shows similar signal changes. The cortex of the central sulcus and calcarine fissure is of lower signal compared with the other cortical regions.

Figure 12: Characteristic milestones observed in a neonate on T1-weighted images (obtained at 3T). Myelination-associated T1 hyperintensity is seen in the medulla, dorsal pons, midbrain peduncles, inferior cerebellar peduncles, ventral lateral thalamus and posterior lateral areas of the lentiform nucleus. The white matter of the central area also shows similar signal changes. The cortex of the central sulcus is brighter compared with the other cortical regions. The posterior limb of the internal capsule displays T1 hyperintensity while not yet fully mature on the T2-weighted image.
■ Diffusion images & DTI
Diffusion-weighted imaging is sensitive to changes in cell density and myelination, and shows myelin-associated signal changes before T1 and T2 sequences. It provides information about tissue maturation not seen in conventional MRI [79,80]. Reports of dedicated use of diffusionweighted imaging for normal fetal brain imaging are scarce [81–83]. In young fetuses before the 25th week of development (Figure 13), ADC maps show the multilayered pattern at the supratentorial level. The periventricular germinal zone and the cortical ribbon are of low signal intensity. Within the white matter area located between these two layers, the intermediate zone is of intermediate to high signal intensity. This intermediate zone is best identified in the central area of the centrum semiovale. On trace images the signal intensity is reversed. The basal ganglia also show a bright signal on diffusion-WIs and a low signal on an ADC map that are more conspicuous than the signal changes on conventional T1- and T2-WIs. The brainstem appears bright on diffusion images and of low signal on ADC maps in both anterior and posterior areas of the pons, whereas signal changes from maturation are only seen in the posterior part of the brainstem on T1- and T2-WIs. Crossing fibers of the corpus callosum are also identified as a bright signal on diffusion and low ADC. Similar to T1 and T2 WI, the multilayered pattern can be identified up to the 30th GW, especially in the thicker frontal area, and undergoes a profound reorganization over time. After the 30th week, the multilayered pattern is less conspicuous and the intermediate layer of migrating cells is barely visible. The process of maturation within the posterior limb of the internal capsule is seen at 30–31 weeks as a slight bright signal on DW images and a low signal on an ADC map (Figure 14), whereas signal changes are not yet identified on T1- and T2-WIs. The myelination process is depicted at approximately 33 weeks within the white matter underlying the central area as a bright signal on DW images and a low signal on ADC maps with no apparent signal changes on T1- and T2-WIs. Lower values of ADC are found within the pons, cerebellum, thalamus and basal ganglia, with a linear decrease of ADC over GA, which probably reflects the high organization and myelin deposition in ascending spinocerebellar and spinothalamic tracts [84,85]. In the deep white matter, ADC values vary in a nonlinear manner, with first a period of increased ADC lasting up to 30 weeks (although high cell density is seen in white matter), followed by decreased ADC values from 30 weeks to term. The first phase of increased ADC can be explained as a consequence of loose tissue organization with large extracellular space to allow migration and differentiation of cells. Several studies on both preterm and full-term neonates have shown significant negative correlation between ADC values and GA [86,87]. Indeed, diffusion parameters in the developing brain have been found to vary with water content, cell density, formation of white matter tracts, membrane potential and myelination [79]. Progressive decrease of ADC values in fetuses after 30 weeks GA [82] and in preterm and term neonates [86–90] has been putatively ascribed to the sequence of events making up the ‘premyelination stage’ [54,80] and the initiation of myelination. Surprisingly, when preterm neonates and fetuses at termequivalent age are compared, ADC is higher in the parietal white matter and lower in the pons compared with fetuses. The higher ADC value in the parietal white matter is probably related to subtle microstructural white matter anomalies, a common finding in preterm brains, and possible gliosis [91,92]. The low value in the pons probably results from a modification in the organization of pontine white matter tracts, such as a thickening of the myelin sheet. This lower ADC may reflect a more advanced maturational process in sensory motor relay in the premature brain after several weeks of extrauterine life. This finding is also seen with DTI studies reporting increased FA in various cerebral white matter regions, including sensory tracts of premature neonates imaged at term equivalent compared with term neonates. This finding was attributed to accelerated white matter development due to environmental stimulation [93,94].

Figure 13: Apparent diffusion coefficient map and trace images obtained in a fetus of 25 weeks of gestational age. Note the multilayered pattern at the supratentorial level. The periventricular germinal zone, the cortical ribbon and the migrating and differentiating cells of the white matter are of low signal intensity on apparent diffusion coefficient maps. On trace images the signal intensity is reversed. The basal ganglia also show a bright signal on diffusion-weighted images and a low signal on apparent diffusion coefficient maps. The brainstem appears bright on diffusion images and of low signal on apparent diffusion coefficient maps in both anterior and posterior areas of the pons.

Figure 14: Diffusion-weighted imaging (top row) and apparent coefficient diffusion (bottom row) maps at 30–31 weeks. The intermediate layer is barely visible. Arrows indicate the process of maturation within the posterior limb of the internal capsule.
ADC variations are used to detect the initiation of myelination processes but cannot depict the first stage of white matter maturation or differentiate the successive stages described by histology. DTI represents a new technique in the analysis of white matter maturation by modeling water molecule displacement via an ellipse oriented along the main direction of tissue structure [95]. In anisotropic tissue such as white matter (Figure 15), in addition to ADC, DTI provides information about the anisotropy of water diffusion reflecting a particular cellular arrangement of the structure, through parameters such as FA, longitudinal and radial diffusivities [96]. It also gives access to the main direction of water diffusion within a given voxel. When combined, this information can be used to estimate 3D trajectories of white matter bundles via tractography algorithms [97]. DTI studies in fetal MRI are scarce [11,98,99] due to many sources of errors and artifacts, especially from movement. However, DTI shows three different phases of radial and longitudinal diffusivity curve variations over GA for most of the bundles [11]. Phase one (before 26.3 GW) is characterized by a large increase in longitudinal diffusivity concomitant to a slow increase in radial diffusivity causing significant increases in ADC and FA. This period coincides with axonal organization; a transition from tortuous axons state to coherent bundles. Phase two (between 26.3 and 34.8 GW) shows similar and concomitant slow decreases in longitudinal and radial diffusivities, causing no change in FA (plateau) and a decrease in ADC. This period corresponds to a progressive increase in immature oligodendrocytes and the emission of cytoplasmic processes randomly oriented relative to axons, according to histological data from the literature [54]. Phase three (after 34.8 GW) is characterized by a slow decrease in longitudinal diffusivity and a concomitant fast decrease in radial diffusivity. Ensheathment of axons and compaction of myelin sheaths are responsible for the large restriction of water diffusion in the radial direction that is balanced in the longitudinal direction by the disappearance of cytoplasmic arborization. Few teams are actively working on motion correction to improve robustness of this technique, but new improvements are still required [41,42,100–102].

Figure 15: Fractional anisotropy obtained at 1.5T with 12 directions at 24, 27, 32 and 36 weeks. Anisotropy is elevated in the cortex and germinal matrix at 24 weeks with progressive decrease in the cortex while the deep white matter is showing progressive elevation of fractional anisotropy over gestational age.
Many studies have been able to characterize development of the white matter postnatally by DTI, with increase of FA concomitant to the decrease of ADC over age [103]. However, differences in white matter connectivity are seen in preterm infants studied at term compared with full-term infants [104]; the preterm infants show higher ADCs in the central cerebral white matter than the term infants, with concomitant lower relative anisotropy than in the infants born at term. These findings suggest that fibers are underdeveloped in the central cerebral white matter of the preterm infants at term. The diffusion vector maps also show architectural differences between the preterm infants studied at term and the infants born at term. Fiber development and orientation, particularly in the white matter, but also in the internal capsule, are more evident in the infants born at term. The central white matter in preterm infants at term exhibits shorter vector lengths, thinner vector bundles and less organized fibers compared with that of the infants born at term.
The majority of the major white matter tracts in the brain are identified at birth on FA maps (Figure 16) [3,105]. However, the central core of these tracts have higher anisotropy compared with the peripheral portions that are difficult to distinguish from gray matter. Structures of the posterior fossa that are seen at birth include the superior and inferior peduncles, the brachium pontis, the medial longitudinal fasciculus, the medial lemniscus and the reticular formation. The corticospinal tracts, cerebral peduncles, internal capsule and corona radiata are the components of the motor system that are well identified at birth. The cingulum and fornix, which are parts of the limbic system, are also discernible. Association and commissural tracts that show increased anisotropy include the corpus callosum, anterior commisssure and uncinate fascicules. Color-coded orientation maps are also necessary to look for disorganized white matter, especially in neonates suffering from seizures [2].

Figure 16: Fractional anisotropy map (top row) and color-coded fractional anisotropy map (bottom row) obtained at 3T in a neonate. Anisotropy is elevated in the brachium pontis, the superior cerebellar peduncles, the corpus callosum and fornix, and in the internal capsules. Note that the central white matter has higher anisotropy compared with the peripheral white matter.
■ Spectrosopy
Spectroscopy is used to obtain complementary information on the brain status, especially in neonatal encephalopathies [106–108]. The neonatal brain is characterized by high concentrations of choline (Cho), myo-inositol-glycine and glutamine plus glutamate (Glx) compared with creatine (Cr) and N acetylaspartate (NAA). Brain maturation is characterized by an increase in NAA and Cr, and a concomitant decrease in Cho, myo-inositol-glycine and lipids [109]. Inositol is a precursor molecule for inositol lipid synthesis and is considered as an osmolyte, and above all as an astrocyte marker. Inositol is the predominant peak from 22 to 28 weeks, and probably reflects the high density of glial cells that multiply and differentiate before myelinogenesis starts. The Cho peak represents the high levels of substrate needed for the formation of cell membranes with gradual reduction as soon as incorporation of lipids has taken place. NAA is considered to be a neuronal marker and is also expressed in oligo-type-2 astrocyte progenitors, immature oligodendrocytes and mature oligodendrocytes. Therefore, NAA also reflects oligodendrocyte proliferation and differentiation [110]. As neuronal cell density in the cortex decreases with dendritic maturation, the increase in NAA with age may reflect a contribution of non-neuronal origin. Cr reflects energy metabolism and has been shown to increase postnatally and before and around term [109]. Regional variations are pronounced at all ages between gray and white matter, and also within different areas of gray and white matter. Highest Cho, Cr and NAA peak intensities occur in the thalamus, followed by the basal ganglia and then other regions in preterm and term infants [106]. This probably reflects the high cellular density in these areas and the more mature status compared with white matter. Concentration of NAA and Cr is higher in gray matter than in white matter, while the concentration of Cho is slightly lower in gray matter than in white matter. The reason is unclear and one could say that gray matter contains fewer membranes of myelin. In terms of white matter, NAA and Cho peak intensities are higher in the parietooccipital area than in frontal white matter [111]. The parietal area is myelinated before the frontal area so that the adult pattern is reached first in the parieto-occipital region. The posterior fossa has a peculiar metabolic pattern. The developing cerebellum shows a rapid NAA increase from infancy to childhood and a rapid increase in Cr and Glx from fetus, infancy and childhood [112]. The cerebellum has the highest concentration of Cr and is also characterized by high content of Glx, Cho and myo-inositol-glycine compared with the cerebral hemisphere. Regional variations are also seen in the posterior fossa; the lower concentrations are in the vermis, whereas the highest concentrations are in the pons.
Reports of spectroscopy are limited in fetal MRI. The feasibility of MR spectroscopy for examining human fetal brain metabolism after 30 weeks GA was demonstrated first [1113–116], followed by studies of a larger GA range [117,118]. At 22 weeks, the brain spectrum is characterized by two prominent resonances assigned to myo-inositol-glycine and Cho. In addition, NAA is detectable, although not as clearly as at 24 weeks GA, due to the difficulty of obtaining good signal-to-noise ratio at that age. The resonance of NAA is then observed from 24 weeks onwards. With increasing GA, myo-inositol-glycine and Cho tend to decrease, while NAA and tCr resonances become well defined and more intense. At 34 weeks GA, the metabolic pattern is very similar to the neonatal spectrum (Figure 17), with three dominant resonances (Cho, tCr and NAA) at long time of echo, and five dominant resonances (myoinositol- glycine, Cho, tCr, NAA, and Glx) at short time of echo. Interestingly, when preterm neonates and fetuses at term-equivalent age are compared, significant differences are observed at short time of echo in the centrum semiovale [119]. Almost all metabolic ratios expressed with water tissue signal intensity as a reference are higher in the group of premature neonates. The changes observed in NAA, Glx, and Cr point to an accelerated maturation in the white matter of premature neonates. The high myo-inositol and the trend for Cho to be lower coincide with higher ADC values that indicate the existence of subtle white matter injury and gliosis not visible by conventional images.

Figure 17: Single-voxel MR spectroscopy obtained in the white matter of a neonate aged 15 days at short and long echo time. Five dominant resonances (myo-inositol, choline, creatine, N-acetylaspartate and glutamine–glutamate) are identified at short time of echo, while three dominant resonances (choline, creatine and N-acetylaspartate) are seen at long time of echo.
Lactate may be part of the normal metabolic spectra in premature newborns [120]. However, the pathological significance of a lactate peak found in the fetal brain remains unclear. Discrepancies exist between in utero and ex utero studies because the physiology and environment are totally different from pre- to post-natal life [109]. Elevated lactate is seen in numerous conditions and identified in fetal MRI in cases with isolated ventriculomegaly, infections, malformations, brain injury, extracerebral malformation, and in pregnancy at risk unrelated to infection [121]. However, further data are needed, especially from follow-up when morphology is considered normal, to understand the significance of elevated lactate in the different clinical conditions and to assess accurate quantification, which could bear prognosis information.
Conclusion
Brain maturation is complex and most changes occur from mid-gestation to 2 years of age. At the present time, T1- and T2-WI provide important information, especially regarding myelination. However, other techniques such as diffusion imaging and proton spectroscopy, gain clinical relevance, especially in the recognition of white and gray matter maturation. Changes in brain morphology and composition have to be known from radiologist and scientific community, especially to adapt MR parameters of each technique, to recognize the normal MRI pattern over age, to finally identify abnormal maturation as early as possible.
Future perspective
Progress has been made by the research centers in animal and human studies in order to understand the mechanisms governing the multiple steps of brain maturation. These studies also provide automated computational techniques by applying mathematically-based segmentation techniques that allow volume measurements of total gray matter, white matter, basal ganglia and cerebrospinal fluid, the identification of the developing white matter bundles and the developing cortical folding. What we can expect is: first, the development of MR-pulse sequences with reasonable acquisition times, applicable in clinical settings especially for DTI and proton spectroscopy because of the challenge of movements in fetuses and infants; second, the development of automated computational techniques for the analysis of MR images from any manufacturer that will permit analysis of large series; and finally the use of high field strength, especially a 3T MR magnet with high signal-to-noise ratio, in the prenatal and neonatal periods in clinical practice, which is not currently standardized. This will help us to further understand normal brain development and to recognize brain maturation abnormalities as early as possible for medical decision-making.
Financial & competing interests disclosure
The authors have no relevant affiliations or financial involvement with any organization or entity with a financial interest in or financial conflict with the subject matter or materials discussed in the manuscript. This includes employment, consultancies, honoraria, stock ownership or options, expert testimony, grants or patents received or pending, or royalties.
No writing assistance was utilized in the production of this manuscript.
References
Papers of special note have been highlighted as:
• of interest
• • of considerable interest
- Girard N, Confort-Gouny S, Schneider J et al. MR imaging of brain maturation. J. Neuroradiol. 34(5), 290–310 (2007).
- Girard N, Raybaud C. Neonates with seizures: what to consider, how to image. Magn. Reson. Imaging Clin. N. Am. 19(4), 685–708; vii (2011).
- Welker KM, Patton A. Assessment of normal myelination with magnetic resonance imaging. Semin. Neurol. 32(1), 15–28 (2012).
- Girard N, Raybaud C, du Lac P. MRI study of brain myelination. J. Neuroradiol. 18(4), 291–307 (1991).
- Bottomley PA. Spatial localization in NMR spectroscopy in vivo. Ann. NY Acad. Sci. 508, 333–348 (1987).
- Brown TR. Practical applications of chemical shift imaging. NMR Biomed. 5, 238–243 (1992).
- Le Fur Y, Nicoli F, Guye M, Confort-Gouny S, Cozzone PJ, Kober F. Grid-free interactive and automated data processing for MR chemical shift imaging data. Magma 23, 23–30 (2010).
- Maudsley AA, Domenig C, Sheriff S. Reproducibility of serial whole-brain MR spectroscopic imaging. NMR Biomed. 23(3), 251–256 (2010).
- Brunel H, Girard N, Confort-Gouny S et al. Fetal brain injury. J. Neuroradiol. 31(2), 123–137 (2004).
- Girard NJ, Chaumoitre K. The brain in the belly: what and how of fetal neuroimaging? J. Magn. Reson. Imaging 36, 788–804 (2012).
- Zanin E, Ranjeva JP, Confort-Gouny S et al. White matter maturation of normal human fetal brain. An in vivo diffusion tensor tractography study. Brain Behav. 1(2), 95–108 (2011).
- Rademacher J, Engelbrecht V, Burgel U, Freund H, Zilles K. Measuring in vivo myelination of human white matter fiber tracts with magnetization transfer MR. Neuroimage 9(4), 393–406 (1999).
- van Buchem MA, Steens SC, Vrooman HA et al. Global estimation of myelination in the developing brain on the basis of magnetization transfer imaging: a preliminary study. AJNR Am. J. Neuroradiol. 22(4), 762–766 (2001).
- Ding XQ, Kucinski T, Wittkugel O et al. Normal brain maturation characterized with age-related T2 relaxation times: an attempt to develop a quantitative imaging measure for clinical use. Invest. Radiol. 39(12), 740–746 (2004).
- Fransson P, Skiold B, Engstrom M et al. Spontaneous brain activity in the newborn brain during natural sleep – an fMRI study in infants born at full term. Pediatr. Res. 66(3), 301–305 (2009).
- Fransson P, Skiold B, Horsch S et al. Resting-state networks in the infant brain. Proc. Natl Acad. Sci. USA 104(39), 15531–15536 (2007).
- Hagmann P, Sporns O, Madan N et al. White matter maturation reshapes structural connectivity in the late developing human brain. Proc. Natl Acad. Sci. USA 107(44), 19067–19072 (2010).
- Deoni SC, Mercure E, Blasi A et al. Mapping infant brain myelination with magnetic resonance imaging. J. Neurosci. 31(2), 784–791 (2011).
- Yakovlev PI, Lecours AR. The myelinigenetic cycles of regional maturation of the brain. In: Regional Development of the Brain in Early Life. Moinkowski A (Ed.). Blackwell, Oxford, UK, 3–70 (1967).
- 20 Gilles FH, Gomez IG. Developmental neuropathology of the second half of gestation. Early Hum. Dev. 81(3), 245–253 (2005).
- de Graaf-Peters VB, Hadders-Algra M. Ontogeny of the human central nervous system: what is happening when? Early Hum. Dev. 82(4), 257–266 (2006).
- Barkovich AJ, Kjos BO, Jackson DE Jr, Norman D. Normal maturation of the neonatal and infant brain: MR imaging at 1.5 T. Radiology 166(1 Pt 1), 173–180 (1988).
- Girard N, Raybaud C, Poncet M. In vivo MR study of brain maturation in normal fetuses. AJNR Am. J. Neuroradiol. 16(2), 407–413 (1995).
- Girard N, Raybaud C, Dercole C et al. In vivo MRI of the fetal brain. Neuroradiology 35(6), 431–436 (1993).
- Girard NJ, Raybaud CA. In vivo MRI of fetal brain cellular migration. J. Comput. Assist. Tomogr. 16(2), 265–267 (1992).
- Brisse H, Fallet C, Sebag G, Nessmann C, Blot P, Hassan M. Supratentorial parenchyma in the developing fetal brain: in vitro MR study with histologic comparison. AJNR Am. J. Neuroradiol. 18(8), 1491–1497 (1997).
- Girard N, Raybaud C, Gambarelli D, Figarella-Branger D. Fetal brain MR imaging. Magn. Reson. Imaging Clin. N. Am. 9(1), 19–56, vii (2001).
- Garel C, Chantrel E, Brisse H et al. Fetal cerebral cortex: normal gestational landmarks identified using prenatal MR imaging. AJNR Am J. Neuroradiol. 22(1), 184–189 (2001).
- Chi JG, Dooling EC, Gilles FH. Gyral development of the human brain. Ann. Neurol. 1(1), 86–93 (1977).
- Girard N, Gambarelli D. Normal Fetal Brain. Magnetic Resonance Imaging. An Atlas with Anatomic Correlations. Label Production, Marseille, France (2001).
- Fogliarini C, Chaumoitre K, Chapon F et al. Assessment of cortical maturation with prenatal MRI. Part I: normal cortical maturation. Eur. Radiol. 15(8), 1671–1685 (2005).
- Levine D, Barnes PD. Cortical maturation in normal and abnormal fetuses as assessed with prenatal MR imaging. Radiology 210(3), 751–758 (1999).
- Dubois J, Benders M, Lazeyras F et al. Structural asymmetries of perisylvian regions in the preterm newborn. Neuroimage 52(1), 32–42 (2010).
- Glasel H, Leroy F, Dubois J, Hertz-Pannier L, Mangin JF, Dehaene-Lambertz G. A robust cerebral asymmetry in the infant brain: the rightward superior temporal sulcus. Neuroimage 58(3), 716–723 (2011).
- Adamsbaum C, Moutard ML, Andre C et al. MRI of the fetal posterior fossa. Pediatr. Radiol. 35(2), 124–140 (2005).
- Fogliarini C, Chaumoitre K, Chapon F et al. Assessment of cortical maturation with prenatal MRI: part II: abnormalities of cortical maturation. Eur. Radiol. 15(9), 1781–1789 (2005).
- Poretti A, Wolf NI, Boltshauser E. Differential diagnosis of cerebellar atrophy in childhood. Eur. J. Paediatr. Neurol. 12(3), 155–167 (2008).
- Triulzi F, Parazzini C, Righini A. MRI of fetal and neonatal cerebellar development. Semin. Fetal Neonatal Med. 10(5), 411–420 (2005).
- Habas PA, Kim K, Corbett-Detig JM et al. A spatiotemporal atlas of MR intensity, tissue probability and shape of the fetal brain with application to segmentation. Neuroimage 53(2), 460–470 (2010).
- Limperopoulos C, Clouchoux C. Advancing fetal brain MRI: targets for the future. Semin. Perinatol. 33(4), 289–298 (2009).
- Rousseau F, Glenn O, Iordanova B et al. A novel approach to high resolution fetal brain MR imaging. Med. Image Comput. Comput. Assist. Interv. 8(Pt 1), 548–555 (2005).
- Rousseau F, Glenn OA, Iordanova B et al. Registration-based approach for reconstruction of high-resolution in utero fetal MR brain images. Acad. Radiol. 13(9), 1072–1081 (2006).
- Huppi PS. Cortical development in the fetus and the newborn: advanced MR techniques. Top Magn. Reson. Imaging 22(1), 33–38 (2011).
- Rajagopalan V, Scott J, Habas PA et al. Local tissue growth patterns underlying normal fetal human brain gyrification quantified in utero. J. Neurosci. 31(8), 2878–2887 (2011).
- Leroy F, Mangin JF, Rousseau F et al. Atlas-free surface reconstruction of the cortical grey-white interface in infants. PLoS ONE 6(11), e27128 (2011).
- Lefevre J, Leroy F, Khan S et al. Identification of growth seeds in the neonate brain through surfacic Helmholtz decomposition. Inf. Process Med. Imaging 21, 252–263 (2009).
- Kostovic I, Vasung L. Insights from in vitro fetal magnetic resonance imaging of cerebral development. Semin. Perinatol. 33(4), 220–233 (2009).
- Toro R, Burnod Y. A morphogenetic model for the development of cortical convolutions. Cereb. Cortex 15(12), 1900–1913 (2005).
- Hilgetag CC, Barbas H. Role of mechanical factors in the morphology of the primate cerebral cortex. PLoS Comput. Biol. 2(3), e22 (2006).
- Regis J, Mangin JF, Ochiai T et al. ‘Sulcal root’ generic model: a hypothesis to overcome the variability of the human cortex folding patterns. Neurol. Med. Chir. (Tokyo) 45(1), 1–17 (2005).
- Mangin JF, Riviere D, Cachia A et al. A framework to study the cortical folding patterns. Neuroimage 23(Suppl. 1), S129–S138 (2004).
- Lefevre J, Mangin JF. A reaction-diffusion model of human brain development. PLoS Comput. Biol. 6(4), e1000749 (2010).
- Girard NJ, Raybaud CA. Ventriculomegaly and pericerebral CSF collection in the fetus: early stage of benign external hydrocephalus? Childs Nerv. Syst. 17(4–5), 239–245 (2001).
- Back SA, Luo NL, Borenstein NS, Volpe JJ, Kinney HC. Arrested oligodendrocyte lineage progression during human cerebral white matter development: dissociation between the timing of progenitor differentiation and myelinogenesis. J. Neuropathol. Exp. Neurol. 61(2), 197–211 (2002).
- Norman M, McGillivray B, Kalousek D, Hill A, Poskit K. Congenital Malformations of the Brain. Pathological, Embryological, Clinical, Radiological and Genetic Aspects. Oxford University Press, NY, USA (1995).
- Kostovic I, Judas M. The development of the subplate and thalamocortical connections in the human foetal brain. Acta Paediatr. 99(8), 1119–1127 (2010).
- Leone DP, Srinivasan K, Chen B, Alcamo E, McConnell SK. The determination of projection neuron identity in the developing cerebral cortex. Curr. Opin. Neurobiol. 18(1), 28–35 (2008).
- McKinstry RC, Mathur A, Miller JH et al. Radial organization of developing preterm human cerebral cortex revealed by noninvasive water diffusion anisotropy MRI. Cereb. Cortex 12(12), 1237–1243 (2002).
- Trivedi R, Gupta RK, Husain N et al. Region-specific maturation of cerebral cortex in human fetal brain: diffusion tensor imaging and histology. Neuroradiology 51(9), 567–576 (2009).
- Saksena S, Husain N, Das V et al. Diffusion tensor imaging in the developing human cerebellum with histologic correlation. Int. J. Dev. Neurosci. 26(7), 705–711 (2008).
- McAllister AK. Cellular and molecular mechanisms of dendrite growth. Cereb. Cortex 10(10), 963–973 (2000).
- Haynes RL, Borenstein NS, Desilva TM et al. Axonal development in the cerebral white matter of the human fetus and infant. J. Comp. Neurol. 484(2), 156–167 (2005).
- Zecevic N. Synaptogenesis in layer I of the human cerebral cortex in the first half of gestation. Cereb. Cortex 8(3), 245–252 (1998).
- Huttenlocher PR, Dabholkar AS. Regional differences in synaptogenesis in human cerebral cortex. J. Comp. Neurol. 387(2), 167–178 (1997).
- Dalva MB, McClelland AC, Kayser MS. Cell adhesion molecules: signalling functions at the synapse. Nat. Rev. Neurosci. 8(3), 206–220 (2007).
- Allendoerfer KL, Shatz CJ. The subplate, a transient neocortical structure: its role in the development of connections between thalamus and cortex. Annu. Rev. Neurosci. 17, 185–218 (1994).
- Kostovic I, Judas M, Rados M, Hrabac P. Laminar organization of the human fetal cerebrum revealed by histochemical markers and magnetic resonance imaging. Cereb. Cortex 12(5), 536–544 (2002).
- Rados M, Judas M, Kostovic I. In vitro MRI of brain development. Eur. J. Radiol. 57(2), 187–198 (2006).
- De Keyser, Mostert JP, Koch MW. Dysfunctional astrocytes as key players in the pathogenesis of central nervous system disorders. J. Neuro. Sci. 267, 3–16 (2008).
- Back SA, Luo NL, Borenstein NS, Levine JM, Volpe JJ, Kinney HC. Late oligodendrocyte progenitors coincide with the developmental window of vulnerability for human perinatal white matter injury. J. Neurosci. 21(4), 1302–1312 (2001).
- Kucharczyk W, Macdonald PM, Stanisz GJ, Henkelman RM. Relaxivity and magnetization transfer of white matter lipids at MR imaging: importance of cerebrosides and pH. Radiology 192(2), 521–529 (1994).
- Chong BW, Babcook CJ, Salamat MS, Nemzek W, Kroeker D, Ellis WG. A magnetic resonance template for normal neuronal migration in the fetus. Neurosurgery 39(1), 110–116 (1996).
- Prayer D, Kasprian G, Krampl E et al. MRI of normal fetal brain development. Eur. J. Radiol. 57(2), 199–216 (2006).
- Rutherford M, Jiang S, Allsop J et al. MR imaging methods for assessing fetal brain development. Dev. Neurobiol. 68(6), 700–711 (2008).
- Gire C, Girard N, Nicaise C, Einaudi MA, Montfort MF, Dejode JM. Clinical features and neuroradiological findings of mitochondrial pathology in six neonates. Childs Nerv. Syst. 18(11), 621–628 (2002).
- Battin MR, Maalouf EF, Counsell SJ et al. Magnetic resonance imaging of the brain in very preterm infants: visualization of the germinal matrix, early myelination, and cortical folding. Pediatrics 101(6), 957–962 (1998).
- Triulzi F, Parazzini C, Righini A. Magnetic resonance imaging of fetal cerebellar development. Cerebellum 5(3), 199–205 (2006).
- Glenn OA. Normal development of the fetal brain by MRI. Semin. Perinatol. 33(4), 208– 219 (2009).
- Prayer D, Barkovich AJ, Kirschner DA et al. Visualization of nonstructural changes in early white matter development on diffusionweighted MR images: evidence supporting premyelination anisotropy. AJNR Am. J. Neuroradiol. 22(8), 1572–1576 (2001).
- Wimberger DM, Roberts TP, Barkovich AJ, Prayer LM, Moseley ME, Kucharczyk J. Identification of ‘premyelination’ by diffusion-weighted MRI. J. Comput. Assist. Tomogr. 19(1), 28–33 (1995).
- Righini A, Bianchini E, Parazzini C et al. Apparent diffusion coefficient determination in normal fetal brain: a prenatal MR imaging study. AJNR Am. J. Neuroradiol. 24(5), 799–804 (2003).
- Schneider JF, Confort-Gouny S, Le Fur Y et al. Diffusion-weighted imaging in normal fetal brain maturation. Eur. Radiol. 17(9), 2422–2429 (2007).
- Schneider MM, Berman JI, Baumer FM et al. Normative apparent diffusion coefficient values in the developing fetal brain. AJNR Am. J. Neuroradiol. 30(9), 1799–1803 (2009).
- Dubois J, Hertz-Pannier L, Dehaene-Lambertz G, Cointepas Y, Le Bihan D. Assessment of the early organization and maturation of infants’ cerebral white matter fiber bundles: a feasibility study using quantitative diffusion tensor imaging and tractography. Neuroimage 30(4), 1121–1132 (2006).
- Rozeik C, Von Keyserlingk D. The sequence of myelination in the brainstem of the rat monitored by myelin basic protein immunohistochemistry. Brain Res. 432(2), 183–190 (1987).
- Morriss MC, Zimmerman RA, Bilaniuk LT, Hunter JV, Haselgrove JC. Changes in brain water diffusion during childhood. Neuroradiology 41(12), 929–934 (1994).
- Neil JJ, Shiran SI, McKinstry RC et al. Normal brain in human newborns: apparent diffusion coefficient and diffusion anisotropy measured by using diffusion tensor MR imaging. Radiology 209(1), 57–66 (1998).
- Dudink J, Kerr JL, Paterson K, Counsell SJ. Connecting the developing preterm brain. Early Hum. Dev. 84(12), 777–782 (2008).
- Mukherjee P, Miller JH, Shimony JS et al. Normal brain maturation during childhood: developmental trends characterized with diffusion-tensor MR imaging. Radiology 221(2), 349–358 (2001).
- Tanner SF, Ramenghi LA, Ridgway JP et al. Quantitative comparison of intrabrain diffusion in adults and preterm and term neonates and infants. AJR Am. J. Roentgenol. 174(6), 1643–1649 (2000).
- Hagen T, Ahlhelm F, Reiche W. Apparent diffusion coefficient in vasogenic edema and reactive astrogliosis. Neuroradiology 49(11), 921–926 (2007).
- Neil J, Miller J, Mukherjee P, Huppi PS. Diffusion tensor imaging of normal and injured developing human brain – a technical review. NMR Biomed. 15(7–8), 543–552 (2002).
- Gimenez M, Miranda MJ, Born AP, Nagy Z, Rostrup E, Jernigan TL. Accelerated cerebral white matter development in preterm infants: a voxel-based morphometry study with diffusion tensor MR imaging. Neuroimage 41(3), 728–734 (2008).
- Rose SE, Hatzigeorgiou X, Strudwick MW, Durbridge G, Davies PS, Colditz PB. Altered white matter diffusion anisotropy in normal and preterm infants at term-equivalent age. Magn. Reson. Med. 60(4), 761–767 (2008).
- Mori S, Zhang J. Principles of diffusion tensor imaging and its applications to basic neuroscience research. Neuron 51(5), 527–539 (2006).
- Song SK, Sun SW, Ramsbottom MJ, Chang C, Russell J, Cross AH. Dysmyelination revealed through MRI as increased radial (but unchanged axial) diffusion of water. Neuroimage 17(3), 1429–1436 (2002).
- Huang H, Xue R, Zhang J et al. Anatomical characterization of human fetal brain development with diffusion tensor magnetic resonance imaging. J. Neurosci. 29(13), 4263–4273 (2009).
- Bui T, Daire JL, Chalard F et al. Microstructural development of human brain assessed in utero by diffusion tensor imaging. Pediatr. Radiol. 36(11), 1133–1140 (2006).
- Kasprian G, Brugger PC, Weber M et al. In utero tractography of fetal white matter development. Neuroimage 43(2), 213–224 (2008).
- Jiang S, Xue H, Counsell S et al. Diffusion tensor imaging (DTI) of the brain in moving subjects: application to in-utero fetal and ex-utero studies. Magn. Reson. Med. 62(3), 645–655 (2009).
- Oubel E, Koob M, Studholme C, Dietemann JL, Rousseau F. Reconstruction of scattered data in fetal diffusion MRI. Med. Image Anal. 16(1), 28–37 (2011).
- Faria AV, Zhang J, Oishi K et al. Atlas-based analysis of neurodevelopment from infancy to adulthood using diffusion tensor imaging and applications for automated abnormality detection. Neuroimage 52(2), 415–428 (2010).
- Ment LR, Hirtz D, Huppi PS. Imaging biomarkers of outcome in the developing preterm brain. Lancet Neurol. 8(11), 1042–1055 (2009).
- Huppi PS, Maier SE, Peled S et al. Microstructural development of human newborn cerebral white matter assessed in vivo by diffusion tensor magnetic resonance imaging. Pediatr. Res. 44(4), 584–590 (1998).
- Hermoye L, Saint-Martin C, Cosnard G et al. Pediatric diffusion tensor imaging: normal database and observation of the white matter maturation in early childhood. Neuroimage 29(2), 493–504 (2006).
- Barkovich AJ, Westmark KD, Bedi HS, Partridge JC, Ferriero DM, Vigneron DB. Proton spectroscopy and diffusion imaging on the first day of life after perinatal asphyxia: preliminary report. AJNR Am. J. Neuroradiol. 22(9), 1786–1794 (2001).
- Groenendaal F, van der Grond J, Eken P et al. Early cerebral proton MRS and neurodevelopmental outcome in infants with cystic leukomalacia. Dev. Med. Child Neurol. 39(6), 373–379 (1997).
- Huppi PS, Lazeyras F. Proton magnetic resonance spectroscopy ((1)H-MRS) in neonatal brain injury. Pediatr. Res. 49(3), 317–320 (2001).
- Kreis R, Ernst T, Ross BD. Development of the human brain: in vivo quantification of metabolite and water content with proton magnetic resonance spectroscopy. Magn. Reson. Med. 30(4), 424–437 (1993).
- Bhakoo KK, Pearce D. In vitro expression of N-acetyl aspartate by oligodendrocytes: implications for proton magnetic resonance spectroscopy signal in vivo. J. Neurochem. 74(1), 254–262 (2000).
- Hashimoto T, Tayama M, Miyazaki M et al. Developmental brain changes investigated with proton magnetic resonance spectroscopy. Dev. Med. Child Neurol. 37(5), 398–405 (1995).
- Kato T, Nishina M, Matsushita K, Hori E, Mito T, Takashima S. Neuronal maturation and N-acetyl-L-aspartic acid development in human fetal and child brains. Brain Dev. 19(2), 131–133 (1997).
- Fenton BW, Lin CS, Macedonia C, Schellinger D, Ascher S. The fetus at term: in utero volume-selected proton MR spectroscopy with a breath-hold technique – a feasibility study. Radiology 219, 563–566 (2001).
- Heerschap A, van den Berg PP. Proton magnetic resonance spectroscopy of human fetal brain. Am. J. Obstet. Gynecol. 170(4), 1150–1151 (1994).
- Kok RD, van den Berg PP, van den Bergh AJ, Nijland R, Heerschap A. Maturation of the human fetal brain as observed by 1H MR spectroscopy. Magn. Reson. Med. 48(4), 611–616 (2002).
- Kok RD, van den Bergh AJ, Heerschap A, Nijland R, van den Berg PP. Metabolic information from the human fetal brain obtained with proton magnetic resonance spectroscopy. Am. J. Obstet. Gynecol. 185(5), 1011–1015 (2001).
- Girard N, Fogliarini C, Viola A et al. MRS of normal and impaired fetal brain development. Eur. J. Radiol. 57(2), 217–225 (2006).
- Girard N, Gouny SC, Viola A et al. Assessment of normal fetal brain maturation in utero by proton magnetic resonance spectroscopy. Magn. Reson. Med. 56(4), 768–775 (2006).
- Viola A, Confort-Gouny S, Schneider JF et al. Is brain maturation comparable in fetuses and premature neonates at term equivalent age? AJNR Am. J. Neuroradiol. 32(8), 1451–1458 (2011).
- Wang ZJ, Vigneron DB, Miller SP et al. Brain metabolite levels assessed by lactate-edited MR spectroscopy in premature neonates with and without pentobarbital sedation. AJNR Am. J. Neuroradiol. 29(4), 798–801 (2008).
- Brighina E, Bresolin N, Pardi G, Rango M. Human fetal brain chemistry as detected by proton magnetic resonance spectroscopy. Pediatr. Neurol. 40(5), 327–342 (2009).
• Review of the potential role of adjunct techniques, such as diffusion imaging and spectroscopy, which may help elucidate fetal brain maturation and its abnormalities.
• In vivo study of the fetal white matter tracts by diffusion-tensor imaging, as obtained in clinical practice.
• • Reviews myelinogenesis of the human brain. 20 Gilles FH, Gomez IG. Developmental neuropathology of the second half of gestation. Early Hum. Dev. 81(3), 245–253 (2005).
• • Review of the architectonic of the developing cortex.
• • MRI of fetal specimens with histological correlates, which show that brain maturation is a nonlinear process.
• MRI of fetal specimens with histological correlates, which show that brain maturation is also a nonlinear process in the cerebellum.
• • In vitro illustration of the multilayered appearance of the developing cerebral mantle in humans.


