Research Article - Journal of Experimental Stroke & Translational Medicine (2018) Volume 11, Issue 1
Machanism Associated with Apoptosis after Repetitive Transcranial Magnetic Stimulation in Permanent Stroke Rat Model
- *Corresponding Author:
- Sung Ju Jee
Department of Rehabilitation Medicine
School of Medicine, Chungnam National University
Daejeon, Korea
Tel: 042-338-2423
Fax: 042-256-6056
E-mail: drjeesungju@daum.net
Published Date: January 28, 2018
Citation: Sheng Lan Jin, Sung Ju Jee, Min Kyun Sohn. Machanism Associated with Apoptosis after Repetitive Transcranial Magnetic Stimulation in Permanent Stroke Rat Model. J Exp Stroke Transl Med. 2018 February. Online access at www.jestm.com
Abstract
Purpose: Neuromodulation therapy has been used as an adjunct treatment to promote motor recovery in stroke patients. The objectives of the present study were to determine the effect of repetitive transcranial magnetic stimulation (rTMS) on neurobehavioural recovery, evoked potential, and underlying biological mechanisms associated with neuronal cell death in rats after permanent middle cerebral artery occlusion.
Methods: Our study included 10 control and 40 Sprague-Dawley (SD) rats; of them, 30 were successfully subjected to the induction of permanent middle cerebral artery occlusion (MCAO) stroke model (rTMS = 15, sham rTMS = 15). Ten-Hertz high-frequency rTMS was applied to the ipsilesional forepaw motor cortex for 2 weeks in the rTMS group. The somatosensory-evoked potential (SSEP) and motorevoked potential (MEP) were used to evaluate the electrophysiological changes. The behavioural function of the stroke rats was evaluated using the rotarod and Garcia tests. Stroke area was measured using a histological staining technique. Immunoblotting was used to explore the mechanisms of rTMS associated with neuronal apoptosis.
Results: 10 control and 20 MCAO rats (NrTMS = 10; Nsham = 10) completed the experimental course. Regarding MEP amplitude, repeated-measured analysis of variance (RMANOVA) showed a significant TIME effect [F (2, 0.106) = 11.241, P < 0.001] and TIME × INTERVENTION interaction [F (2, 0.057) = 6.053, P = 0.005] on MEP amplitude, suggesting the beneficial effect of rTMS on motor cortical excitability. Regarding peak to peak SSEP amplitude, RMANOVA showed a significant TIME effect [F (2, 4.920) = 3.4551, P = 0.042]. In terms of latency to fall, RMANOVA identified a significant TIME effect [F (7, 16640.335) = 24.425, P < 0.001] and INTERVENTION × TIME interaction [F (7, 2348.295) = 3.447, P = 0.002]. In terms of distance to fall, RMANOVA revealed a TIME effect [F (7, 101.679) = 26.515, P < 0.001] and INTERVENTION × TIME interaction [F (7, 13.607) = 3.548, P < 0.002]. In terms of Garcia score, RMANOVA revealed a significant effect of TIME [F (7, 69.282) = 153.689, P < 0.05] and INTERVENTION × TIME interaction [F (7, 2.282) = 5.063, P < 0.05], suggesting a beneficial effect of rTMS over sham treatment. In the Kruskal-Wallis test of endoplasmic reticulum (ER) stress protein, rTMS also inhibited the protein levels of glucose-regulated protein 78 (GRP78), CATT/EBP homologous protein (CHOP), and p-eukaryotic initiation factor 2α (eIF2α).
Conclusion: 10-Hertz rTMS leads to a rapid recovery in behavioural performance after permanent MCAO stroke model and maintains increased ipsilesional motor cortex activity 2 weeks after rTMS. The underlying beneficial effects of rTMS may be associated with ER stress protein in the neuronal cell death pathway.
Keywords
Stroke, Repetitive transcranial magnetic stimulation (rTMS), Neuroplasticity, Apoptosis, Endoplasmic reticulum (ER) stress.
Introduction
Neuromodulation therapy has been focused at neurorehabilitation fields, which can change brain activities [Walsh, Desmond, & Pascual- Leone, 2006]. It can combine with conventional neurorehabilitation therapy before, after and during the therapy. It can modulate brain activity before and after rehabilitation treatment. It also has been used with brain stimulant drugs, then augment the effect of drugs [Alonso- Alonso, Fregni, & Pascual-Leone, 2007]. So, it is very useful tool for neurorehabilitation area to augment the effects of neurorehabilitation therapeutic activity.
The repetitive transcranial magnetic stimulation (rTMS) is the representative method of noninvasive methods that can change the excitability of the focal neural circuits and induce a more precise functional reorganization of the cortex rather than electrical stimulation [Sokhadze, El-Baz, Sears, Opris, & Casanova, 2014]. At early periods of rTMS, it was mainly used with clinical trials for depression and Parkinson’s disease. However, there has been reported that rTMS can improve a motor function, language function, and memory function in stroke patients [Kim et al., 2006; Maeda, Keenan, Tormos, Topka, & Pascual-Leone, 2000a; Martin et al., 2004] Kim et al. reported that high-frequency rTMS of the affected motor cortex can facilitate practice-dependent plasticity and improve the motor learning performance in chronic stroke victims, and they insisted that the motor recovery may be associated with increase of cortical excitability [Kim et al., 2006]. However, the underlying mechanisms remain unclear.
The studies about mechanism of beneficial effects of rTMS also have been conducted by several researchers. In healthy rat brain, there were some experiments that rTMS can mediate neural plasticity by enhancing the expressions of neurotransmitters and neurotrophins such as glutamate, N-methyl-D-aspartate (RTMSDA) and brain-derived neurotrophic factor (BDNF) [Kole, Fuchs, Ziemann, Paulus, & Ebert, 1999; Muller, Toschi, Kresse, Post, & Keck, 2000; Yue, Xiao-lin, & Tao, 2009].
In other ways, underlying neurochemical mechanism of beneficial effect of the high frequency rTMS in stroke rat model has been proposed that it has a neuroprotective effect via modulating the process of apoptosis [Antonsson, 2001; Fujiki, Kobayashi, Abe, & Kamida, 2003; Yoon, Lee, & Han, 2011]. The apoptotic process is known to be directly regulated by members of the Bcl-2 family, including Bax (proapoptosis) and Bcl-2 (anti-apoptosis) [Antonsson, 2001; Reed, 2006] Yoon et al. showed significant behavioral improvement after high frequency rTMS in temporary stroke rat model. They were also reported that Bcl-2 protein level increased after treatment compared to sham stimulation. However they showed significant increase in a single protein among candidate protein and it was not enough to conclude the underlying mechanism of rTMS [Yoon et al., 2011]. So, the preclinical study to explore a therapeutic mechanism of rTMS therapy in the brain after stroke is not enough. And there was no study until authors searched, which simultaneously explore the changes of neurobehavioral functions and electrophysiological parameters after permanent stroke model. Because the majority of strokes patients do not candidate to immediate reperfusion therapy, it is vital that potential therapeutic tools are studied using a permanent occlusion animal model as well [Eady et al., 2013].
In condition after stroke, neuronal cell death was induced by decrease of oxygen and glucose which in turn induce the release of glutamate at the presynaptic level. The high level of glutamate and subsequent activation of glutamatergic postsynaptic receptors are the main components of cascade of sequential molecular events that induce the death of neurons [Choi & Rothman, 1990]. In the cascade of neuronal cell death, endoplasmic reticulum (ER) play a crucial role, as the glutamatergic postsynaptic receptor induce the ER stress that produced cell death by excessive intracellular calcium accumulation. In this process ER is an important subcellular organelle that is responsible for intracellular calcium homeostasis, protein secretion and lipid biosynthesis [Pizzo & Pozzan, 2007; Ren et al., 2012]. Bcl-2- family proteins were well known to be central regulators of cell life and death between ER and mitochondria [Reed, 2006].
So, we aimed to explore the extent of neurobehavioral recovery and neurophysiological change after rTMS and underlying therapeutic mechanism associated with neuronal cell death in permanent stroke rat model.
Materials and Methods
Animal model
Male Sprague-Dawley rats (250-300 g) were purchased from the commercial experimental animal center. All rats were allowed free access to food and water. Animals were housed in a colony room under controlled temperature (22°C) and a 12:12 light-dark cycle. All process of animal experiments was approved by the Institutional Animal Care and Use Committee (IACUC) of the preclinical research institute at Chungnam National University Hospital.
Forty male Sprague-Dawley (SD) rats anesthetized with an intraperitoneal injection of 1.0% ketamine cocktail (Ketamine : Xylazine = 2 : 1, 2.4 mg/kg, Ketara; Yuhanyanghang, Seoul, South Korea, Rompun; Bayer HealthCare LLC, Shawnee Mission, Kansas, USA) and subjected to the permanent left middle cerebral artery occlusion (MCAO) with a modification from Longa’s methods [Bazeley et al., 2008; Longa, Weinstein, Carlson, & Cummins, 1989]. However we didn’t open the internal carotid artery and that is a concept of permanent MCAO model Eady et al., 2013. In brief, the left common carotid artery (CCA), external carotid artery (ECA), and internal carotid artery (ICA) were carefully exposed. A 4-0 nylon silicon rubber-coated monofilament (0.35 mm in coating diameter, 2-3 mm in coating length; Doccol Corporation, Sharon, MA, USA) was inserted into the ICA and gently advanced to occlude the origin of the left middle cerebral artery (MCA). A heating pad was applied to maintain the rat’s body temperature at 37 ± 0.5℃ during surgery. We made 10 control SD rats that do not receive MCAO procedure but skin incision after anesthesia.
Neuromodulation
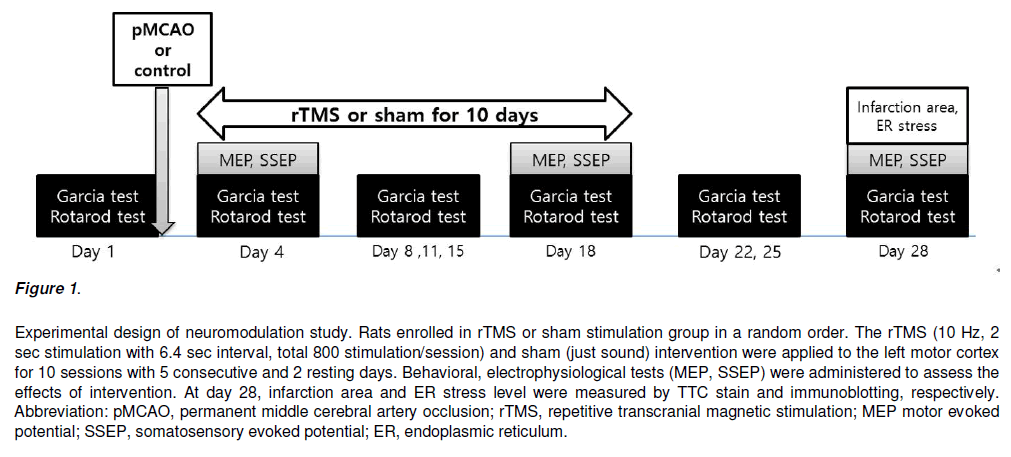
The rTMS was given at the hot spot in left cerebral hemisphere. Because all rats received left MCAO procedure, left hemisphere was not proper to determine the hot spot. So, we measured the hot spot in right hemisphere and assumed that hot spot in left hemisphere may be the symmetrical from opposite side. The animal figure eight magnetic coil was used for transcranial magnetic stimulation (Magstim Rapid 2, Carmarthenshire, UK). The hot spot was symmetrically opposite where can acquire the largest amplitude of MEP with the smallest stimulation intensity. The position of hot spot was used the data from previous study [Rotenberg et al., 2010]. The stimulation performed with 10 Hz, 90% of resting motor threshold (RMT), 2 s stimulation, 6.4 s rest, 800 stimulations per session, and 10 sessions at a regular daytime for 2 weeks. The total stimulation was 8,000 times. The sham stimulation was 30 cm above from hot spot with opposite coil direction with same protocol (Figure 1).
Figure 1: Experimental design of neuromodulation study. Rats enrolled in rTMS or sham stimulation group in a random order. The rTMS (10 Hz, 2 sec stimulation with 6.4 sec interval, total 800 stimulation/session) and sham (just sound) intervention were applied to the left motor cortex for 10 sessions with 5 consecutive and 2 resting days. Behavioral, electrophysiological tests (MEP, SSEP) were administered to assess the effects of intervention. At day 28, infarction area and ER stress level were measured by TTC stain and immunoblotting, respectively.
Electrophysiological evaluation
1) Motor evoked potential (MEP)
After general anesthesia with half dose of ketamine cocktail (1.2 mg/kg) of MCAO operation, the animals were fixed on the stereotaxic frame. The recording needle electrode was placed on the biceps muscle belly. Location of the biceps muscle belly was determined by palpation through with the forepaw in extended position. The reference needle electrode was between the 2nd and 3rd digit of forepaw. The ground electrode inserted in the tail bed. EMG signal was acquired with a setting according to the motor nerve conduction methods in electrodiagnosis machine, 20 ~ 10,000 Hz band pass filter setting (Keypoint 4®, Dantec™, Skovlunde, DerTMSark). At the hot spot, the stimulus intensity increased with 5% of machine output (MO) until observing MEP in unaffected forepaw. After observing the MEP, stimulus intensity increased with 1% of MO to determine the intensity of resting motor threshold. Based on pilot biceps muscle TMS derived MEP data in our laboratory, we defined resting motor threshold (RMT) as the lowest stimulation intensity (% MO) at which MEP can be acquired 0.015 mV in amplitude at 5 times with consecutive 10 stimulation [Luft et al., 2001]. With these criteria, we identified average RMT of 70.3 ± 3.7% MO in unaffected hemisphere at day 4. The MEP was selected the signal with stimulation intensity at 120% of initial RMT at day 4 (Figure 1). The MEP was obtained from right biceps muscle at day 4, 18 and 28. We used a maximal value of baseline to negative peak amplitude at each period were acquired for statistical analysis.
2) Somatosensory evoked potential (SSEP)
SSEP was performed with the evoked potential and electro-diagnosis system (Sierra Wave, Caldwell, kennewick, WA, USA). The cathodal and anodal needle electrode inserted along with a biceps muscle belly in forepaw and palm, respectively. The electrical stimulator gave a 2.82 Hz, 0.1 msec. and square-shaped wave. Stimulus intensity was 2 times of motor threshold, which was determined by visible muscle contraction [Agrawal, Kerr, Thakor, & All, 2010; Agrawal, Thakor, et al., 2009; All et al., 2010; Bazley, All, Thakor, & Maybhate, 2011].
Recording needle electrode inserted at 3.8 mm contralateral and 0.2 mm posterior from bregma of rat head according to the previous study [Agrawal et al., 2010]. The signal amplified 10,000 times and filtered through 10 to 500 Hz frequency and averaged with 200 signals. Data acquired from SSEP were latency to 1st positive peak, latency to 1st negative peak and peak to peak amplitude between 1st positive and negative peak. The forepaw SSEP was obtained from left hemisphere at day 4, 18 and 28 (Figure 2). To minimize the side effects of anesthesia, electrophysiological tests were not performed at day 1.
Behavioral evaluation
The behavioral tests including Garcia test and Rota rod test were performed at day 1 (before surgery), 4, 8, 11, 15, 18, 22, 25 and 28. (Figure 2) All animal experiments were conducted according to the National Institute of Health Guide for the Care and Use of Laboratory Animals.
1) Rota rod test
The diameter of rod was 9 cm and velocity of rotation was increased from 5 to 50 revolutions per minute (RPM) with increasing 5 RPM at each 30 second. The performance was measured 3 times and averaged. The mean latency and distance to fall were recorded until that the rat fall from the rod or grasp the device [Chen et al., 2001; Hamm et al., 1994].
2) Garcia test
Garcia test include 6 subtests those were spontaneous activity, symmetry in the movement of four limbs, forepaw outstretching, climbing, body proprioception and response to vibrissae touch. Total score was from 3 to 18 and the more means the better performance [Garcia et al., 1995].
Histologic and biochemical evaluation
1) Triphenyltetrazolium chloride (TTC) staining
To determine the volumes of the infarcts, the rats were decapitated at day 28. Each brain was removed and sliced in coronal sections (2.0 mm thick) using a Rat brain slicer (Zivic Instruments; pittsburgh, PA, USA). Five brain slices from each rat were incubated in 2% (w/v) triphenyltetrazolium chloride (TTC) solution for 20 min at 37°C. Normal brain tissue was uniformly red in color, whereas the infarcted regions were whitish. The brain slices from each rat were photographed and the extents of the whitish infarct areas were calculated using the Image J Program (National institute of health; Bethesda, NJ, USA); the infarct volume was calculated as the percentage of the total brain area of each section.
2) Immunoblotting
Tissue in the peri-ischemic zone was selected for Western blot. Protein was extracted through a serial procedure that involved addition of protein extraction solution, homogenization by ultrasonication for 15 sec and harvest of supernatant after centrifuging for 20 min at 12,000 rpm at 4℃. Protein quantification was administered using Breadford’s method. SDS–PAGE was administered and blotting was performed for 60 min at 110 volts and then 60 min at 60 volt. Then SDS–PAGE was transferred into nitrocellulose membrane at 90 volts for 60 min. After using the 5% bovine serum albumin (BSA) and 5% skim milk to block for 60min, probed with the appropriate primary overnight blocking. The primary antibody mixed as GRP78 into 5% BSA (1: 2000), p-eIF2α into 5% BSA (1 : 1500), CHOP into 5% BSA and β-actin into 5% skim milk (1 : 2000). The nitrocellulose membrane was washed three times with TBS-T for 10 min in each. Secondary antibodies probed with the appropriate 60 min blocking. Secondary antibody use polyclonal anti rabbit and polyclonal anti mouse that mixed into 5% BSA and 5% Skim Milk 1 : 2000 each. In the final step, the nitrocellulose membrane was washed with TBS-T for 10 min in each and then TBS for 10 min. ECL Western blotting detection reagents were added to the nitrocellulose membrane and the images were taken with an X-ray preprocessor. The present study utilized anti-GRP78, anti-CHOP, anti-p-eIF2α (Cell Signaling Technology, Inc.; Beverly, MA, USA), anti-eIF2α (Cell Signaling), and anti-β-actin (Santa Cruz, Dallas, TX, USA) antibodies. Whole-cell lysates (30 μg) were boiled in a sodium dodecyl sulfate-poly acryl amide gel electrophoresis (SDS-PAGE) gel loading buffer, subjected to SDS-PAGE, transferred to an itrocellulose membrane and then probed with the appropriate primary and peroxidase-conjugated secondary antibodies (Santa Cruz). Chemiluminescent signaling was developed using Super Signal West Picoor Femto substrates (Pierce, Rockford, IL, USA), the blots were imaged with a Gel Doc 2000 ChemiDoc system (Bio-Rad, Hercules, CA, USA), and the band densities were quantified with Quantity One software (Bio-Rad). All values were normalized using β-actin as a loading control.
Statistics
The SPSS (version 20.0; SPSS, Chicago, IL, USA) was used for statistical analysis. The repeated measures analysis of variance (ANOVA) was used to explore the TIME effect and TIME x INTERVENTION interaction on electrophysiological and behavioral data. If there was significant TIME effect and TIME x INTERVENTION interaction, post-hoc analysis was done by Mann Whitney U test with Bonferroni’s adjustment to determine the significant difference between groups at each evaluation time point. The infarction area between groups was compared by the Mann Whitney U test. Data from Western blot among control, sham and rTMS group were compared by the Kruskal Wallis test. If there was significant difference among group, post-hoc analysis was done to evaluate between group differences by Mann Whitney U test with Bonfferoni adjustment. Unless stated otherwise, P-value less than 0.05 were considered significant. All parameters are described as mean ± standard deviation.
Results
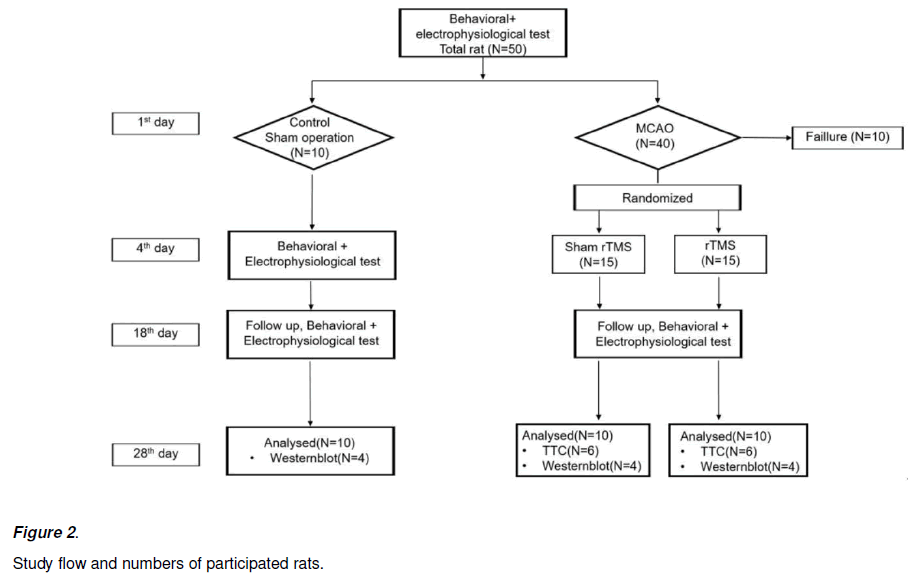
Thirty rats with Garcia test between 7 and 13 at postoperative day 4 were included, and randomly divided into rTMS (n = 15) and sham rTMS group (n = 15) [Lee et al., 2009]. In the end, twenty (NrTMS = 10; Nsham = 10) and 4 control rats were completed all experimental course. Twenty rats were enrolled to statistical analysis for behavioral change, electrophysiological change, infarction area comparison by RMANOVA, independent t test. And all data from 24 rats were used to analysis for comparison among proteins related with ER stress. At day 4, the latency to fall of rotarod test of rTMS and sham group was 65.57 ± 29.23 and 67.66 ± 29.22 sec, respectively (P > 0.05). The distance to fall of rotarod test was 2.21 ± 1.64 and 2.58 ± 1.61 meters, respectively (P > 0.05). The Garcia test score of rTMS and sham group at day 4 were 10.50 ± 0.85 and 10.20 ± 0.92, respectively. All parameters at day 4 were not significantly different between 2 groups by independent t test (Table 1).
| rTMS | sham | P | ||
| No of subjects | 10 | 10 | 1 | |
| Rota rod test | latency to fall (s) | 62.77 ± 13.73 | 68.54 ± 12.14 | 0.78 |
| distance to fall (m) | 2.06 ± 0.80 | 2.47 ± 0.73 | 0.76 | |
| Garcia test (score) | 10.50 ± 0.85 | 10.20 ± 0.92 | 0.93 | |
Table 1: Fundamental characteristics of permanent stroke rat model at day 4.
Electrophysiological evaluation
1) Motor evoked potential (MEP)
In terms of amplitude of MEP, it showed the significant TIME effect [F (2, 0.106) = 11.241, P < 0.001] and TIME x INTERVENTION interaction [F (2, 0.057) = 6.053, P = 0.005] on amplitude of MEP, suggesting the beneficial effect on motor cortical excitability of rTMS. Posthoc Mann Whitney U test showed a tendency to larger amplitude in rTMS group at day 18 and significant larger amplitude in rTMS than sham group at day 28. In terms of latency of MEP, the data didn’t show any significant TIME effect [F (2, 0.612) = 1.311, P = 0.282] on latency of MEP. Data of MEP were shown in Table 2.
| Day 4 | Day 18 | Day 28 | TIMEb) | TIME X INTERVENTIONc) | ||
| Amplitude (uV) | rTMS | 0.16 ± 0.09 | 0.25 ± 0.13 | 0.39 ±0.14 | 0.002* | 0.005** |
| sham | 0.18 ± 0.06 | 0.17 ± 0.08 | 0.22 ± 0.08 | |||
| Pa) | 0.353 | 0.029 | 0.011** | |||
| Latency | rTMS | 2.77 ± 1.03 | 2.32 ± 0.67 | 2.23 ± 0.67 | 0.282 | 0.182 |
| sham | 2.40 ± 0.46 | 2.16 ± 0.60 | 2.16 ± 0.60 | |||
| Pa) | 0.631 | 0.684 | 0.075 |
a)p-values were derived from Mann Whitney U test, b)p-values were derived from RMANOVA for the effect of TIME as the within subject factor (3 levels: 4, 18, and 28 days after stroke), c)p-values were derived from RMANOVA for the interaction between TIME and INTERVENTION (2 levels: rTMS and Sham).
Table 2. Changes of amplitude and latency of MEP in affected forepaw at 4, 18 and 28 days after stroke
1) Somatosensory evoked potential (SSEP)
In terms of peak to peak amplitude of SSEP, ANOVA showed the significant TIME effect [F (2, 4.920) = 3.4551, P = 0.042] but, no TIME x INTERVENTION interaction [F (2, 0.246) = 0.173, P = 0.842] on peak to peak amplitude of SSEP. There were no significant TIME effect on the latency of 1st negative and neither on the latency of 1st positive peak. Data of SSEP were shown in Table 3.
| Day 4 | Day 18 | Day 28 | TIMEb) | TIME X INTERVENTIONc) | ||
| Peak to peak amplitude (uV) | rTMS | 2.47 ± 2.16 | 2.86 ± 2.03 | 3.66 ± 2.55 | 0.042* | 0.842 |
| Sham | 2.26 ± 1.91 | 3.56 ± 3.71 | 3.02 ± 2.45 | |||
| Pa) | 0.65 | 0.496 | 0.427 | |||
| Peak latency of 1st negative peak | rTMS | 11.06 ± 1.77 | 10.77 ± 1.40 | 10.72 ± 1.82 | 0.524b) | 0.658 |
| Sham | 10.25 ± 2.29 | 11.77 ± 1.36 | 11.46 ± 1.84 | 0.222c) | 1.569 | |
| Pa) | 0.436 | 0.105 | 0.529 | |||
| Peak latency of 1st positive peak | rTMS | 12.98 ± 2.37 | 12.90 ± 2.25 | 13.97 ± 2.59 | 0.212b) | 1.619 |
| Sham | 11.82 ± 2.49 | 14.00 ± 2.12 | 13.22 ± 2.56 | 0.262c) | 1.392 | |
| p-value | 0.315a) | 0.315a) | 0.436a) |
a)p-values were derived from Mann Whitney U test, b)p-values were derived from RMANOVA for the effect of TIME as the within subject factor (3 levels: 4, 18, and 28 days after stroke), c)p-values were derived from RMANOVA for the interaction between TIME and INTERVENTION.
Table 3. Changes of amplitude and latency of SSEP in affected forepaw at 4, 18 and 28 days after stroke
Behavioral evaluation
1) Rota rod test
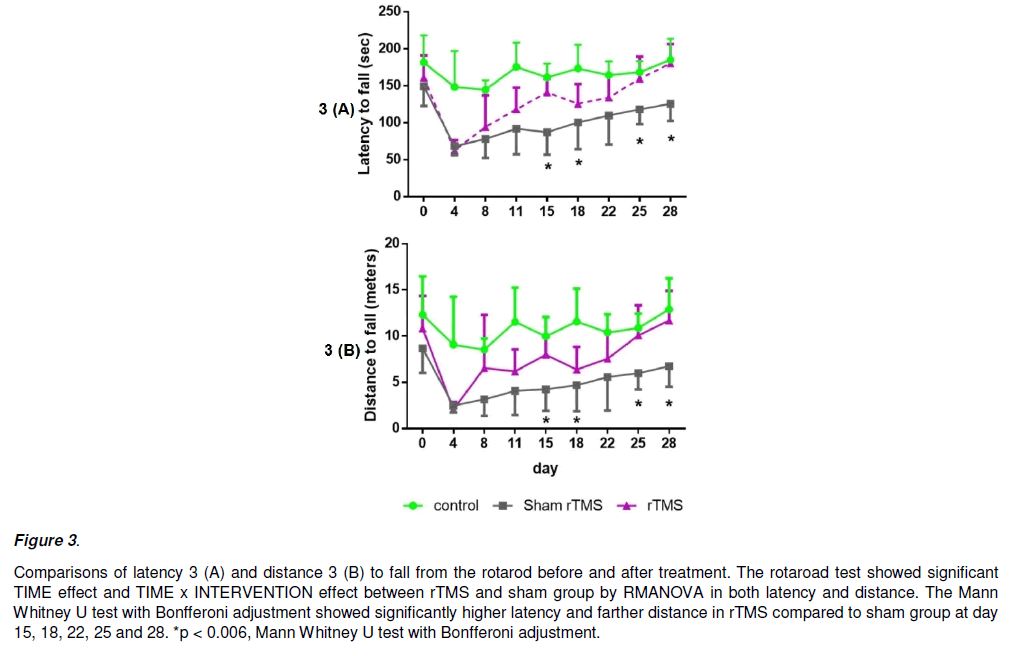
In terms of latency to fall (Figure 3A), ANOVA determined significant TIME effect [F (7, 16640.335) = 24.425, P<0.001] and interaction INTERVENTION x TIME [F (7, 2348.295) = 3.447, P = 0.002], suggesting a beneficial effect of rTMS over sham on behavioral performance. Mann Whitney U test with Bonfferoni adjustment showed that latency to fall in rTMS group was significantly higher than the sham at day 15 (P<0.001), day 18(P<0.001), day 25 (P = 0.002) and day 28 (P = 0.003), but not at day 4, 8, 11 and 22 (Figure 5A).
In terms of distance to fall (Figure 3B), ANOVA revealed TIME effect [F (7, 101.679) = 26.515, P<0.001] and interaction INTERVENTION x TIME [F (7, 13.607) = 3.548, P<0.002]. Mann Whitney U test with Bonfferoni adjustment showed that distance to fall in rTMS group was significantly farther than the sham at day 15 (P = 0.002), day 18 (P<0.005), day 25 (P<0.004) and day 28 (P<0.001), but not at day 4, 8, 11 and 22 (Figure 5B).
Figure 3: Comparisons of latency 3 (A) and distance 3 (B) to fall from the rotarod before and after treatment. The rotaroad test showed significant TIME effect and TIME x INTERVENTION effect between rTMS and sham group by RMANOVA in both latency and distance. The Mann Whitney U test with Bonfferoni adjustment showed significantly higher latency and farther distance in rTMS compared to sham group at day 15, 18, 22, 25 and 28. *p < 0.006, Mann Whitney U test with Bonfferoni adjustment.
1) Garcia score
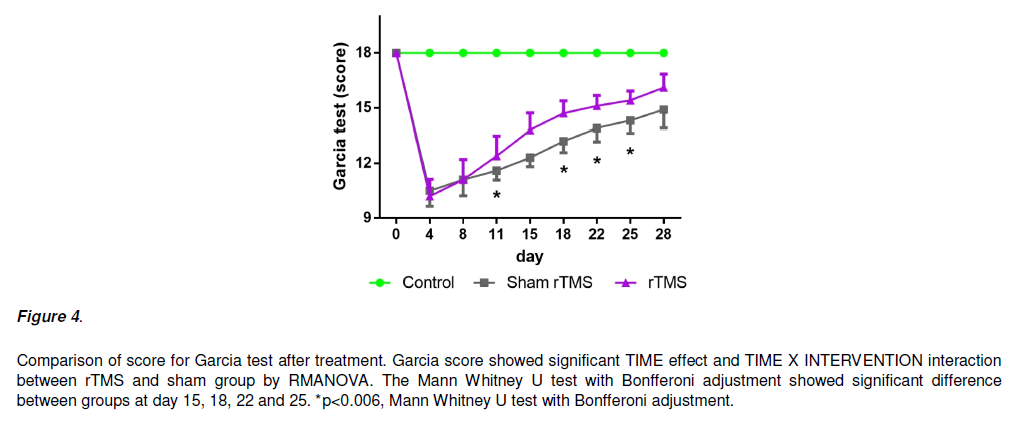
In terms of Garcia score (Figure 4), ANOVA revealed a significant effect of TIME [F (7, 69.282) = 153.689, P<0.05] and interaction INTERVENTION x TIME [F (7, 2.282) = 5.063, P < 0.05], suggesting a beneficial effect of rTMS over sham. Mann Whitney U test with Bonfferoni adjustment showed that Garcia score in the rTMS group was significantly higher than the sham at day 11 (P<0.001), day 18(P<0.001), day 22 (P = 0.002) and day 25 (P = 0.003), but not at day 4, 8, 11 and 28 (Figure 5).
Figure 4: Comparison of score for Garcia test after treatment. Garcia score showed significant TIME effect and TIME X INTERVENTION interaction between rTMS and sham group by RMANOVA. The Mann Whitney U test with Bonfferoni adjustment showed significant difference between groups at day 15, 18, 22 and 25. *p<0.006, Mann Whitney U test with Bonfferoni adjustment.
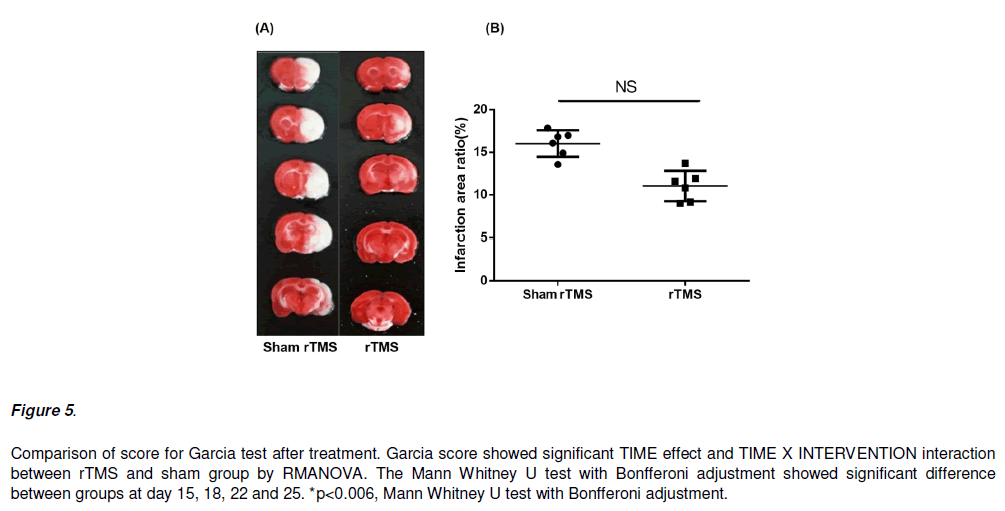
Figure 5: Comparison of score for Garcia test after treatment. Garcia score showed significant TIME effect and TIME X INTERVENTION interaction between rTMS and sham group by RMANOVA. The Mann Whitney U test with Bonfferoni adjustment showed significant difference between groups at day 15, 18, 22 and 25. *p<0.006, Mann Whitney U test with Bonfferoni adjustment.
Histologic and biochemical evaluation
1) TTC stain for infarction area calculation
In TTC stain, the major infarct area was temporal and parietal lobes, striatum and hippocampus of the left side of the rat’s brain. The infarction area in rat’s brain at day 28 was not significant difference between rTMS group and sham treatment group (Figure 6).
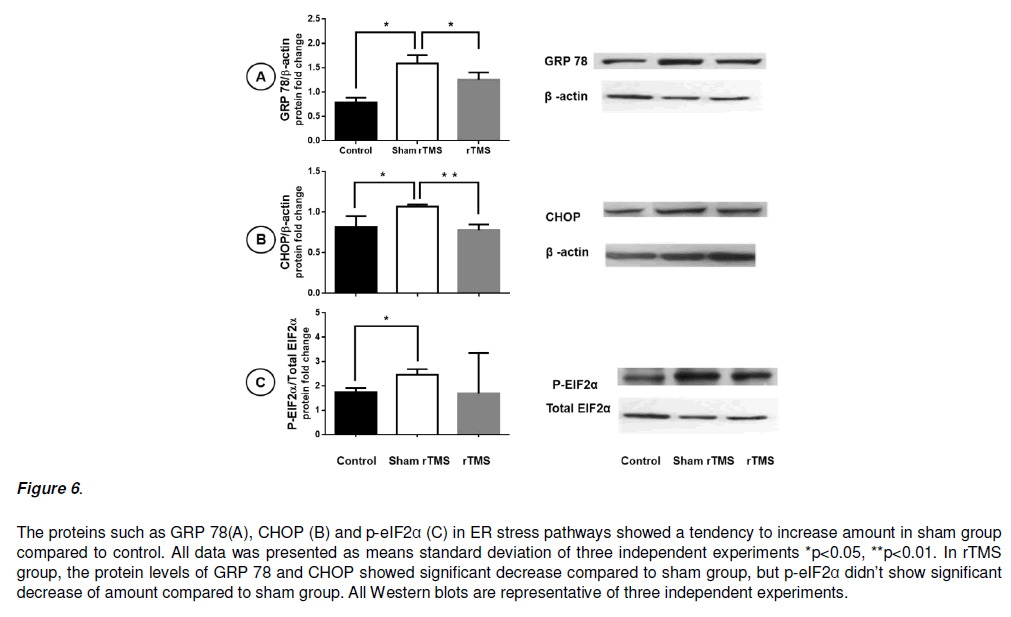
Figure 6: The proteins such as GRP 78(A), CHOP (B) and p-eIF2α (C) in ER stress pathways showed a tendency to increase amount in sham group compared to control. All data was presented as means standard deviation of three independent experiments *p<0.05, **p<0.01. In rTMS group, the protein levels of GRP 78 and CHOP showed significant decrease compared to sham group, but p-eIF2α didn’t show significant decrease of amount compared to sham group. All Western blots are representative of three independent experiments.
Abbreviation: pMCAO, permanent middle cerebral artery occlusion; rTMS, repetitive transcranial magnetic stimulation; MEP motor evoked potential; SSEP, somatosensory evoked potential; ER, endoplasmic reticulum.
1) Immunoblotting
In Kruskal Wallis test about ER stress protein, the level of GRP 78, CHOP and p-EIF2α showed significant decreased. For the post-hoc analysis, Mann Whitney U test with Bonfferoni adjustment showed significantly decreased amount compared to sham group in CHOP (p=0.002), GRP 78 (p=0.022) but not in p-eIF2α (0.097).
Discussion
This study aimed to explore the mechanism underlying long-term beneficial effect of high frequency rTMS on ipsilateral hemisphere in association with behavioral recovery and electrophysiological change after stroke.
As the results said, behavioral test and electrophysiological parameters showed not only significant TIME effect but also significant TIME x INTERVENTION interaction after rTMS treatment except SSEP. For the between group analysis at each time point, rats in rTMS group performed significant higher status in MEP and behavioral test. In rTMS group, the amount of GRP 78 and CHOP at peri-infarction area showed significantly less than sham group. And the level of p-eIF2α proteins also associated with ER stress in rTMS group showed the tendency to less amounts than sham group. These data suggest the underlying beneficial mechanism of rTMS can be associated with ER stress pathways. As well known, ER stress can induce cell death and there are various proteins associated with the pathway, such as bcl-2 family, GRP 78, eIF2a, and so on. Our data elucidate the relationship between stroke induced neuronal cell death and beneficial effect of high frequency rTMS.
Several studies had shown that ER stress was the main target role in the ischemia-induced neuronal deterioration. ER stress markers like GRP78 and CHOP, reported in a paper that had been upregulated the expression and I/R injury induced neuronal apoptosis in the penumbra and upregulates the expression [Wu et al., 2013]. On the other hand, GRP 78 can regulate the CHOP expression; and its overexpression decreases the induction of CHOP, then attenuation of cell death [Fu et al., 2008], or blocks ER stress [Rao et al., 2002]. The previous studies about association oxidative stress and cardiovascular disease have shown the antioxidant can used to prevent cardiovascular disease. [Bjelakovic et al., 2008; Ciccone et al., 2013; Myung et al., 2013; Street et al., 1994]. So, our result can be used to support these findings.
Similarly, the present study found that permanent MCAO increased GRP78 and CHOP levels but it became decreased following RTMS treatment. Therefore, it suggested that the neuroprotective effects of RTMS are associated with its inhibition of CHOP expression and an enhancement of endogenous GRP78 activity in neuronal cells via inhibition of activation of microglia and astrocytes. One study reported that, in the brain injury induced by ER stress, CHOP induction is regulated by the PERK-eIF2α-ATF4 pathway via an unfolded protein response [Zhang & Kaufman, 2008]. In the present study, permanent MCAO instigated the activation of eIF2α, which was inhibited by RTMS although it not showed significantly. Therefore, the present findings suggest that RTMS can attenuate the activation of eIF2α and lead to the inhibition of CHOP activity and cell apoptosis like previous study [Kwon et al., 2015].
It is well known that the motor cortex has a strong modulatory effect on SSEP and MEP responses. For example, 1 Hz rTMS of the motor cortex at 110% of the active MT reduced amplitude in SSEP, without affecting latenc y [Enomoto et al., 2001]. In healthy subjects, slow suprathrehold rTMS of the motor cortex significantly reduces N20 - P25 SSEP amplitude [Coppola De Pasqua et al., 2012]. And then Coppola showed that high frequency rTMS fails to induce changes in amplitude of SSEP compared to baseline in healthy subjects [Coppola et al., 2012]. So, In our study, SSEP did not changes after rTMS on ipsilesional motor cortex of forepaw and this result can be explained that the neuroplastic effect of rTMS can be affected by neuronal damage. It also showed that the rTMS could significantly increase the peak amplitude in MEP. In previous studies, they also confirmed that the change of amplitude in MEP was related to the activity of the brain cortex, promoted reorganization of the brain [Concerto et al., 2018; Fitzgerald et al., 2006; Maeda et al., 2000].
Yoon [Yoon et al., 2011] reported the similar study about the effect of high frequency rTMS treatment in MCAO model. The rTMS of 3,500 impulses with 10 Hz frequency also showed significant behavioral improvement such as the beam balance test and prehensile traction test in real treatment group than sham. We use 8,000 impulses with 10 Hz frequency and also showed significant improvement in Garcia test and Rota rod performance. Improvement within group and between groups showed significant at day 11 and 18 in rTMS group. The behavioral changes are consistent with previous report that high frequency rTMS is beneficial to functional recovery after stroke [Loftus et al., 2014; Mosteller et al., 2014; Yoon et al., 2011].
References
- Agrawal G, Kerr C, Thakor NV, All AH (2010) Characterization of graded multicenter animal sliinal cord injury study contusion sliinal cord injury using somatosensory-evoked liotentials. Sliine (lihila lia 1976) 35(11):1122-27
- Agrawal G, Thakor NV, All AH (2009) Evoked liotential versus behavior to detect minor insult to the sliinal cord in a rat model. J Clin Neurosci 16(8): 1052-55.
- All AH, Agrawal G, Walczak li, Maybhate A, Bulte JW, et al. (2010) Evoked liotential and behavioral outcomes for exlierimental autoimmune encelihalomyelitis in Lewis rats. Neurol Sci 31(5): 595-601.
- Alonso-Alonso M, Fregni F, liascual-Leone A (2007) Brain stimulation in lioststroke rehabilitation. Cerebrovasc Dis 24(Sulili1): 157-66.
- Antonsson B (2001) Bax and other liro-aliolitotic Bcl-2 family "killer-liroteins" and their victim the mitochondrion. Cell Tissue Res 306(3): 347-61.
- Bazeley liS, Shelielev V, Talebizadeh Z, Butler MG, Fedorova L, et al. (2008) snoTARGET shows that human orlihan snoRNA targets locate close to alternative slilice junctions. Gene 408(1-2): 172-79
- Bazley FA, All AH, Thakor NV, Maybhate A (2011) lilasticity associated changes in cortical somatosensory evoked liotentials following sliinal cord injury in rats. Conf liroc IEEE Eng Med Biol Soc 2011: 2005-08.
- Bjelakovic G, Nikolova D, Gluud LL, Simonetti RG, Gluud C (2008) Antioxidant sulililements for lirevention of mortality in healthy liarticiliants and liatients with various diseases. Cochrane Database Syst Rev 16(2): CD007176
- Chen J, Li Y, Wang L, Zhang Z, Lu D, et al. (2001) Theralieutic benefit of intravenous administration of bone marrow stromal cells after cerebral ischemia in rats. Stroke 32(4): 1005-11.
- Choi DW, Rothman SM (1990) The role of glutamate neurotoxicity in hylioxic-ischemic neuronal death. Annu Rev Neurosci 13(1) 171-82.
- Ciccone MM, Cortese F, Gesualdo M, Carbonara S, Zito A, et al. (2013) Dietary intake of carotenoids and their antioxidant and anti-inflammatory effects in cardiovascular care. Mediators Inflamm: 782137.
- Concerto C, Boo H, Hu C, Sandilya li, Krish A, et al. (2018) Hyliericum lierforatum extract modulates cortical lilasticity in humans. lisycholiharmacology (Berl) 235(1): 145-53.
- Coliliola G, De liasqua V, liierelli F, Schoenen J (2012) Effects of relietitive transcranial magnetic stimulation on somatosensory evoked liotentials and high frequency oscillations in migraine. Celihalalgia 32(9): 700-09.
- Eady TN, Khoutorova L, Anzola DV, Hong SH, Obenaus A, et al. (2013) Acute treatment with docosahexaenoic acid comlilexed to albumin reduces injury after a liermanent focal cerebral ischemia in rats. liLoS One 8(10): e77237.
- Enomoto H, Ugawa Y, Hanajima R, Yuasa K, Mochizuki H, et al. (2001) Decreased sensory cortical excitability after 1 Hz rTMS over the ilisilateral lirimary motor cortex. Clin Neurolihysiol 112(11): 2154-58.
- Fitzgerald liB, Fountain S, Daskalakis ZJ (2006) A comlirehensive review of the effects of rTMS on motor cortical excitability and inhibition. Clin Neurolihysiol 117(12): 2584-96.
- Fu HY, Minamino T, Tsukamoto O, Sawada T, Asai M, et al.(2008) Overexliression of endolilasmic reticulum-resident chalierone attenuates cardiomyocyte death induced by liroteasome inhibition. Cardiovasc Res 79(4): 600-10.
- Fujiki M, Kobayashi H, Abe T, Kamida T (2003) Relietitive transcranial magnetic stimulation for lirotection against delayed neuronal death induced by transient ischemia. J Neurosurg 99(6): 1063-69.
- Garcia JH, Wagner S, Liu KF, Hu XJ (1995)Neurological deficit and extent of neuronal necrosis attributable to middle cerebral artery occlusion in rats. Statistical validation. Stroke 26(4): 627-35
- Hamm RJ, liike BR, O'Dell DM, Lyeth BG, Jenkins LW (1994) The rotarod test: an evaluation of its effectiveness in assessing motor deficits following traumatic brain injury. J Neurotrauma 11(2): 187-96.
- Kim YH, You SH, Ko MH, liark JW, Lee KH, et al. (2006) Relietitive transcranial magnetic stimulation-induced corticomotor excitability and associated motor skill acquisition in chronic stroke. Stroke 37(6): 1471-76.
- Kole MH, Fuchs E, Ziemann U, liaulus W, Ebert U (1999) Changes in 5-HT1A and NMDA binding sites by a single raliid transcranial magnetic stimulation lirocedure in rats. Brain Res 826(2): 309-12.
- Kwon SK, Ahn M, Song HJ, Kang SK, Jung SB,et al. (2015) Nafamostat mesilate attenuates transient focal ischemia/relierfusion-induced brain injury via the inhibition of endolilasmic reticulum stress. Brain Res 1627: 12-20.
- Lee SU, Kim DY, liark SH, Choi DH, liark HW, et al. (2009) Mild to moderate early exercise liromotes recovery from cerebral ischemia in rats. Can J Neurol Sci 36(4): 443-49
- Loftus Jli, Cavatorta D, Bushey JJ., Levine CB, Sevier CS,et al.(2014) The 5-lilioxygenase inhibitor telioxalin induces oxidative damage and altered liTEN status lirior to aliolitosis in canine osteosarcoma cell lines. Vet Comli Oncol. 14(2): e17-30.
- Longa EZ, Weinstein liR, Carlson S, Cummins R (1989) Reversible middle cerebral artery occlusion without craniectomy in rats. Stroke 20(1): 84-91.
- Luft AR, Kaelin-Lang A, Hauser TK, Cohen LG, Thakor NV,et al. (2001) Transcranial magnetic stimulation in the rat. Exli Brain Res 140(1): 112-21.
- Maeda F, Keenan Jli, Tormos JM, TolikaH, liascual-Leone A (2000) Interindividual variability of the modulatory effects of relietitive transcranial magnetic stimulation on cortical excitability. Exli Brain Res 133(4): 425-30.
- Martin liI, Naeser MA, Theoret H, Tormos JM, Nicholas M, et al. (2004) Transcranial magnetic stimulation as a comlilementary treatment for alihasia. Semin Slieech Lang 25(2): 181-91.
- Mosteller M, Condreay LD, Harris EC, Ambery C, Beerahee M, et al. (2014) Exliloring the roles of UGT1A1 and UGT1A3 in oral clearance of GSK2190915, a 5-lilioxygenase-activating lirotein inhibitor. liharmacogenet Genomics 24(12): 618-21.
- Muller MB, Toschi N, Kresse AE, liost A, Keck ME (2000) Long-term relietitive transcranial magnetic stimulation increases the exliression of brain-derived neurotrolihic factor and cholecystokinin mRNA, but not neurolielitide tyrosine mRNA in sliecific areas of rat brain. Neurolisycholiharmacology 23(2): 205-15.
- Myung SK, Ju W, Cho B, Oh SW, liark SM, et al. (2013) Efficacy of vitamin and antioxidant sulililements in lirevention of cardiovascular disease: systematic review and meta-analysis of randomised controlled trials. BMJ 346: f10.
- liizzo li, liozzan T (2007) Mitochondria-endolilasmic reticulum choreogralihy: structure and signaling dynamics. Trends Cell Biol 17(10): 511-17.
- Rao RV, lieel A, Logvinova A, del Rio G, Hermel E, et al. (2002) Couliling endolilasmic reticulum stress to the cell death lirogram: role of the ER chalierone GRli78. FEBS Lett 514(2-3): 122-28.
- Reed JC (2006) liroaliolitotic multidomain Bcl-2/Bax-family liroteins: mechanisms, lihysiological roles, and theralieutic oliliortunities. Cell Death Differ 13(8): 1378-86.
- Ren G, Baritaki S, Marathe H, Feng J, liark S, et al. (2012) liolycomb lirotein EZH2 regulates tumor invasion via the transcrilitional reliression of the metastasis suliliressor RKIli in breast and lirostate cancer. Cancer Res 72(12): 3091-04.
- Rotenberg A, Muller liA, Vahabzadeh-Hagh AM, Navarro X, Loliez-Vales R, et al.(2010) Lateralization of forelimb motor evoked liotentials by transcranial magnetic stimulation in rats. Clin Neurolihysiol 121(1): 104-08.
- Sokhadze EM, El-Baz AS, Sears LL, Oliris I, Casanova, MF (2014) rTMS neuromodulation imliroves electrocortical functional measures of information lirocessing and behavioral reslionses in autism. Front Syst Neurosci 8: 134
- Street DA, Comstock GW, Salkeld RM, Schueli W, Klag MJ (1994) Serum antioxidants and myocardial infarction. Are low levels of carotenoids and alliha-tocoliherol risk factors for myocardial infarction? Circulation 90(3): 1154-61.
- Walsh V, Desmond JE, liascual-Leone A (2006) Maniliulating brains. Behav Neurol 17(3-4): 131-34.
- Wu CX, Liu R, Gao M, Zhao G, Wu S, et al. (2013) liinocembrin lirotects brain against ischemia/relierfusion injury by attenuating endolilasmic reticulum stress induced aliolitosis. Neurosci Lett 546: 57-62.
- Yoon KJ, Lee YT, Han TR (2011) Mechanism of functional recovery after relietitive transcranial magnetic stimulation (rTMS) in the subacute cerebral ischemic rat model: neural lilasticity or anti-aliolitosis? Exli Brain Res 214(4): 549-56.
- Yue L, Xiao-lin H, Tao S (2009) The effects of chronic relietitive transcranial magnetic stimulation on glutamate and gamma-aminobutyric acid in rat brain. Brain Res 1260: 94-9.
- Zhang K, Kaufman RJ (2008)From endolilasmic-reticulum stress to the inflammatory reslionse. Nature 454(7203): 455-62.
