Review Article - Imaging in Medicine (2012) Volume 4, Issue 5
Diffusion-weighted MRI techniques for the evaluation of focal hepatic lesions
Ercan Kocakoç*1, Mehmet Ruhi Onur2 & Asli Serter11Department of Radiology, Faculty of Medicine, Bezmialem Vakif University, 34093, Istanbul, Turkey
2Department of Radiology, Faculty of Medicine, Firat University, Elazig, Turkey
- Corresponding Author:
- Ercan Kocakoç
Department of Radiology
Faculty of Medicine, Bezmialem Vakif University
34093, Istanbul, Turkey
Tel: +90 212 453 1700
Fax: +90 212 621 7580
E-mail: ercankocakoc@yahoo.com
Abstract
Diffusion-weighted (DW) MRI has been more frequently used in abdominal imaging with the introduction of echo-planar imaging and parallel imaging techniques that reduce the examination time and eliminate time-related artifacts. Detection of focal hepatic lesions can be accomplished by visual assessment of signal changes on DW images. Diffusion characteristics of focal hepatic lesions are represented by quantitative apparent diffusion coefficient values. Utility of DW-MRI as a complementary imaging method in evaluation of focal hepatic lesions depends on comparison between the results of DW-MRI and conventional MRI sequences. Detection and characterization of focal hepatic lesions in DW-MRI will be reliable with the advances in MRI technology that provide high-quality images and avoid artifacts.
Keywords
abscess ▪ apparent diffusion coefficient ▪ diffusion-weighted MRI ▪ focal nodular hyperplasia ▪ hemangioma ▪ hepatic cyst ▪ hepatic lesion ▪ hepatocellular carcinoma ▪ metastasis
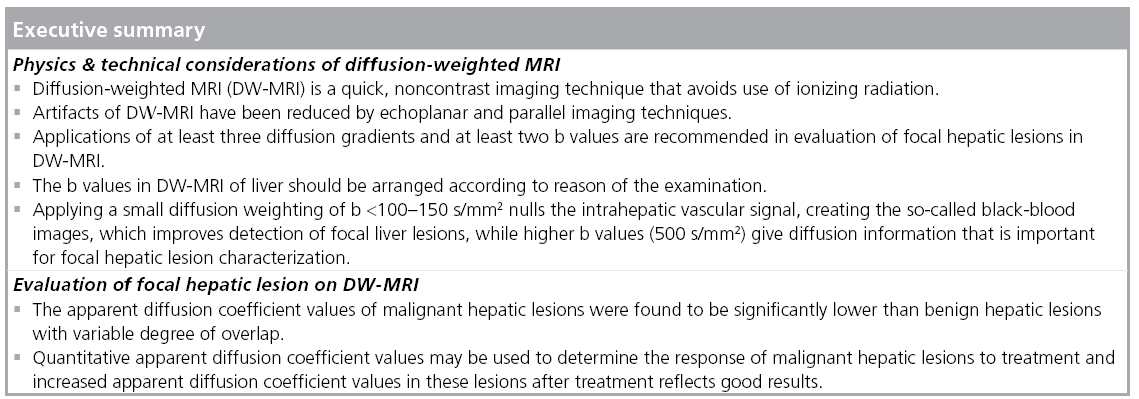
Recent advances in MRI technology enabled diffusion-weighted (DW) MRI as a helpful tool in the evaluation of diffuse and focal liver diseases. DW-MRI does not require ionizing radiation and iodinated contrast media. It is a fast imaging method that can be performed within a breath-hold time. Introduction of echo-planar imaging (EPI) and parallel imaging methods has increased the number of DW-MRI examinations in abdominal imaging by decreasing examination time and time-related artifacts. Evaluation of focal hepatic lesions has been emphasized in several DW-MRI studies [1–6].
DW-MRI examinations should be performed using appropriate scanning techniques and acquisition parameters. In this review, technical considerations and acquisition parameters of DW-MRI are presented. Detection and characterization of focal hepatic lesions in DW-MRI by visual assessment and quantitative evaluation are also summarized.
Physics & technical considerations of DW-MRI
In biological tissues, water molecules have thermally induced random motion, which is called Brownian motion [2]. The combination of Brownian motion and pseudodiffusion that results from the perfusion effect of microcapillary perfusion is called intravoxel incoherent motion, which is represented by the apparent diffusion coefficient (ADC) value [7]. DW-MRI is based on the measurement of such molecular motion, and contrast differences in this imaging technique depend on the different movements of water molecules in various biological tissues. Restriction of diffusion creates significant contrast between different tissues in DW-MRI. This restriction usually originates from high cellularity and deformed cellular membrane integrity, such as in tumors [8]. In cystic and necrotic tissues, water molecules move without restriction, resulting in increased diffusion [9]. This is also dependent on the amount of water within the lesion. If the amount of water within the lesion is higher, then the diffusivity is also higher [7]. A recent study using phantom test tubes containing different concentrations of sucrose and water demonstrated that if the concentration of sucrose increased, then the diffusivity would be lower, causing higher signal intensity (SI) in diffusion-weighted imaging (DWI) [7].
DWI can be performed with various diffusion gradients. The strength of diffusion gradients is represented by b values. Increased b values reflect increased strength of diffusion gradient. Applications of at least three diffusion gradients and at least two b values are recommended in the evaluation of focal liver lesions in DW-MRI [10]. Three gradient directions (x: pointing from floor to ceiling, y: from left to right when standing in front of the magnet and z: from feet to head) are sufficient to estimate the diffusion characteristics of water molecules in biological tissues. However, diffusion tensor imaging requires six or more gradient directions.
Diffusion of water molecules in biological tissues can be evaluated by visual assessment, as well as with quantitative parameters. Visual assessment of DWIs depends on observation of signal changes in DW-MRI. Unrestricted diffusion results in signal loss of DW-MRI, whereas restriction of diffusion results in increased SI. Because of the microcapillary perfusion, the degree of signal drop of the focal liver lesions with all increasing b values is nonlinear [11–14]. Quantitative evaluation of water diffusion depends on measurement of ADC values. Quantitative ADC values can be calculated using monoexponential fitting of DW-MRI data with a linear regression analysis of the function S = S0 × exp (-b × ADC), where b is the diffusion factor, S is the SI after application of the diffusion gradient and S0 represents SI at b = 0 s/mm2 [15]. The ADC value reflects the decrease in logarithm of relative SI with increasing strength of motion probing gradient (b value). The ADC values are calculated automatically in most commercial MRI systems with a monoexponential function. In the monoexponential method, the amount of decreased signal in DWI is accepted as directly proportional to the strength of the diffusion gradient. However, clinical and phantom studies demonstrated that at low diffusion gradients (b value <100 s/mm2), measured signal attenuation results from water diffusion and microcirculation within the microcapillaries, which causes a sudden decrease in signal attenuation at these diffusion gradients. The biexponential method measures both the perfusion and tissue-diffusion effects in DW-MRI [9]. Increased diffusion of water molecules cause increased ADC values. The decreased ADC values represent restricted diffusion. High b values yield more accurate ADC values in evaluation of diffusion properties of tissues because microcapillary perfusion accounts for only a small proportion of the measured signal on DW images obtained with high b values [9]. Low b values provide higher ADC values because the SI, due to diffusion, plays only a minor role in these gradients, and microcapillary perfusion increases ADC values [11].
Biological tissues can be classified into isotropic or anisotropic tissues in terms of diffusion properties. In isotropic tissues, water molecules diffuse in every direction opposite to anisotropic tissues, in which diffusion occurs in only one direction. Liver parenchyma has an isotropic diffusion pattern unlike that found in the brain or kidney [16–18]. The isotropic diffusion property of the liver indicates that the use of multidirectional diffusion gradients is unnecessary for the design of DW-MRI studies of the liver [3]. Taouli et al. reported that two b values in one direction could be sufficient for the design of DW-MRI sequences in the liver. In their study, they measured the ADC values of liver parenchyma and focal hepatic lesions in three directions (frequency-encoding [x], phase-encoding [y], and section-select [z] directions) and found small nonsignificant differences between the ADCs measured in all three directions. In addition, comparison of ADC values of three directions and a separate sequence performed with unidirection yielded no significant differences [3]. If DW-MRI of the liver is performed by applying tridirectional diffusion gradients (along each of the three directions: x, y and z), the average DW image (trace) of these three directions is generally used for evaluation signal changes and ADC measurements. It should be kept in mind that at least two or more b values should be obtained to measure ADC values in tissues.
Acquisitions
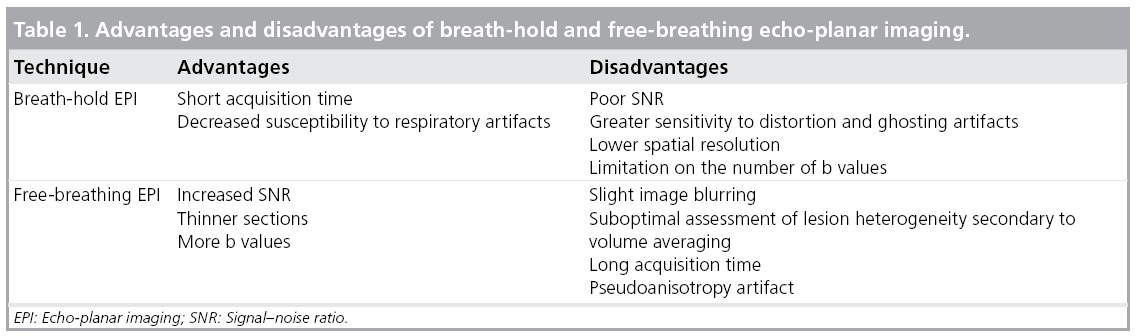
The most frequently used technique in DW-MRI of the abdomen is single-shot spinecho EPI (SS-EPI) with fat-supression [19,20]. The EPI sequence is a fast imaging method that can complete signal collection of single images within a single acquisition period. This short acquisition period minimizes the effect of gross physiologic motion from respiration and cardiac movement [2]. In EPI, fat suppression reduces chemical shift artifacts. Breathhold or free-breathing mode can be used with EPI. Breath-hold SS-EPI is the most frequently used technique in the evaluation of the liver. The advantages and disadvantages of breathhold and free-breathing mode DW-MRI are summarized in Table 1. Multiple signal averaging with respiratory and/or cardiac triggering may be used to reduce the effects of motion in free-breathing SS-EPI [5,10,21]. Multiple signal averaging in free-breathing SS-EPI results in increased signal–noise ratio (SNR). Combination of respiratory triggering and free-breathing SS-EPI can be used, which can provide high-quality images with good anatomic detail. Sensitivity of respiratory-triggered DW-MRI in detection of focal liver lesions was found to be higher (93.7%) than breath-hold DW-MRI (84.3%), secondary to improved image quality, SNR and ADC quantification in respiratory-triggered DW-MRI [21,22]. Kandpal et al. compared the respiratorytriggered and breath-hold DW-MRI of focal hepatic lesions and concluded that SNR of normal liver and contrast–noise ratio of metastases, hepatocellular carcinomas (HCCs) and abscesses in respiratory-triggered DW-MRI were significantly better than in breath-hold DW-MRI [5]. Disadvantages of respiratorytriggered DW-MRI are long acquisition time and pseudo-anisotropy artifact, which may cause errors in ADC calculation [23]. The ADC values obtained in breath-hold and respiratory-triggered images do not differ significantly [24].
Spectral attenuated inversion recovery or chemical excitation with spectral suppression techniques may be used to suppress the signal of fat tissue in DW-MRI of liver [10]. It has been reported that administration of gadopentetate dimeglumine does not significantly affect SNR and contrast–noise ratio of DW images. ADC values may decrease in contrast-enhanced DW images, but no significant difference was found between ADC values of focal hepatic lesions in unenhanced and enhanced DW images [25,26].
■ Diffusion gradients: b values
DW-MRI studies of liver can be conducted with different b values. There is no consensus regarding which gradients are most useful in the evaluation of focal hepatic lesions. However, imaging with at least three b values, including both lower and higher b values (e.g., using b = 0, b ≤100, and b ≥500 s/mm2), is recommended to obtain reproducible results. It is generally accepted that increasing the number of different diffusion gradients reduces the errors in ADC estimation [8].
The visual detection of focal hepatic lesions in DW images with lower b values is easier since blood vessels appear with low SI on these images [27]. The low SI appearance of blood vessels is more useful in depiction of especially small hepatic lesions. The optimum b value for the detection of focal hepatic lesions may be between 10 and 50 s/mm2 [4]. However, characterization of focal hepatic lesions necessitates acquisition of one or more high b-value images, which is also necessary for ADC measurement, as already demonstrated for renal lesion characterization [28].
Restriction of diffusion can be more easily assessed in higher b-value images (≥400–500 s/mm2) since the signal drop is more enhanced in these images. The optimum high b-value should range between 500 and 1000 s/mm2 in order to obtain a high SNR [29]. In addition, decrease of ADC values is more pronounced in these images. Measurement of ADC values at high b values should be obtained with acceptable SNR. Low SNR results in artificially reduced ADC values.
The SI of a focal hepatic lesion is determined by the Brownian motion of water molecules, microcapillary perfusion and T2-shinethrough effect. A focal hepatic lesion with a long T2-relaxation time may appear with a high SI on high diffusion images, secondary to T2-shine-through effect [10]. Concurrent assessment of DW images with ADC values is necessary to understand the T2-shine-through effect on DW images. T2-shine-through effect causes increased SI on DW images and increased ADC values for the same lesion with the same b gradients. Ichikawa et al. concluded that values >400 s/mm2 might reflect ADC measurements more accurately in abdominal diffusion studies in order to minimize perfusion effect on DW images [30].
■ Parallel imaging techniques
Parallel imaging techniques are more frequently used in DW-MRI of the liver. Two main parallel imaging techniques are simultaneous acquisition of spatial harmonics and sensitivity encoding [31,32]. These techniques reduce the number of signals needed for a given spatial resolution, resulting in a reduced time of readout and scanning. A MRI is constituted from the data obtained in the phase and frequency directions. In parallel imaging, incomplete data acquired in phase direction are used. Reduced scanning time by two- to three-times with parallel imaging improves the quality of EPI by reducing susceptibility artifacts [33,34]. Parallel imaging also improves ADC measurements in the left liver lobe [35]. Decreased scanning time in parallel imaging may be used to acquire breath-hold DW-MRI with high-quality images.
■ 3 Tesla in DW-MRI of focal hepatic lesions
The SNR is increased in 3 Tesla (T) magnets, which increases the signal of the DW images. However, artifacts and image distortion in DW-MRI occur more commonly when using 3T scanners, secondary to increased magnetic susceptibility and magnetic field variation in these systems. Parallel imaging in 3T systems can reduce the susceptibility effects by reducing the scan times. Radiofrequency absorption rate is increased in 3T MRI systems and a recent study concluded that DW-MRI may be an alternative to T2-weighted imaging in terms of absorption rate in 3T MRI [36].
Region of interest placement in ADC measurement of focal liver lesions
The regions of interest (ROIs) should be placed within the confines of the focal liver lesions. For heterogeneous lesions, ROIs should include the entire lesion. Insertion of ROIs at least 5 mm away from the outer margin of the focal hepatic lesion is recommended when comparison of ADC values between focal lesions and liver parenchyma is performed [15]. The ROIs may be copied and pasted on to the T1, T2 and DW images, and ADC maps to ensure the correct localization of the ROIs. When comparing the ROI values of the focal hepatic lesions with liver parenchyma, the posterior segment of the right hepatic lobe is usually preferred in order to avoid artifacts from the great vessels [8]. The average ADC value obtained from multiple ADC measurements is recommended for use when comparing focal hepatic lesions.
Applications
■ Focal liver lesions
DW-MRI was demonstrated to have higher sensitivity in detection of focal hepatic lesions in comparison with T2-weighted images [37]. Comparison between DW images and gadolinium or super paramagnetic iron oxide enhanced images, in terms of detection of focal hepatic lesions yielded that the combination of DW-MRI with contrast-enhanced MR images has higher sensitivity than contrast-enhanced images alone in the detection of HCCs [38,39]. Characterization of focal hepatic lesions is more reliably performed using higher b values, since DW images obtained in high b values represent diffusion properties more sufficiently.
■ Visual assessment of DW-MRI of focal hepatic lesions
On visual inspection of diffusion images alone, false-positive detection of malignant hepatic lesions may be caused by T2-shine-through, partial volume effects from adjacent structures, and cellular benign lesions (e.g., focal nodular hyperplasia [FNH], adenoma and abscess) (Figure 1) [40]. False-negative findings may result from metastases arising from mucinous tumors (which can mimic the appearance of a cyst), welldifferentiated tumors (e.g., well-differentiated HCC), necrotic lesions (either primarily necrotic or secondary to treatment) and image artifacts that could obscure lesion visualization (Figure 2). DW-MRI performed with a very low diffusion gradient, such as 20 s/mm2, was reported to be useful in identification of focal hepatic masses <10 mm [4]. Blood vessels appear black on these low b values, resulting in increased contrast between black vessel and bright lesion [4]. In a study evaluating visual assessment of focal hepatic lesions on DW images, lesion characterization as benign or malignant was correct in 89% of lesions [22].

Figure 1: Liver abscess. (A) Axial diffusionweighted image at b-400 gradient reveals right lobe mass with the increased signal intensity. (B) Apparent diffusion coefficient (ADC) map shows reduced ADC value at the wall of the lesion and increased ADC value at the center of the lesion, mimicking a necrotic tumor. (C) Average ADC value of lesion obtained at the center of the abscess cavity, the wall of the abscess cavity and normal liver parenchyma at the right lobe are 2.27 × 10⁻³ mm2/s, 0.61 × 10⁻³ mm2/s and 1.36 × 10⁻³ mm2/s, respectively.

Figure 2: Well-differentiated hepatocellular carcinoma. (A) Axial T2-weighted MRI demonstrates a slightly hyperintense solid mass (arrow) in the right lobe of the liver. (B) Diffusion-weighted image at b-800 gradient reveals high signal intensity right lobe mass (arrow). (C) Apparent diffusion coefficient (ADC) map shows an increased ADC value compared with the liver parenchyma. (D) Average ADC values of lesion and normal liver parenchyma are 1.01 × 10⁻³ mm2/s and 0.38 × 10⁻³ mm2/s, respectively. A very low ADC value of normal liver parenchyma may be caused by chronic liver disease.
Another advantage of DW-MRI reported is that this technique can easily demonstrate the focal hepatic lesions localized near to liver capsula that mimic intrahepatic vasculature [8].
■ Characterization of focal hepatic lesion on DW-MRI
Differentiation between solid and cystic lesions by visual assessment can be performed on DW images with higher b values (≥500 s/mm2), since significant signal drop occurs in cystic lesions on DW images with these b values [8]. Quantitative ADC values also enable DW-MRI to distinguish benign and malignant focal hepatic lesions. The ADC values of malignant hepatic lesions were found to be significantly lower than benign hepatic lesions with variable degree of overlap [3,6,14,22,41,42]. Cutoff ADC values in differentiation between benign and malignant hepatic lesions depend on the strength of the diffusion gradient used. Taouli et al. found that all focal hepatic lesions with an ADC greater than 2 × 10⁻³ mm2/s were benign and all lesions with an ADC less than 1 × 10⁻³ mm2/s were malignant in unidirectional and multidirectional DW-MRI sequences [3].
According to the literature, considerable overlap exists between cellular benign hepatic lesions (e.g., FNH and adenoma) and the malignant lesions, such as metastasis and HCC [8]. This result is not surprising, since the principle of DW-MRI mainly depends on high cellularity.
Earlier studies regarding DW-MRI of focal hepatic lesions focused only on cysts and hemangiomas for benign hepatic lesions, and HCCs and metastases for malignant hepatic lesions [1,2]. Recent studies examined the differentiating role of DW-MRI by including hypercellular benign hepatic lesions, such as FNH, hepatic adenoma and nodular regenerative hyperplasia, in the benign hepatic lesion group [43,44].
■ Focal hepatic lesions Benign hepatic lesions Cyst
Visual assessment of DW images with higher b values (≥500 s/mm2) can distinguish hepatic cysts from solid lesions by revealing signal drop in hepatic cysts [10]. The T2-shinethrough effect may occasionally prevent signal drop in cysts on high diffusion gradients [45]. Hepatic cysts have fluid content, which allows unrestricted diffusion within the lesion and increases the ADC values. The highest ADC values among focal hepatic lesions belong to hepatic cysts [2]. Measurement of ADC values may allow differentiating simple cysts from abscesses, which can mimic simple hepatic cysts in conventional MRI sequences (Figure 3). Oruç et al. reported no significant difference between average ADC values of simple cysts and Type 1 hydatid cysts (3.08 × 10⁻³ and 2.84 × 10 -3 mm2/s, respectively) [46]. According to their study, ADC values of abscesses were significantly lower than those of hydatid cysts and simple cysts. Type 4 hydatid cysts demonstrated statistically significant lower ADC values than other hydatic cyst types. The ADC values of abscess and Type 4 hydatid cysts were not significantly different.

Figure 3: Simple hepatic cyst. (A) Axial fat-saturated T2-weighted MRI demonstrates marked hyperintense mass in the right lobe of the liver. (B) Diffusion-weighted MRI at b-400 gradient reveals increased signal intensity in the mass secondary to T2-shine-through effect. (C) Diffusion-weighted MRI at b-800 gradient reveals marked signal drop within the lesion consistent with cyst. (D) Apparent diffusion coefficient map shows increased apparent diffusion coefficient value compared with the liver; mean apparent diffusion coefficient values of the mass and normal liver parenchyma are 3.02 × 10⁻³ mm2/s and 1.10 × 10⁻³ mm2/s, respectively.
Hepatic cysts and hemangiomas may mimic each other with similar signal intensities in unenhanced MRIs. The ADC values of hepatic cysts were also found to be significantly higher than liver hemangiomas in DW-MRI. Sun et al. used four different diffusion gradients (b 0, 100, 500 and 1000 s/mm2) in their study and concluded that the mean ADC value of hepatic cysts (3.14 ± 0.34 mm2/s) was significantly higher than the mean ADC value of hemangiomas (1.86 ± 0.34 mm2/s) [2].
Hemangioma
Cavernous hemangiomas mainly include fluid content resulting in higher ADC values than hepatic parenchyma (Figure 4) [15]. On DW images, hemangiomas demonstrate similar SI to the cysts, while ADC maps may demonstrate an inhomogeneous appearance, secondary to fibrosis or the presence of thrombus in hemangiomas [42].

Figure 4: Liver hemangioma. (A) Axial fat-suppressed T2-weighted MRI demonstrates a hyperintense mass at left liver lobe. (B) Hemangioma appears hyperintense on diffusion-weighted MRI at b-800 gradient, which was attributed to the T2-shine-through effect. (C) Hemangioma appears as increased apparent diffusion coefficient value on apparent diffusion coefficient map, suggesting unrestricted diffusion. (D) Apparent diffusion coefficient values of hemangioma and normal liver parenchyma are 2.81 × 10⁻³ mm2/s and 1.04 × 10⁻³ mm2/s, respectively.
The SI of hemangiomas varies on DW-MRI, which makes it difficult to distinguish hemangiomas from other hepatic tumors [43]. Bozgeyik et al. studied the ADC values of liver hemangiomas to discover the optimum diffusion gradient at which hepatic hemangiomas can be detected more easily, and if lesion size affects the ADC values. They concluded that hemangiomas had lower ADC values than normal hepatic tissue on b-100 and b-600 images. On the other hand, hemangiomas had higher ADC values than normal hepatic tissue on b-1000 images. No significant relation was found between lesion size and ADC values with different b values, which means that the size of the hemangiomas does not alter ADC values significantly [47].
Atypical hemangiomas may mimic other focal hepatic lesions in conventional MRIs. DW-MRI may be helpful to differentiate atypical hemangiomas from other focal hepatic lesions because the appearance and ADC values of atypical hemangiomas are not significantly different from typical hemangiomas in DW images and ADC maps [48].
Abscess
Hepatic abscesses show significantly higher SI than hepatic cysts, and cystic and necrotic tumors on high b-value DW-images. They demonstrate significantly lower ADC values on DW-MRI due to cellular debris and exudates, which distinguishes them from cystic or necrotic tumors [49]. The mean ADC values of hepatic abscesses, cystic or necrotic tumors and hepatic cysts were reported as 0.67 × 10⁻³ mm2/s, 2.65 × 10⁻³ mm2/s and 2.93 × 10⁻³ mm2/s, respectively [49].
Benign hepatocellular lesions
This group of lesions includes adenomas, FNHs and nodular regenerative hyperplasias. Common histologic properties of these lesions are based on benign hyperplasia of hepatocytes. Benign hepatocellular lesions have intermediate SI and ADC values on the DW images and ADC map, respectively. These lesions usually have decreased ADC values at high diffusion gradients, with the appearance of increased SI in high DW images [43]. No significant difference was found between ADC values of benign hepatocellular lesions or hepatic parenchyma [3]. Overlap between ADC values of benign and malignant hepatocellular lesions usually occurs between benign hepatocellular lesions and HCCs [29]. According to our study in which we used b-100, b-600 and b-1000 gradients, FNH showed the highest ADC values in benign, solid hepatocellular lesions (i.e., adenoma and nodular regenerative hyperplasia) and ADC values of FNHs were significantly different from all types of malignant hepatic tumors including HCC, metastasis and cholangiocarcinoma (Figure 5) [43]. Solid benign lesions, other than FNH, did not show significantly higher ADC values than HCCs. No significant difference was obtained between ADC values of benign hepatocellular lesions [43].

Figure 5: Focal nodular hyperplasia. (A) Axial T2-weighted MRI demonstrates an isointense solid mass (arrow) in the left lobe of the liver with central hyperintense area (arrowhead) suggesting vascular scar in focal nodular hyperplasia. (B) Contrast-enhanced T1-weighted MRI reveals contrast enhancement of the mass. Central vascular scar is not enhanced. (C) Mean apparent diffusion coefficient value of focal nodular hyperplasia obtained at b-100 gradient is 2.48 × 10⁻³ mm2/s. (D) Mean apparent diffusion coefficient value of focal nodular hyperplasia at b-1000 gradient is 1.57 × 10⁻³ mm2/s.
Malignant hepatic lesions
Hepatocellular carcinoma
The ADC values of HCCs are lower than benign hepatocellular lesions (Figure 6). High ADC values may be obtained in treated and/ or necrotic HCCs. HCCs may be difficult to differentiate from surrounding cirrhotic changes or dysplastic nodules, as these can have similar ADC values [3,14,50–52].

Figure 6: Hepatocellular carcinoma. (A) Diffusion-weighted MRI at b-800 gradient reveals increased signal intensity in the right liver lobe mass secondary to restriction of diffusion. (B) Apparent diffusion coefficient map shows reduced apparent diffusion coefficient consistent with restricted diffusion. (C) Mean apparent diffusion coefficient value of the normal liver tissue and mass are 1.07 × 10⁻³ mm2/s and 0.68 × 10⁻³ mm2/s, respectively.
The role of DW-MRI in discriminating high-grade from low-grade HCC is also under investigation. In one recent study, the ADC values of moderately- and poorly-differentiated HCCs were significantly lower than the ADC values of well-differentiated HCCs and dysplastic nodules. Furthermore, in the same study, it was shown that all iso- to hypo-vascular lesions on gadolinium-enhanced examination that were also visible on DW-MRI were poorly-differentiated HCCs, whereas lesions not visible on DW-MRI were low-grade HCCs or dysplastic nodules, probably reflecting less restriction of diffusion and less hypercellularity in low-grade HCCs [53]. Addition of DWI to gadolinium- or super paramagnetic iron oxide-enhanced MRI was reported to increase sensitivity in detection of HCCs [38,39].
In an experimental study, ADC values of chemically-induced primary hepatic nodules were investigated and no significant difference was found between ADC values of dysplastic nodules and well-differentiated HCCs [54]. In the same study, the ADC values of regenerative and dysplastic nodules were also not statistically different.
The ADC values of HCCs were reported to be similar to hepatic metastases [6]. It was suggested that the ratio of lesion:liver can differentiate HCCs from hepatic metastases. The ratio of lesion:liver of HCC was found to be significantly lower than hepatic metastases [2].
In a recent study, in addition to the conventional MRI criteria (enhancement in the arterial phase and washout in the portal venous and/or equilibrium phase) adding a new DWI criterion (hyperintensity in DWI) was found to significantly increase sensitivity for the diagnosis of HCC compared with conventional criteria, regardless of tumor size in chronic liver disease patients [55]. The addition of DWI to contrast-enhanced T1-weighted images slightly increases the detection rate of HCC in pretransplant patients [56]. Also, ADC characteristics of HCC metastasis appear to be similar to primary HCC [57].
■ Metastasis
The lowest ADC values among the malignant hepatic lesions have been obtained in metastasis and HCC in most of the studies [3]. Necrotic metastases and metastases from mucinous tumors may show high ADC values (Figure 7). The differential diagnosis between small-sized metastases and hemangiomas is very difficult in conventional sequences; DW-MRI is more useful to differentiate these lesions. Sensitivity values of DW-MRI and gadolinium enhanced in detection of hepatic metastases were not significantly different [58]. Colorectal hepatic metastases were found to be more accurately detected with the addition of DW-MRI to mangafodipir trisodium-enhanced MRI [59].

Figure 7: Hepatic metastasis. (A) Axial contrast-enhanced T1-weighted MRI of a patient with metastatic gastric tumor reveals right hepatic metastasis with peripheral rim enhancement. (B) Diffusion-weighted image at b-800 gradient demonstrates hyperintense metastases. (C) Apparent diffusion coefficient map shows hypointense area reflecting restricted diffusion. (D) Mean apparent diffusion coefficient values of the normal liver parenchyma and metastasis are 1.17 × 10⁻³ mm2/s and 0.72 × 10⁻³ mm2/s, respectively.
■ Cholangiocarcinoma
Cholangiocarcinomas appear with increased SI on DW images. ADC values of cholangiocarcinomas were reported to be lower than other malignant liver tumors, such as HCCs and metastases [43]. These diffusion properties are attributed to accompanying fibrotic changes in the histologic structure of cholangiocarcinomas.
■ Assessment of treatment response
Tumor response to chemotherapy, radiation and local ablation therapies can be evaluated with DW-MRI. Contrast-enhanced T1-weighted MRI with subtraction is a gold standard technique for evaluation of response to therapies [60]. Increased ADC values in tumors after treatment generally show positive correlation with tumor response (Figure 8). The increase of ADC values as a response to treatment occurs earlier than size change in focal hepatic tumors. Correlation between ADC values and tumor response was mainly studied with colorectal metastases treated with chemotherapy and HCCs treated with chemoembolization therapy [8]. Transient reduction in ADC within 24–48 h after initiation of treatment may be secondary to acute cell swelling or possibly reduction of interstitial volume [61]. Following the increase in ADC with treatment, subsequent decrease in ADC values may be related to tumor repopulation, fibrosis or tissue remodeling, and decreased perfusion [62–64]. More recently, it was shown that increased ADC values after radiofrequency ablation in treated tumors correlated with a decrease in fluorine-19-fluorodeoxyglucose tracer uptake at PET [65]. Necrotic tumors with high ADC values were demonstrated to be highly resistant to treatment. ADC has a significant correlation with necrosis [66,67]. Colorectal metastases with a high pretreatment ADC was shown to respond poorly to chemotherapy, suggesting that tumors that were more necrotic prior to treatment are more chemoresistant [68,69]. A recent study showed lower performance of DW-MRI compared with contrast-enhanced imaging, with sensitivity for detection of local HCC recurrence of 60.7% compared with 82% for contrast-enhanced imaging [51]. Kamel et al. reported that ADC measurement can be used to predict the degree of tumor necrosis of large HCCs after transarterial chemoembolization [67]. DWI and ADC are helpful and may integrate the information obtained with subtraction. ADC may have a role in new ablation techniques with Y90 and irreversible electroporation [70].

Figure 8: Apparent diffusion coefficient value as a marker of treatment response. (A) Axial T2-weighted MRI of a patient with hepatocellular carcinomas demonstrates a hyperintense mass (arrow) in the right liver lobe. (B) Apparent diffusion coefficient (ADC) map at b-1000 gradient reveals hepatocellular carcinomas with low signal intensity, suggesting decreased diffusion in mass. ADC value of the mass is 1.29 × 10⁻³ mm2/s. (C) Axial T2-weighted image 2 months after chemoembolization treatment reveals the right liver lobe mass with same lesion size. The a-fetoprotein level of the patient was decreased. (D) Corresponding ADC map reveals ADC value of the lesion as 1.50 × 10⁻³ mm2/s. The increased ADC value is compatible with the decreased a-fetoprotein.
■ Limitations
The main limitations of DW-MRI in evaluation of focal hepatic lesions include limited image quality secondary to poor SNR and limited spatial resolution. Respiratory, cardiac and peristaltic activities decrease the quality of DW images. Distortion, ghosting and blurring constitute EPI-related artifacts. ADC reproducibility is another limitation since ADC values may be changed according to used MRI system and DW-MRI acquisition technique [8,10]. Parallel imaging should be used systematically to reduce susceptibility artifacts and decrease the echo time to improve SNR [71–73]. DW-MRI studies obtained with 3T scanners have limited value since few studies are accomplished in this area. High-field imaging enables higher SNR; however, EPI suffers from increased susceptibility artifacts in high-field MRI systems. Non-EPI sequences may be used in higher field MRI systems.
The ADC values may differ secondary to used sequences, MRI machines and b values. The ADCs should be validated by performing phantom measurements in DW-MRI studies in order to minimize ADC measurement errors. Phantom studies may be performed with water and acetone with increasing b values: 200, 300, 400, 500, 600 and 1000 s/ mm2 before evaluation of focal liver lesions in DW-MRI. Determination of decrease of ADC values with the increase of diffusion gradients may be helpful to prevent errors in ADC measurement.
Another limitation of DW-MRI of focal hepatic lesions is the difficulty in visual assessment of small hepatic lesions. In DW-MRI studies, researchers generally excluded the lesions smaller than 1 cm, since DW images have limited spatial resolution. Studies with large series are required to understand the utility of ADC measurement in small focal hepatic lesions.
Conclusion
In conclusion, DW-MRI is a quick and noncontrast imaging method that can be performed in patients with renal insufficiency. DW-MRI reflects tissue cellularity, integrity of cellular membranes and microcapillary perfusion [11,62]. It can be used as a complementary imaging method in evaluation of focal hepatic lesions. When performing DW-MRI in the liver, it is advantageous to use both lower and higher b values (e.g., b 50, b 100 and b 500 s/mm2). Additional b values can be considered for research, clinical trials or when the primary aim is to obtain an accurate ADC. Although most DW-MRI studies regarding focal hepatic lesions have been carried out with 1.5T MRI scanners, the number of studies performed with 3T is increasing, since 3T scanners provide high-quality images with increased SNR.
Overlap between ADC values of benign and malignant hepatic lesions necessitates interpretation of ADC values concurrently with conventional MR sequences, including contrast enhanced images.
Future perspective
DW-MRI will be increasingly used in evaluation of focal hepatic lesions in the future with the application of a parallel imaging technique. High Tesla MRI systems, such as 3T, obtain high SNR in DW images. Use of DW-MRI on 3T MRI can decrease the radiofrequency absorption rate. Large series, including focal hepatic lesions <1 cm, are required to determine the utility of DW-MRI in evaluation of focal hepatic lesions. DW-MRI will gain much acceptance with the improvements in image quality and shortness of sequence acquisition time that minimize artifacts. Improvements in software that superimposes DW images onto the conventional MRIs, such as T2-weighted and contrast-enhanced images may be helpful in evaluation of focal hepatic lesions. It has already been done for prostate tumor detection and localization [74].
Financial & competing interests disclosure
The authors have no relevant affiliations or financial involvement with any organization or entity with a financial interest in or financial conflict with the subject matter or materials discussed in the manuscript. This includes employment, consultancies, honoraria, stock ownership or options, expert testimony, grants or patents received or pending, or royalties.
No writing assistance was utilized in the production of this manuscript.
References
Papers of special note have been highlighted as:
• of interest
- Demir OI, Obuz F, Sagol O, Dicle O. Contribution of diffusion-weighted MRI to the differential diagnosis of hepatic masses. Diagn. Interv. Radiol. 13(2), 81–86 (2007).
- Sun XJ, Quan XY, Huang FH, Xu YK. Quantitative evaluation of diffusion-weighted magnetic resonance imaging of focal hepatic lesions. World J. Gastroenterol. 11(41), 6535–6537 (2005).
- Taouli B, Vilgrain V, Dumont E, Daire JL, Fan B, Menu Y. Evaluation of liver diffusion isotropy and characterization of focal hepatic lesions with two single-shot echo-planar MR imaging sequences: prospective study in 66 patients. Radiology 226(1), 71–78 (2003).
- Coenegrachts K, Delanote J, Ter Beek L et al. Improved focal liver lesion detection: comparison of single-shot diffusion-weighted echoplanar and single-shot T2 weighted turbo spin echo techniques. Br. J. Radiol. 80(955), 524–531 (2007).
- Kandpal H, Sharma R, Madhusudhan KS, Kapoor KS. Respiratory-triggered versus breath-hold diffusion-weighted MRI of liver lesions: comparison of image quality and apparent diffusion coefficient values. AJR Am. J. Roentgenol. 192(4), 915–922 (2009).
- Miller FH, Hammond N, Siddiqi AJ et al. Utility of diffusion-weighted MRI in distinguishing benign and malignant hepatic lesions. J. Magn. Reson. Imaging. 32(1), 138–147 (2010).
- Colagrande S, Belli G, Politi LS et al. The influence of diffusion- and relaxation-related factors on signal intensity: an introductive guide to magnetic resonance diffusionweighted imaging studies. J. Comput. Assist. Tomogr. 32(3), 463–474 (2008).
- Chandarana H, Taouli B. Diffusion and perfusion imaging of the liver. Eur. J. Radiol. 76(3), 348–358 (2010).
- Koh DM, Collins DJ, Orton MR. Intravoxel incoherent motion in body diffusionweighted MRI: reality and challenges. AJR Am. J. Roentgenol. 196(6), 1351–1361 (2011).
- Taouli B, Koh DM. Diffusion-weighted MR imaging of the liver. Radiology 254(1), 47–66 (2010).
- Le Bihan D, Breton E, Lallemand D, Aubin ML, Vignaud J, Laval-Jeantet M. Separation of diffusion and perfusion in intravoxel incoherent motion MR imaging. Radiology 168, 497–505 (1988).
- Le Bihan D. Diffusion/perfusion MR imaging of the brain: from structure to function. Radiology 177, 328–329 (1990).
- Moteki T, Horikoshi H, Oya N, Aoki J, Endo K. Evaluation of hepatic lesions and hepatic parenchyma using diffusion-weighted reordered turboFLASH magnetic resonance images. J. Magn. Reson. Imaging 15, 564–572 (2002).
- Yamada I, Aung W, Himeno Y, Nakagawa T, Shibuya H. Diffusion coefficients in abdominal organs and hepatic lesions: evaluation with intravoxel incoherent motion echoplanar MR imaging. Radiology 210, 617–623 (1999).
- Moteki T, Horikoshi H. Evaluation of hepatic lesions and hepatic parenchyma using diffusion-weighted echo-planar MR with three values of gradient b-factor. J. Magn. Reson. Imaging 24(3), 637–645 (2006).
- Bammer R, Stollberger R, Augustin M et al. Diffusion-weighted imaging with navigated interleaved echo-planar imaging and a conventional gradient system. Radiology 211, 799–806 (1999).
- Schaefer PW, Grant PE, Gonzalez RG. Diffusion- weighted MR imaging of the brain. Radiology 217, 331–345 (2000).
- Ries M, Jones RA, Basseau F, Moonen CT, Grenier N. Diffusion tensor MRI of the human kidney. J. Magn. Reson. Imaging 14, 42–49 (2001).
- Butts K, Riederer SJ, Ehman RL, Felmlee JP, Grimm RC. Echo-planar imaging of the liver with a standard MR imaging system. Radiology 189(1), 259–264 (1993).
- Turner R, Le Bihan D, Chesnick AS. Echo-planar imaging of diffusion and perfusion. Magn. Reson. Med. 19(2), 247–253 (1991).
- Taouli B, Sandberg A, Stemmer A et al. Diffusion-weighted imaging of the liver: comparison of navigator triggered and breathhold acquisitions. J. Magn. Reson. Imaging 30(3), 561–568 (2009).
- Parikh T, Drew SJ, Lee VS et al. Focal liver lesion detection and characterization with diffusion-weighted MR imaging: comparison with standard breath-hold T2-weighted imaging. Radiology 246, 812–822 (2008).
- Nasu K , Kuroki Y, Fujii H, Minami M. Hepatic pseudo-anisotropy: a specific artifact in hepatic diffusion-weighted images obtained with respiratory triggering. MAGMA 20, 205–211 (2007).
- Nasu K, Kuroki Y, Sekiguchi R, Nawano S. The effect of simultaneous use of respiratory triggering in diffusion-weighted imaging of the liver. Magn. Reson. Med. Sci. 5, 129–136 (2006).
- Chiu FY, Jao JC, Chen CY et al. Effect of intravenous gadolinium-DTPA on diffusionweighted magnetic resonance images for evaluation of focal hepatic lesions. J. Comput. Assist. Tomogr. 29, 176–180 (2005).
- De Santis M, Alborino S, Tartoni PL, Torricelli P, Casolo A, Romagnoli R. Effects of lipiodol retention on MRI signal intensity from hepatocellular carcinoma and surrounding liver treated by chemoembolization. Eur. Radiol. 7, 10–16 (1997).
- Low RN. Abdominal MRI advances in the detection of liver tumours and characterisation. Lancet Oncol. 8(6), 525–535 (2007).
- Taouli B, Thakur RK, Mannelli L et al. Renal lesions: characterization with diffusion-weighted imaging versus contrastenhanced MR imaging. Radiology 251(2), 398–407 (2009).
- Sandrasegaran K, Akisik FM, Lin C, Tahir B, Rajan J, Aisen AM. The value of diffusionweighted imaging in characterizing focal liver masses. Acad. Radiol. 16(10), 1208–1214 (2009).
- Ichikawa T, Haradome H, Hachiya J, Nitatori T, Araki T. Diffusion-weighted MR imaging with a single-shot echoplanar sequence: detection and characterization of focal hepatic lesions. Am. J. Roentgenol. 170(2), 397–402 (1998).
- Larkman DJ, Nunes RG, Parallel magnetic resonance imaging. Phys. Med. Biol. 52(7), R15–R55 (2007).
- Blaimer M, Breuer F, Mueller M et al. SMASH, SENSE, PILS, GRAPPA: how to choose the optimal method. Top. Magn. Reson. Imaging 15(4), 223–236 (2004).
- Pruessmann KP, Weiger M, Scheidegger MB, Boesiger P. SENSE: sensitivity encoding for fast MRI. Magn. Reson. Med. 42, 952–962 (1999).
- Kurihara Y, Yokushiji YK, Tani I, Nakajima Y, Van Cauteren M. Coil sensitivity encoding in MR imaging: advantages and disadvantages in clinical practice. AJR Am. J. Roentgenol. 178, 1087–1091 (2002).
- Yoshikawa T, Kawamitsu H, Mitchell DG et al. ADC measurement of abdominal organs and lesions using parallel imaging technique. AJR Am. J. Roentgenol. 187(6), 1521–1530 (2006).
- van den Bos IC, Hussain SM, Krestin GP, Wielopolski PA. Liver imaging at 3.0 T: diffusion-induced black-blood echo-planar imaging with large anatomic volumetric coverage as an alternative for specific absorption rate-intensive echo-train spin-echo sequences: feasibility study. Radiology 248, 264–271 (2008).
- Hussain SM, De Becker J, Hop WC, Dwarkasing S, Wielopolski PA. Can a single-shot black-blood T2-weighted spin-echo echo-planar imaging sequence with sensitivity encoding replace the respiratory-triggered turbo spin-echo sequence for the liver? An optimization and feasibility study. J. Magn. Reson. Imaging 21(3), 219–229 (2005).
- Nishie A, Tajima T, Ishigami K et al. Detection of hepatocellular carcinoma (HCC) using super paramagnetic iron oxide (SPIO)-enhanced MRI: Added value of diffusion-weighted imaging (DWI). J. Magn. Reson. Imaging 31(2), 373–382 (2010).
- Xu PJ, Yan FH, Wang JH, Lin J, Ji Y. Added value of breathhold diffusion-weighted MRI in detection of small hepatocellular carcinoma lesions compared with dynamic contrastenhanced MRI alone using receiver operating characteristic curve analysis. J. Magn. Reson. Imaging 29(2), 341–349 (2009).
- Provenzale JM, Engelter ST, Petrella JR et al. Use of MR exponential diffusion-weighted images to eradicate T2 ‘shine-through’ effect. AJR Am. J. Roentgenol. 172, 537–539 (1999).
- Bruegel M, Holzapfel K, Gaa J et al. Characterization of focal liver lesions by ADC measurements using a respiratory triggered diffusion-weighted singleshot echo-planar MR imaging technique. Eur. Radiol. 18(3), 477–485 (2008).
- Gourtsoyianni S, Papanikolaou N, Yarmenitis S, Maris T, Karantanas A, Gourtsoyiannis N. Respiratory gated diffusion-weighted imaging of the liver: value of apparent diffusion coefficient measurements in the differentiation between most commonly encountered benign and malignant focal liver lesions. Eur. Radiol. 18(3), 486–492 (2008).
- Onur MR, Çiçekçi M, Kayali A, Poyraz AK, Kocakoç E. The role of ADC measurement in differential diagnosis of focal hepatic lesions. Eur. J. Radiol. 81(3), e171–e176 (2012).
- Fowler KJ, Brown JJ, Narra VR. Magnetic resonance imaging of focal liver lesions: approach to imaging diagnosis. Hepatology 54(6), 2227–2237 (2011).
- Inan N, Arslan A, Akansel G et al. Diffusion-weighted imaging in the differential diagnosis of simple and hydatid cystsof the liver. AJR Am. J. Roentgenol. 189, 1031–1036 (2007).
- Oruç E, Yildirim N, Topal NB, Kiliçturgay S, Akgöz S, Savci G. The role of diffusionweighted MRI in the classification of liver hydatid cysts and differentiation of simple cysts and abscesses from hydatid cysts. Diagn. Interv. Radiol. 16(4), 279–287 (2010).
- Bozgeyik Z, Kocakoc E, Gul Y, Dagli AF. Evaluation of liver hemangiomas using three different b values on diffusion MR. Eur. J. Radiol. 75(3), 360–363 (2010).
- Mazroa AJ, ELmogy SA. Typical and atypical liver hemangiomas. Can diffusion MR with different b values provide confident diagnosis? Egyptian J. Radiol. Nuclear Med. 42, 357–365 (2011).
- Chan JH, Tsui EY, Luk SH et al. Diffusion weighted MR imaging of the liver: distinguishing hepatic abscess from cystic or necrotic tumor. Abdom. Imaging 26, 161–165 (2001).
- Vossen JA, Buijs M, Liapi E, Eng J, Bluemke DA, Kamel IR. Receiver operating characteristic analysis of diffusion-weighted magnetic resonance imaging in differentiating hepatic hemangioma from other hypervascular liver lesions. Tomography 32, 750–756 (2008).
- Goshima S, Kanematsu M, Kondo H et al. Diffusion-weighted imaging of the liver: optimizing b value for the detection and characterization of benign and malignant hepatic lesions. J. Magn. Reson. Imaging. 28, 691–697 (2008).
- Koinuma M, Ohashi I, Hanafusa K, Shibuya H. Apparent diffusion coefficient measurements with diffusion-weighted magnetic resonance imaging for evaluation of hepatic fibrosis. J. Magn. Reson. Imaging. 22, 80–85 (2005).
- Muhi A, Ichikawa T, Motosugi U et al. High-b-value diffusion-weighted MR imaging of hepatocellular lesions: estimation of grade of malignancy of hepatocellular carcinoma. J. Magn. Reson. Imaging 30(5), 1005–1011 (2009).
- Xu H, Li X, Xie JX, Yang ZH, Wang B. Diffusion-weighted magnetic resonance imaging of focal hepatic nodules in an experimental hepatocellular carcinoma rat model. Acad. Radiol. 14(3), 279–286 (2007).
- Piana G, Trinquart L, Meskine N, Barrau V, Beers BV, Vilgrain V. New MR imaging criteria with a diffusion-weighted sequence for the diagnosis of hepatocellular carcinoma in chronic liver diseases. J. Hepatol. 55(1), 126–132 (2011).
- Park MS, Kim S, Patel J et al. Hepatocellular carcinoma: Detection with diffusionweighted versus contrast-enhanced magnetic resonance imaging in pretransplant patients. Hepatology 56(1), 140–148 (2012).
- Mannelli L, Hoang MV, Sabath AP, Linnau KF. An unusual oral mass. Gastroenterology 142(3), e14–e15 (2012).
- Hardie AD, Naik M, Hecht EM et al. Diagnosis of liver metastases: value of diffusion-weighted MRI compared with gadolinium-enhanced MRI. Eur. Radiol. 20(6), 1431–1441 (2010).
- Koh DM, Brown G, Riddell AM et al. Detection of colorectal hepatic metastases using MnDPDP MR imaging and diffusionweighted imaging (DWI) alone and in combination. Eur. Radiol. 18(5), 903–910 (2008).
- Kim S, Mannelli L, Hajdu CH et al. Hepatocellular carcinoma: assessment of response to transarterial chemoembolization with image subtraction. J. Magn. Reson. Imaging 31(2), 348–355 (2010).
- Thoeny HC, De Keyzer F, Vandecaveye V et al. Effect of vascular targeting agent in rat tumor model: dynamic contrast-enhanced versus diffusion-weighted MR imaging. Radiology 237, 492–499 (2005).
- Koh DM, Collins DJ. Diffusion-weighted MRI in the body: applications and challenges in oncology. AJR Am. J. Roentgenol. 188, 1622–1635 (2007).
- Mardor Y, Roth Y, Ochershvilli A et al. Pretreatment prediction of brain tumors’ response to radiation therapy using high b-value diffusion-weighted MRI. Neoplasia 6, 136–142 (2004).
- Patterson DM, Padhani AR, Collins DJ. Technology insight: water diffusion MRI–a potential new biomarker of response to cancer therapy. Nat. Clin. Pract. Oncol. 5, 220–233 (2008).
- Ohira T, Okuma T, Matsuoka T et al. FDG MicroPET and diffusion-weighted MR image evaluation of early changes after radiofrequency ablation in implanted VX2 tumors in rabbits. Cardiovasc. Intervent. Radiol. 32, 114–120 (2009).
- Mannelli L, Kim S, Hajdu CH, Babb JS, Clark TW, Taouli B. Assessment of tumor necrosis of hepatocellular carcinoma after chemoembolization: diffusion weighted and contrast-enhanced MRI with histopathologic correlation of the explanted liver. Am. J. Roentgenol. 193(4), 1044–1052 (2009).
- Kamel IR, Bluemke DA, Ramsey D et al. Role of diffusion-weighted imaging in estimating tumor necrosis after chemoembolization of hepatocellular carcinoma. AJR Am. J. Roentgenol. 181(3), 708–710 (2003).
- Koh DM, Scurr E, Collins D et al. Predicting response of colorectal hepatic metastasis: value of pretreatment apparent diffusion coefficients. AJR Am. J. Roentgenol. 188, 1001–1008 (2007).
- Cui Y, Zhang XP, Sun YS, Tang L, Shen L. Apparent diffusion coefficient: potential imaging biomarker for prediction and early detection of response to chemotherapy in hepatic metastases. Radiology 248, 894–900 (2008).
- Calmels L, Al-Sakere B, Ruaud JP, Leroy-Willig A, Mir LM. In vivo MRI Follow-up of Murine Tumors Treated by Electrochemotherapy and other Electroporation-based Treatments. Technol. Cancer Res. Treat. doi:10.7785/ tcrt.2012.500270 (2012) (Epub ahead of print).
- Bammer R, Auer M, Keeling SL et al. Diffusion tensor imaging using single-shot SENSE-EPI. Magn. Reson. Med. 48, 128–136 (2002).
- Taouli B, Martin AJ, Qayyum A et al. Parallel imaging and diffusion tensor imaging for diffusion-weighted MRI of the liver: preliminary experience in healthy volunteers. AJR Am. J. Roentgenol. 183, 677–680 (2004).
- Bammer R, Keeling SL, Augustin M et al. Improved diffusion-weighted single-shot echoplanar imaging (EPI) in stroke using sensitivity encoding (SENSE). Magn. Reson. Med. 46, 548–554 (2001).
- Rosenkrantz AB, Mannelli L, Kong X et al. Prostate cancer: utility of fusion of T2- weighted and high b-value diffusion-weighted images for peripheral zone tumor detection and localization. J. Magn. Reson. Imaging 34, 95–100 (2011).
• Gives information about the isotropic structure of the liver.
• Briefly summarizes the diffusion-weighted MRI techniques of the liver.
• An interesting overview about diffusion-weighted MRI techniques of the liver.


