Research Article - Pharmaceutical Bioprocessing (2018) Volume 6, Issue 3
CD146 expression, as a surrogate biomarker for human mesenchymal stromal cell multilineage differentiation, is preserved during cell expansion in an automated hollow-fiber membrane bioreactor
- *Corresponding Author:
- Jones M
Innovation & Development Department
Terumo BCT, Inc., Lakewood, CO, 80215, USA
E-mail: mark.jones@terumobct.com
Abstract
Background: Mesenchymal stromal cells (also known as mesenchymal stem cells, hMSCs) are currently being evaluated in a number of clinical trials including those for graft-versus-host disease, autoimmune disease, bone regeneration, wound repair, and other cartilage, liver, kidney, and lung disorders. In biopharmaceutical development and production, the ex vivo expansion of human mesenchymal stromal cells is frequently evaluated through trilineage differentiation assays. This approach requires 2 to 4 weeks of manual effort to complete following the induction of adherent heterogeneous cell populations and it lacks quantification. The development of a more efficient and quantifiable measure of potential differentiation can be helpful in characterizing both MSC-based translational and manufacturing processes.
Methods and Findings: We have evaluated the expression of CD146, a surface biomarker, on actively growing hMSCs in the automated Quantum® Cell Expansion System bioreactor. Specifically, an index of CD146+ median fluorescence intensity (MFI), as measured by flow cytometry during automated cell culturing and subsequent differentiation with respect to cell doublings, provides information for the qualification of MSCs. We demonstrate here that CD146 expression is well above the biomarker expression levels observed in lineage-committed, confluent, or differentiated hMSCs by 2- to 34-fold. Our results show that CD146 expression is high at hMSC harvest and then decreases with lineage differentiation. Moreover, we show that CD146 is expressed across multiple (4) passages out to 27 population doublings and gradually decreases. A similar trend in CD146 expression was observed in cells with various types of bioreactor fibronectin coating agents and fetal bovine serum (FBS)-supplemented media across multiple passages.
Conclusion: hMSCs expanded with the combination of a human-platelet-derived cryoprecipitate (hCPPT)-coated bioreactor and human platelet lysate (hPL)-supplemented media show an increase in CD146 expression across 3 passages. In a comparison of conservative, moderate (control), and aggressive feeding schedules, the moderate feeding schedule generated hMSCs with the highest CD146 expression. Additionally, bioreactor coating agents, such as platelet-derived cryoprecipitate, can facilitate the preservation of CD146 expression during hMSC expansion where MFI indexes are increased to 400-fold above unstained cells through 23.8 population doublings. Furthermore, the hollow-fiber membrane (HFM) bioreactor system, with a programmable gas transfer module (GTM), demonstrates a capability to maintain normoxia (5%-18% O2), which is known to support CD146 upregulation.
Keywords
mesenchymal stromal cells, cytometry, chondrogenesis, biomarker
Introduction
Mesenchymal stromal cells (also known as mesenchymal stem cells, hMSCs) are currently being evaluated in a number of clinical trials, including those for graft versus- host disease, autoimmune disease, bone regeneration, wound repair, and other cartilage, liver, kidney, and lung disorders [1]. In biopharmaceutical development and production, the functional activity of expanded human mesenchymal stromal cells is frequently evaluated through trilineage differentiation by inducing adipogenesis, chondrogenesis, or osteogenesis [2]. Such hMSC differentiation protocols generally require 2 to 4 weeks to complete following the induction of adherent cell populations that are also characterized by heterogeneity [3-5]. CD146 (melanoma cell adhesion molecule [MCAM]) is a cell surface biomarker on hMSCs that plays a role in cell adhesion and is a member of the immunoglobulin superfamily (Figure 1) [6]. Moreover, Covas et al. demonstrated that a majority of both adult hMSCs and pericytes express the CD146 biomarker [7]. Baksh et al. compared the proliferative and differentiation potential of hMSCs derived from umbilical cords and bone marrow; both progenitor cell lines were CD146 positive [8]. Prior work by Russell et al. indicates that CD146 exhibits a correlation between biomarker expression and cultured MSC potency as exemplified by a 2-fold increase in mean fluorescence intensity (MFI) between unidifferentiated and tridifferentiated cell clones prior to induction [9]. Lee et al. have demonstrated that Netrin-1 is the ligand that binds to CD146 and induces proliferation through SP1-mediated reactive oxygen species (ROS) production in human umbilical cord blood (hUCB)-MSCs to elevate cyclin D1/E [10]. Earlier studies by Sacchetti et al. evaluated the expression of both CD146 and STRO-1, an endoplasmic- reticulum-cell membrane translocation protein that responds to intracellular calcium depletion, in cells derived from the bone marrow stroma [11]. They found that only CD146 expression distinguished bone-marrow-derived mesenchymal stem cells from osteogenic and non-osteogenic cell lines that helped to reconstitute the hematopoietic microenvironment by flow cytometry and immunohistochemistry. In their studies, the CD146+ hMSC skeletal progenitors were successfully transplanted into an immune-compromised murine model where bone formation preceded the development of a sinusoidal system and hematopoiesis [11]. A more recent review by Lv et al. suggests that CD146 expression defines MSCs with a higher potential for multilineage differentiation and a role in perivascular localization [12]. In addition, this review indicated that CD146 expression was found in bone-marrow-derived MSCs (BM-MSCs) and in adipose-derived mesenchymal stem cells (ASCs) from many sites, including adipose tissue, lung, skeletal muscle, fetal heart, synovial membrane, umbilical cord blood, placenta, pancreas, dermis, periodontal ligament, and intervertebral discus.

Figure 1. Proposed model of CD146 and ligand interaction in expanding MSCs and differentiating cells
The Quantum® Cell Expansion System (Quantum system) is a functionally closed, automated hollow-fiber membrane bioreactor system used to expand adherent or suspension cells and is characterized by a high surface-to-volume ratio as well as a programmable gas transfer module (GTM) [13]. At Terumo BCT, we have begun to measure the CD146 surface biomarker expression by flow cytometry as an early indicator of hMSC differentiation potency at the time of harvest from the Quantum system. In addition, we followed the CD146 expression profile in differentiated BM-hMSCs. The results also reflect the progression of hMSCs through lineage commitment and on to differentiation in terms of a cell adhesion biomarker. Furthermore, we expanded our study to include an assessment of the culture conditions and timing under which the CD146 biomarker was expressed.
CD146 (also known as MCAM and MUC18) is a 113-119 kDa calcium-independent multifunctional transmembrane glycoprotein that mediates cell adhesion, binds the Netrin-1 ligand, and has been shown to be a coreceptor with vascular endothelial growth factor receptor 2 (VEGFR2) [6,14,15]. Tormin et al. also showed that normoxic conditions upregulated CD146 expression in BM-MSCs, [14] and Prieto et al. have shown that MSCs secrete Netrin-1 [16]. The proposed model of CD146 in hMSCs suggests that this dimeric receptor is upregulated during expansion and downregulated upon reaching confluency, entering lineage commitment, or differentiation (Figure 1).
Cell Source and Methods
Expression of CD146 over multiple passages
hMSCs were selected from adult bone marrow aspirates (AllCells, Alameda, CA) and expanded through passages designated P0, P1, P2, and P3 in the Quantum system. At each harvest, cell aliquots were stained and analyzed by flow cytometry for CD146+ expression using a conjugated PE/Cy7 anti-CD146 tandem fluorochrome stain. Harvested cells (P1T1) were also analyzed for hMSC morphology, surface biomarker expression of CD14-, CD34-, CD45-, HLADR-, CD73+, CD90+, CD105+, and trilineage differentiation.
The CD146 MFI index is based on the ratio of PE/Cy7 MFI in unstained and stained hMSCs as defined by the following equation: CD146 MFI Index = (PE/Cy7 MFI of CD146+ stained hMSCs) / (PE/Cy7 MFI of unstained hMSCs)
MFI was acquired with a BD Canto-II flow cytometer (BD Biosciences, San Jose, CA) with BD FACSDiva 6.1.3 software and was subsequently used to quantify the relative expression of CD146 on hMSCs and differentiated cells and to compare to unstained cells through the CD146 index.
hMSC immunofluorescent staining
Aliquots of the same automated harvests from the 3 hMSC donors were stained with antihuman CD146 antibody-FITC, anti-tight junction protein 1 (Z01) antibody, and 4,6-diamidino-2-phenylindole (DAPI) in preparation for examination by fluorescent microcopy using a Zeiss Axio Observer A1 equipped with ZEN 2 software.
hMSC morphology
Images of hMSC adipogenesis, chondrogenesis, and osteogenesis were acquired for confirmation purposes. The data suggest that CD146 biomarker expression can be used to quantify the potency of hMSC differentiation prior to induction.
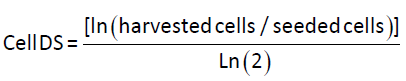
Mammalian cell doublings
The mammalian cell doubling (DS) calculations are based on the following equation from Sherley et al. [17].
MSC expansion and differentiation
Three (3) adult human BM-hMSC (P1T0) lineages were thawed, seeded at 6.0 × 10⁶ cells into the Quantum system, and expanded in medium containing Gibco αMEM + GlutaMAX; either HyClone fetal bovine serum 10% (FBS) or human platelet lysate 5%-10% (hPL) (Compass Biomedical, Hopkinton, MA) supplement; and Gibco gentamicin/ amphotericin B at 37°C with mixed gas (5% CO2, 20% O2, 75% N2) for 4.7 to 14 days. The hMSCs were isolated and enriched from adult human bone marrow aspirates and cultured under adherent conditions in the Quantum system utilizing continuous feed protocols from Day 2 to 14. Medium feed rates were adjusted from 0.0 to 0.4 mL/min in the HFM intracapillary lumen (cells) and set at 0.1 mL/min in the HFM extracapillary loop in order to maintain a glucose concentration ≥ 70 mg/dL and O2/CO2 concentrations. Cells were released from the bioreactor surface with Gibco Trypsin-EDTA 0.25%, harvested with complete medium, and counted with a Beckman Coulter Vi-CELL™ XR Cell Viability Analyzer.
Expanded cells were induced for hMSC differentiation with Gibco StemPro® Adipogenesis, Chondrogenesis, and Osteogenesis Kits. Adipogenesis differentiation was begun by seeding 3.8 × 10⁴ cells/well (replicates of 4) in a 12-well tissue culture plate with 2 mL of complete media containing gentamycin/amphotericin B and GlutaMAX. Medium was exchanged twice weekly, and cells were grown to 80% confluency at 37°C (5% CO2, 20% O2, 75% N2 with humidity), at which point the media was exchanged with 2 mL of StemPro Adipogenic Differentiation Media for induction and exchanged twice weekly for 7 to 14 days. With the appearance of lipid vesicles, differentiated cells were subsequently stained with Oil Red O and counterstained with hematoxylin, and color images were captured at 40× and 100× magnification with phase-contrast microscopy. Chondrogenesis differentiation was begun by centrifuging (300× g for 7 minutes) 1.6 × 10⁷ MSCs and resuspending them in 0.5 mL of complete medium. The cell suspension (20 μL) was plated in duplicate wells of a 6-well tissue culture plate that was covered with parafilm. The cells were allowed to attach for 2 hours at 37°C (5% CO2, 20% O2, 75% N2 with humidity), after which the medium was aspirated and 4 mL of StemPro Chondrogenesis Differentiation Media (ODM) was added. ODM was exchanged the following day and twice weekly for up to 14 days. Rounded pellets were subsequently stained with Alcian blue stain overnight. After removing the Alcian blue stain, 2 mL of 2% acetic acid was added and plates were incubated for 5 minutes, acid was removed, and pellets were washed (3×) in 4 mL of deionized water. Deionized water was removed from the wells, the plate was air-dried, and Entellan® embedding agent (optional) was added. A coverslip was placed over the stained pellets with light pressure for 30 seconds. Color images were captured at 40 × and 100× with phase-contrast microscopy. Osteogenesis differentiation was begun by seeding each of 4 wells in a 12-well tissue culture plate with 1.9 × 10⁴ MSCs into 2 mL of complete media containing gentamycin/amphotericin B and GlutaMAX. Medium was exchanged twice weekly until cells reached 80% confluency. Complete media was removed, 2 mL of StemPro Osteogenic Differentiation Media was added to each well, and the plate was incubated at 37°C (5% CO2, 20% O2, 75% N2 with humidity) for 7 to 14 days (media change 2 × weekly). Once mineralization was evident, media was removed and each well was washed with 2 mL of phosphate buffered saline (PBS) and fixed with formalin for 30 minutes. Cells were washed once with deionized water and the water was removed, then 1 mL of Alizarin Red S stain solution per well was added and the plate incubated at ambient temperature at for 2 to 3 minutes. Stain was removed and washed with deionized water (3×) and counterstained with hematoxylin, and the plate was washed with deionized water (3×). Color images were captured with phase-contrast microscopy at 40× or 100× magnification.
Expression of CD146 in hMSCs expanded with different bioreactor coating proteins
Prior to cell seeding, the Quantum HFM bioreactor was coated with either lyophilized human fibronectin (BD Biosciences 356008) or with human platelet cryoprecipitate (hCPPT, Bonfils Blood Center, Denver, Colorado). Five milligrams of fibronectin (FN) was reconstituted in 10 mL sterile deionized water at ambient temperature and diluted with sterile PBS without Ca2+/Mg2+ (Lonza 17-516Q) to 100 mL. Twenty-five milliliters of human platelet cryoprecipitate were diluted to 100 mL with sterile PBS without Ca2+/Mg2+ overnight at 37°C.
Statistical Analysis
Minitab 17 (State College, PA) was used in the comparison of the group means in order to calculate the probability of significance associated with the Student’s t-test hypothesis at a confidence level of 95%. Regression analysis and the Pearson correlation coefficients were calculated with GraphPad Prism 7 (La Jolla, CA).
Results
Three-donor comparison of hMSC multilineage differentiation
Routine analysis of surface biomarkers by flow cytometry at P1T0 passage met the International Society for Cellular Therapy (ISCT) working group criteria for multipotent MSCs based on the phenotype type of CD19-, CD34-, CD45-, HLA-DR-, CD73+, CD90+, CD105+ biomarker expression (Figure 2A-C) [2].
The mean % population frequency of the 3 donor cell lineages was below the 2% threshold for negative biomarkers and was above the 95% threshold for the positive biomarker array. For comparative purposes, the error bars of hMSC phenotype are based on standard error of the mean (Figure 2C).

Figure 2A. Representative flow cytometry dot plots and histogram controls for hMSC surface biomarkers. Left to right populations: unstained, anti-IgG1-FITC isotype; anti-IgG1-APC + anti-IgG2a-FITC isotype; anti-IgG2a-PE/Cy7 isotype control stained

Figure 2B. Representative flow cytometry dot plots and histograms for hMSC surface biomarkers. Left to right populations: anti-CD34-APC/anti-CD45-PE; anti-CD73-PE; anti-CD105-APC/anti-HLA-DR-FITC; anti-CD146-PE/Cy7; and anti-CD19-APC/anti-CD90-FITC stained.

Figure 2C. Summary of surface biomarker expression per ISCT working group criteria for multipotent hMSCs.
CD146 biomarker expression in hMSCs
Cell aliquots of the same automated harvests from the 3 hMSC donors used in the differentiation study (Figure 3) were examined by fluorescent microscopy and confirmed the expression of CD146 transmembrane protein, Z01 tight-junction protein, and nuclear DNA (Figure 3A-D).

Figure 3. hMSCs stained with (A) BD mouse antihuman CD146 antibody-FITC, (B) Tight-junction protein rabbit anti-Z01 primary antibody, (C) DAPI (nucleus), and (D) 3-color composite overlay.
hMSC CD146 expression and differentiated cells
In our initial studies, BM-hMSCs from 3 healthy donor aspirates were cultured in the Quantum system. Following harvest from the bioreactor, the hMSCs were seeded to multiwell plates and induced for adipogenesis, chondrogenesis, and osteogenesis as previously outlined. After differentiation, hMSCs were stained and analyzed for the presence of the CD146 biomarker (Figures 4A-C and 5). The average CD146+ MFI of uninduced, stained hMSCs in the 3 donor cell lineages was 2,329 versus the average MFI of unstained, uninduced hMSCs, which was 22. By comparison, the average CD146+ MFI of induced adipocytes was 405 versus the unstained, induced adipocytes MFI of 120. The average CD146+ MFI of induced chondrocytes was 854 versus the unstained, induced chondrocytes MFI of 202. The mean CD146 index at the point of the automated harvest over the 3 hMSC lineages was 106. In comparison, the mean CD146 index of adipogenic confluent-uninduced cells and adipogenic confluent-induced cells were both 3. This is equivalent to a 35-fold reduction of CD146 expression. The mean CD146 index of chondrogenic confluent-induced cells was 4, which is equivalent to a 26-fold reduction in CD146 expression. As a result, these data suggest that the CD146 biomarker expression is reduced at the point of hMSC differentiation. Measurements of CD146 MFI in cells undergoing osteogenesis were not feasible due to the mineralization of the committed lineages. The confluent, uninduced cells in the differentiation assay generated a CD146 index of 3 (MFI 72/22), which further indicates that the CD146 biomarker is downregulated when hMSCs reach confluency.

Figure 4A. Representative CD146 flow cytometry dot plots and histograms of hMSCs at bioreactor harvest, confluency, and differentiation. Left to right: Harvest, unstained; Harvest, anti-CD146-PE/Cy7; Adipogenesis, confluent/uninduced/unstained; Adipogenesis, confluent/uninduced/anti-CD146-PE/Cy7.

Figure 4B. Representative CD146 flow cytometry dot plots and histograms of hMSCs at bioreactor harvest, confluency, and differentiation. Left to right: Adipogenesis, confluent/induced/anti-CD146-PE/Cy7; Chondrogenesis, confluent/uninduced/unstained; Chondrogenesis, induced/unstained; Chondrogenesis, induced/ anti-CD146+PE/Cy7)

Figure 4C. CD146 Expression at the point of automated bioreactor harvest and through hMSC differentiation

Figure 5. Harvested hMSCs from the Quantum system displayed representative trilineage differentiation as a result of induced adipogenesis, chondrogenesis, and osteogenesis as evidenced by the Oil Red O stained lipid vesicles, Alcian blue stained glycosaminoglycans, and Alizarin Red S stained calcium deposition, respectively
Retrospective hMSC expansion review
A retrospective review of 55 automated hMSC expansions involving an assessment of CD146 was undertaken to develop a sense of the putative biomarker expression in relation to cell doublings and/or passage number (PX). This cohort of CD146 index data includes hMSCs expanded in HFM bioreactors coated with FN or hCPPT and cells grown with complete medium supplemented by either FBS or hPL.
The linear regression analysis of mean biomarker indexes indicates a trend towards a reduction in the hMSC CD146 expression index from the bone marrow aspirate (P0) stage through passage P3 over 13.2 to 27.0 cell doublings (Figure 6). However, the slope of this trend may be skewed by the number of runs using hCPPT versus those performed with FN as a bioreactor coating agent, which is also reflected in the Pearson correlation coefficient R2 value of 0.84 and the P2 index value. Other investigators have observed a similar trend in C146 biomarker expression in adipose-derived mesenchymal stem cells (ASCs). For example, the different growth rates of ASCs appeared to correlate with CD146 levels, although its expression level gradually decreased with cell passage number [18]. In our studies, there was no significant difference between FN-coated and hCPPT-coated bioreactors in the maintenance of CD146 expression over the population doublings of 13.0 to 28.4 (P0→P3) within this sample population.

Figure 6. Retrospective assessment of CD146 expression in 55 automated hMSC bioreactor expansion runs
Relative expression of CD146 in an FN-coated quantum HFM bioreactor
The relative expression of CD146 was evaluated across 3 successive cell passages (n=3) of BM-hMSCs in the Quantum system HFM bioreactor. The mean CD146 indexes were 804 (P0) at 13 doublings, 545 (P1) at 18.6 doublings, and 177 (P3) at 24.2 doublings (Figure 7). There was no significant difference between the P0 and P1 passages, nor was there any significant difference between the P1 and P2 passages. However, the difference between P0 and P2 was both significant and indicative of the 4.6 fold reduction in CD146 expression associated with increasing cell age under this ex vivo expansion condition. It has been our experience that high variance is frequently associated with P1 passages and reflects the heterogeneity of BM-hMSC populations from donor to donor in response to normoxic (11% to 20% O2) culture conditions. With an FN-coated HFM bioreactor, the hMSC harvest yields ranged from 4.29 × 10⁷ to 1.74 × 10⁸ cells in P0, from 2.41 × 10⁸ to 4.05 × 10⁸ cells in P1, and from 2.39 × 10⁸ to 5.53 × 10⁸ cells in P2.

Figure 7. Relative CD146 expression in hMSCs across 3 successive cell passages in the Quantum system
Comparison of CD146 expression in FBS-Versus hPL-supplemented medium
Additional studies compared the hMSC CD146 expression in the expansion from bone marrow aspirates through passage P2 in the Quantum system, using an hCPPT-coated bioreactor with either FBS- or hPL-supplemented medium. The combination of hCPPT and FBS-supplemented medium generated a reduction in the CD146 index (244→178→100) over cell doublings 13.7, 19.4, and 23.9 (Figure 8). In contrast, the combination of hCPPT and hPL-supplemented medium gave rise to an increase in the CD146 index (17→83→167) over similar cell doublings 14.0, 20.3, and 25.0 (Figure 8). This could be due to the growth factor composition of the different media supplements and the concentrating effects of the HFM bioreactor membrane, which has an estimated molecular cutoff of 19 kDa. For instance, platelet-rich plasma (PRP) is known to contain concentrated plateletderived growth factor (PDGF, ~24.3 kDa) and vascular endothelial growth factor (VEGF, ~40 kDa) in preparations of serum or plasma respectively in minipigs [19]. Human PRP is also known to contain PDGF and plateletderived endothelial growth factor (PDEGF) at levels that are higher than that found in rat or goat PRP [20,21]. Josh et al. have shown that concentrating PDGF-AB and -BB are valuable parameters in managing ASC proliferation [22]. With a CPPT-coated bioreactor using FBS-supplemented or hPL-supplemented media, the hMSC harvest yield ranged from 1.32 × 10⁸ to 1.60 × 10⁸ cells in P0, from 5.62 × 10⁸ to 8.16 × 10⁸ in P1, and from 1.92 × 10⁸ to 4.13 × 10⁸ in P2 respectively.

Figure 8. A comparison of the relative CD146 expression in hCPPT-coated bioreactor in BM-hMSCs with FBS- or hPL-supplemented medium
Feasibility assessment of different medium feeding schedules on the differentiation potential of hMSCs
An initial study of 3 different cell growth medium feed rates on an FN-coated Quantum bioreactor was performed to begin the assessment of CD146 expression over a range of expansion protocols. The Control, Conservative, and Aggressive feeding regimens over the 6.9-day culture period are defined in terms of their intracapillary (IC) Medium Flow Rate (Table 1).
| Quantum system model feeding regimen |
Intracapillary (IC) medium feed rate (mL/min) |
Cell culture period (days) |
|---|---|---|
| Control | 0.1 → 0.1 → 0.2 → 0.4 → 0.8 | 6.9 |
| Conservative | 0.2 → 0.3 → 0.5 → 0.8 → 1.0 | 6.9 |
| Aggressive | 0.2 → 0.4 → 0.8 → 1.2 → 1.6 | 6.9 |
Table 1. Options for Quantum system medium feeding regimens for the expansion of selected hMSCs Passage P3T2
Three Quantum system bioreactors were seeded in parallel with 2.0 × 10⁷ hMSC suspensions derived from the same BM-aspirate donor and expanded over a similar cell doubling period (22.6 to 23.0; Table 2). The results at passage P3 suggest that the Control feed rate generated the highest CD146 index of 238 with a harvest of 3.94 × 10⁸ hMSCs, and the most Aggressive feed rate generated a CD146 index of 115 with a harvest of 4.73 × 10⁸ hMSCs. The Conservative feed rate produced an intermediate CD146 index of 156 with an intermediate harvest of 3.65 × 10⁸ hMSCs. The potential ramifications will be discussed below.
| Bioreactor feeding regimen | hMSC doublings | CD146 MFI Index | hMSC harvest |
|---|---|---|---|
| Control | 22.7 | 238 | 3.94 × 10⁸ cells |
| Conservative | 22.6 | 156 | 3.65 × 10⁸ cells |
| Aggressive | 23.0 | 115 | 4.73 × 10⁸ cells |
Table 2. The effect of medium addition rates to the automated ex vivo expansion of hMSC in an HFM bioreactor system. Relative CD146+ expression of BM-derived hMSC-P3T2 expanded with 3 different feeding schedules. Systems seeded at 2.0 x 10⁷ cells per FN-coated bioreactor
Impact of an hCPPT-coated bioreactor on the expression of CD146 in hMSC over 4 passages
Next, we followed the expression of CD146 in hMSCs from bone marrow aspirates (P0) of 2 donors to passage P3 in bioreactors coated with hCPPT at the rate of 25 mL per single donor equivalent resuspended in 75 mL of PBS. The average cell seeding was 9.91 × 10³ hMSCs in P0 (n = 4), 1.31 × 10⁷ hMSCs in P1 (n=7), and 1.52 × 10⁷ hMSCs in P2 (n=9) and P3 (n=7). At the point of harvest in the automated HFM bioreactor systems, the CD146 indexes at the mean population cell doubling were 243 at 13.8 doublings (P0), 294 at 18.4 doublings (P1), 401 at 23.8 doublings (P2), and 120 at 28.2 doublings (P3) respectively (Figure 9). There was a general increasing trend in the expression of the CD146 biomarker in passages P0 through P2, followed by a reduction in passage P3. However, the only significance difference in the CD146 index occurred between passages P2 (23.8 doublings) and P3 (28.2 doublings). With an hCPPT-coated bioreactor over 4 passages, hMSC harvest yield ranged from 1.11 × 10⁸ cells to 1.60 × 10⁸ cells in P0, from 1.98 × 10⁸ to 8.16 × 10⁸ cells in P1, from 1.38 × 10⁸ to 7.58 × 10⁸ cells in P2, and from 1.61 × 10⁸ to 3.44 × 10⁸ cells in P3.

Figure 9. Relative CD146+ expression in BM-hMSCs across 4 passages in an automated hCPPT-coated bioreactor system
Through our overall experience, we have defined the minimum criterion for CD146 expression as an index value of at least 10 with respect to hMSC expansion. As such, the hMSC expansion protocol met this requisite in the hCPPT-coated bioreactor system from population doublings 13.8 to 28.2 (P0→P3).
Maintenance of oxygen concentration in hMSC culture
Maintenance of the dissolved oxygen concentration is critical in cell culture, particularly under increasing cell concentrations [23]. Physiological values of pO2 in human tissues range from 6.4% in the bone marrow to 13.2% in arterial blood and up to 19.7% in inspired air (tracheus) [24]. Therefore, a cell culture system must be responsive to varying oxygen demands. This can be delayed in the case of a biomarker, like CD146 expression in hMSC culture, that is upregulated under static, normoxic conditions, where the adjustment can take hours or days to overcome oxygen fluctuations [23,25]. Dynamic cell culture offers an approach to overcome this limitation. For example, at an extracapillary (EC) circulation rate of 30 mL/minute, the GTM in the Quantum system has been shown to recover dissolved oxygen concentrations from 5.8% to 11.1% in 6.0 minutes and up to 18.0% in 93.2 minutes in the HFM bioreactor with complete medium and a mixed gas supply of 5% CO2, 20% O2, 75% N2 (Figure 10A). At an EC circulation rate of 300 mL/ min, the GTM has been shown to recover dissolved oxygen concentrations from 5.5% to 11.4% in 2.7 minutes and up to 18.0% in 23.0 minutes (Figure 10B). In the case of hMSC expansion, periodic adjustments to the EC circulation rate from 30 to 300 mL/ min demonstrate that the GTM maintains the oxygen concentration at or near 18% during dynamic cell culture over an extended period (Figure 10C). With an automated bioreactor such as that in the Quantum system, a range of EC circulation rates can be preprogrammed to support GTM oxygen concentrations along with media additions for specific growth requirements, including the expression of CD146 in hMSCs and stabilization of multipotent differentiation capacity.

Figure 10. Gas transfer module (GTM) performance under different EC circulation rates: (A-top) Complete media with EC circulation rate at 30 mL/min, (B-middle) Complete media with EC circulation rate at 300 mL/min, and (C-bottom) Maintenance of pO2 levels over the course of an hMSC expansion in the Quantum system HFM bioreactor using complete media and mixed gas (5% CO2, 20% O2, 75% N2).
Discussion
One of the challenges in expanding hMSCs is the quantification of the potential for cellular differentiation. We undertook a series of expansions with various BM-derived hMSC populations that express the CD146 surface biomarker. These populations contain multipotent progenitor cells that are thought to be similar to or are also progenitors of human microvascular pericytes (CD146+, CD34-, CD45-, CD56-), since they both express CD146+ and produce VEGF [26,27]. CD146 expression is evident in multipotent hMSCs and is also downregulated in confluent and differentiated cells. Our early findings in the feeding schedule study suggest that a more moderate rate of medium addition can give rise to a higher hMSC differentiation potential during the cell culture process (Figure 9). Additional studies may further define this automated task in more detail for proliferating MSCs.
By virtue of the MSC studies performed by Russell, Sacchetti, and others, we have accepted the premise that CD146 represents a transmembrane protein in hMSCs that can be used to quantify the potential potency of hMSCs prior to their differentiation. Our studies have demonstrated that the expression of CD146 transmembrane biomarker in BMderived hMSCs can be maintained from the point of isolation in bone marrow aspirate through 23.8 cell doublings when cultured in an automated hCPPT-coated Quantum system with a HFM bioreactor. Furthermore, we found that while the CD146 biomarker is maintained during the undifferentiated cell expansion, it is downregulated when these cells reach confluency and become lineagecommitted. This provides a convenient inprocess method to correlate hMSC potency with the age of stromal cells particularly in terms of the cell doubling metric and without lengthy differentiation assays. Moreover, the different biomarker responses in the hCPPTcoating study may have been due to the polymorphisms associated with xenobiotic growth factors versus the more species compatible isoforms or the concentration of activated transforming growth factor β (TGF-β) in FBS over time.
In addition, we were able show that CD146 expression appears to be independent of the automated Quantum system bioreactor cell seeding method. Other factors such as cell concentration, supplements, the rate of media addition, rate of cell proliferation, and donor variability may also affect the expression of CD146 in hMSCs. For example, in evaluating hMSCs for their CD146 expression and their multilineage differentiation capacity, some investigators have propagated hMSCs under confluent conditions. These cells are believed to be lineage-committed [28,29]. We found that the expression of CD146 on actively growing BM-hMSCs in the Quantum system bioreactor is well above the biomarker expression levels observed in lineage-committed, confluent, or differentiated hMSCs by 2- to 34-fold in terms of an MFI index [30]. When comparing the effects of FBS or hPL as a media supplement in hMSCs cultured on a coated bioreactor, the CD146 index reached 400 (passage P2, DS 23.8) in hMSC culture at harvest. Overall, our findings suggest that there is a relationship between the use of hCPPT or FN coating agents, to different degrees, and the preservation of the CD146 biomarker expression in hMSCs under automated hollow fiber bioreactor culture conditions. Tormin et al. have shown that CD146 in hMSCs is upregulated in normoxia conditions and downregulated in hypoxia conditions [4]. One of the advantages of the Quantum system is the ability to adjust the gas exchange with changes in cell culture density separately from the media addition rates. To this end, the Quantum system is equipped with a GTM that is characterized by a surface-to-volume ratio 30-fold greater than a T225 flask. This allows the oxygen concentration to be modified across a broad range of normoxic concentrations (5%-18% O2) to support the exponential growth of hMSCs while preserving CD146 expression over the course of single or multiple passages by adjusting the extracapillary flow rate through the GTM.
Stroncek et al. have suggested another approach to measure hMSC potency that uses 24 senescence genes in a global gene expression panel to predict the replicate age of expanded MSCs [31]. This method requires a computational biology analysis program and a regression algorithm that is microarraydependent [32]. Studies comparing phenotypic biomarker expression used in transplantation to gene expression panels versus cell age may be helpful in determining the most constructive protocol for hMSC bioprocessing and the quantification of differentiation in the future [3,33,34].
Conflicts of Interest Statement
All authors are associates of Terumo BCT, Inc. (Lakewood, CO, USA) and have no competing financial interests to declare.
References
- Squillaro T, Peluso G, Galderisi U. Clinical trials with mesenchymal stem cells: an update. Cell. Trans. 25(5), 829-848 (2016).
- Dominici M, Le Blanc K, Mueller I et al. Minimal criteria for defining multipotent mesenchymal stromal cells. Cytother. 8(4), 315-317 (2006).
- Wu CC, Liu FL, Sytwu HK et al. CD146+ mesenchymal stem cells display greater therapeutic potential than CD146- cells for treating collagen-induced arthritis in mice. Stem. Cell. Res. Ther. 7, 23 (2016).
- Tormin A, Li O, Brune JC et al. CD146 expression on primary nonhematopoietic bone marrow stem cells is correlated with in situ localization. Blood. 117(19), 5067-5077 (2011).
- McBeath R, Pirone DM, Nelson CM et al. Cell shape, cytoskeletal tension, and RhoA regulate stem cell lineage commitment. Dev. Cell. 6(4), 483-495 (2004).
- Ouhtit A, Gaur RL, Abd Elmageed ZY et al. Towards understanding the mode of action of the multifaceted cell adhesion receptor CD146. Biochim. Biophys. Acta. 1795(2), 130-136 (2009).
- Covas DT, Panepucci RA, Fontes AM et al. Multipotent mesenchymal stromal cells obtained from diverse human tissues share functional properties and gene-expression profile with CD146+ perivascular cells and fibroblasts. Exp. Hematol. 36(5), 642-654 (2008).
- Baksh D, Yao R, Tuan RS. Comparison of proliferative and multilineage differentiation potential of human mesenchymal stem cells derived from umbilical cord and bone marrow. Stem. Cell. 25(6), 1384-1392 (2007).
- Russell KC, Phinney DG, Lacey MR et al. In vitro high-capacity assay to quantify the clonal heterogeneity in trilineage potential of mesenchymal stem cells reveals a complex hierarchy of lineage commitment. Stem. Cell. 28(4), 788-798 (2010).
- Lee SS, Lee SJ, Lee SH et al. Netrin-1-induced stem cell bioactivity contributes to the regeneration of injured tissues via the lipid raft-dependent integrin alpha6beta4 signaling pathway. Sci. Rep. 6, 37526 (2016).
- Sacchetti B, Funari A, Michienzi S et al. Self-renewing osteoprogenitors in bone marrow sinusoids can organize a hematopoietic microenvironment. Cell. 131(2), 324-336 (2007).
- Lv FJ, Tuan RS, Cheung KM et al. Concise review: the surface markers and identity of human mesenchymal stem cells. Stem. Cell. 32(6), 1408-1419 (2014).
- Barckhausen C RB, Baila S, Sensebe L et al . GMP-compliant expansion of clnical -grade human mesenchymal stromal/stem cells using a closed hollow fiber bioreactor. Springer Science+Business Media, NewYork.
- Wellbrock J, Fiedler W. CD146: a new partner for VEGFR2. Blood. 120(11), 2164-2165 (2012).
- Tu T, Zhang C, Yan H et al. CD146 acts as a novel receptor for netrin-1 in promoting angiogenesis and vascular development. Cell. Res. 25(3), 275-287 (2015).
- Prieto CP, Ortiz MC, Villanueva A et al. Netrin-1 acts as a non-canonical angiogenic factor produced by human Wharton's jelly mesenchymal stem cells (WJ-MSC). Stem. Cell. Res. Ther. 8(1), 43 (2017).
- Sherley JL, Stadler PB, Stadler JS. A quantitative method for the analysis of mammalian cell proliferation in culture in terms of dividing and non-dividing cells. Cell. Proliferation. 28(3), 137-144 (1995).
- Lee NE, Kim SJ, Yang SJ et al. Comparative characterization of mesenchymal stromal cells from multiple abdominal adipose tissues and enrichment of angiogenic ability via CD146 molecule. Cytotherapy. 19(2), 170-180 (2017).
- Jungbluth P, Grassmann JP, Thelen S et al. Concentration of platelets and growth factors in platelet-rich plasma from Goettingen minipigs. GMS. Interdisciplinary. Plastic. Reconstructive. Surg. (2014).
- Lacci KM, Dardik A. Platelet-rich plasma: support for its use in wound healing. Yale. J. Biol. Med. 83(1), 1-9 (2010).
- van den Dolder J, Mooren R, Vloon AP et al. Platelet-rich plasma: quantification of growth factor levels and the effect on growth and differentiation of rat bone marrow cells. Tissue. Engg. 12(11), 3067-3073 (2006).
- Josh F, Tobita M, Tanaka R et al. Concentration of PDGF-AB, BB and TGF-beta1 as valuable human serum parameters in adipose-derived stem cell proliferation. J. Nippon. Med. School. 80(2), 140-147 (2013).
- van der Sanden B, Dhobb M, Berger F. Optimizing stem cell culture. J. Cell. Biochem. 111(4), 801-807 (2010).
- Carreau A, El Hafny-Rahbi B, Matejuk A et al. Why is the partial oxygen pressure of human tissues a crucial parameter? Small molecules and hypoxia. J. Cell. Mol. Med. 15(6), 1239-1253 (2011).
- De Bernardi N, Schwander E, Orlandi A et al. Oxygen control in static cell cultures. Cell. Tech. Cell. Prod. 739-744, (2007).
- Darland DC, Massingham LJ, Smith SR et al. Pericyte production of cell-associated VEGF is differentiation-dependent and is associated with endothelial survival. Dev. Biol. 264(1), 275-288 (2003).
- Mayer H, Bertram H, Lindenmaier W et al. Vascular endothelial growth factor (VEGF-A) expression in human mesenchymal stem cells: autocrine and paracrine role on osteoblastic and endothelial differentiation. J. Cell. Biochem. 95(4), 827-839 (2005).
- Oswald J, Boxberger S, Jorgensen B et al. Mesenchymal stem cells can be differentiated into endothelial cells in vitro. Stem. Cell. 22(3), 377-384 (2004).
- Abo-Aziza FAM, A AZ. the impact of confluence on bone marrow mesenchymal stem (bmmsc) proliferation and osteogenic differentiation. Int. J. Hematol-Oncol. Stem. Cell. Res. 11(2), 121-132 (2017).
- Sorrentino A, Ferracin M, Castelli G et al. Isolation and characterization of CD146+ multipotent mesenchymal stromal cells. Exp. Hematol. 36(8),1035-1046 (2008).
- Stroncek DF, Sabatino M, Ren J et al. Establishing a bone marrow stromal cell transplant program at the National Institutes of Health Clinical Center. Tissue. Engg. 20(3), 200-205 (2014).
- Ren J, Stroncek DF, Zhao Y et al. Intra-subject variability in human bone marrow stromal cell (BMSC) replicative senescence: molecular changes associated with BMSC senescence. Stem. Cell. Res. 11(3), 1060-1073 (2013).
- Ramakrishnan A, Torok-Storb B, Pillai MM. Primary marrow-derived stromal cells: isolation and manipulation. Methods. Mol. Biol. 1035, 75-101 (2013).
- Ren J, Wang H, Tran K et al. Human bone marrow stromal cell confluence: effects on cell characteristics and methods of assessment. Cytotherapy. 17(7), 897-911 (2015).