Research Article - Imaging in Medicine (2016) Volume 8, Issue 4
Estimation of effective Poissons ratio in non-homogeneous porous media using two ultrasound transducers: A feasibility study
Anuj Chaudhry1, Thomas Krousko2, Peer Shajudeen1 and Raffaella Righetti *1
1Department of Electrical and Computer Engineering, Texas A&M University, TX, USA
2School of Allied Health Sciences, Baylor College of Medicine, TX, USA
- *Corresponding Author:
- Raffaella Righetti
Department of Electrical and Computer Engineering
Texas A&M University, TX, USA
Tel: 77843-3128
E-mail: righetti@ece.tamu.edu
Abstract
Ultrasound poroelastography techniques aim at assessing the poroelastic response of materials to prolonged loading by estimating and mapping the time-dependent distribution of the local axial strain and lateral-to-axial strain ratio, often referred to as the effective Poissons ratio (EPR). Theoretically, both axial stain and EPR elastograms can convey information about the underlying mechanical properties of the poroelastic material. However, the image quality of EPR elastograms is limited by the poor quality of standard lateral strain estimation. In this paper, we investigate a new method to estimate EPR in non-homogeneous porous media using two linear array transducers. We test the feasibility of this technique using finite-element analysis and experimental validation. The results of this study suggest that, using this new technique, it is feasible to estimate the temporal behavior of EPR with significantly higher image quality than previously possible.
Keywords
cancer imaging, effective poisson’s ratio, elastography, lateral strain imaging, tissue compressibility, tissue elasticity imaging, ultrasound.
Introduction
Ultrasound elastography is a well-established imaging technique, which is used primarily to map the stiffness or stiffness contrast in biological tissues [1,2]. Poroelastography is one of the ultrasound elastography techniques, which is used to assess the mechanical behavior of tissues that can be modeled as poroelastic materials [3-5]. A poroelastic material is defined as a multi-phasic material in which at least one of the phases is not solid [6]. Most biological tissues such as cartilage, brain, liver, kidney, breast and prostate behave as poroelastic materials due to their high fluid content and mobility [7-12]. Most cancers such as that of the breast, neck, prostate and liver are known to possess altered fluid transport due to a collapse of the interstitial matrix, cellular deposition, leaky microvasculature and weak lymphatic drainage [13-20]. These mechanisms lead to high interstitial fluid pressure and reduced interstitial permeability in the tumor [19]. Additional pathological conditions or treatments alter the underlying fluid flow properties of tissues, which can affect their poroelastic response [21].
In poroelastography, the goal is to estimate and map the spatial and temporal behavior of the axial strain and the ‘effective’ Poisson’s ratio (EPR) experienced by the tissue under compression [22]. The EPR elastogram is obtained as the point-by-point ratio between the lateral strain elastogram and the corresponding axial strain elastogram [21]. This image is related to the compressibility of a poroelastic tissue - a mechanical tissue parameter that changes with the onset of a number of diseases (such as cancers and lymphedema) and may be an indicator of the propensity of a tissue to heal and/or the efficacy of many treatments such as targeted delivery therapies [9]. While many soft tissues are often modeled as incompressible elastic solids, a poroelastic material is by definition compressible because it allows change in volume upon compression due to fluid exudation and relocation. Compressibility changes are reflected in changes in the spatial distribution and temporal behavior of the EPR. However, in standard poroelastography experiments, the image quality of EPR elastograms is limited by the poor quality of lateral strain elastography [23-25]. Some studies have shown that the application of interpolation combined with advanced filtering techniques and spatial and temporal averaging can improve the quality of lateral strain elastography and EPR [22,26]. In clinical situations, however, averaging can be difficult due to tissue motion, noise and changes in fluid content between successive experiments and can also be time consuming precluding real-time feedback. Recently, a technique that employs two separate measurements from a single transducer was proposed to improve 2D axial displacement estimation by improving lateral tracking [27]. However, the study did not address the application of the technique to estimation of EPR. Also in the current form using two successive distinct measurements would not be suitable for EPR estimation in poroelastic materials since these materials exhibit temporal changes under compression.
In this paper, we explore the feasibility of using a dual transducer technique to image the EPR in non-homogenous poroelastic materials. A statistical comparison between results obtained using the dual transducer method and the standard single transducer method (with and without averaging) is carried out. Experimental validation is demonstrated in a non-homogeneous phantom. These results show that, in principle, the proposed dual transducer method can produce EPR elastograms with high image quality and reliability and without the use of spatial and temporal averaging. An integrated discussion of the applicability of the proposed method in clinical settings is included.
Method
We propose the use of two distinct ultrasound transducers to simultaneously estimate the axial strain and lateral strain distributions in poroelastic materials. Details on the geometric configuration of the two transducers, their calibration and registration are reported below. FIGURE 1 shows the data acquisition set up for the proposed method. The top transducer is used to compress the tissue and estimate the axial strain distribution. The transducer on the side is co-registered to the top transducer and positioned at a 90° with respect to the top transducer. This transducer is used to estimate the lateral strain distribution in the tissue. In this configuration, the lateral strain distribution in the tissue is estimated using axial data acquired by the transducer positioned on the lateral side of the tissue. The EPR at any given time is computed as the ratio of the co-registered lateral strain distribution and the axial strain distribution at that specific time. An analysis of the quality of EPR estimation using the dual transducer method is carried out using finite element simulations and experiments performed on a non-homogeneous phantom.

Figure 1. Experimental setup used for the twotransducer technique.
Finite element (FE) simulations
To test the feasibility of the dual transducer acquisition and estimation method, finite element (FE) simulations were performed. These simulations are similar to those used in [28]. Specifically, a tumor model with different fluid flow properties between the inclusion and background was simulated. We used a 40*40 mm2 2D rectangular domain with a circular inclusion of 15 mm diameter embedded in the center. Baseline material properties were chosen in the range of human tissues on the basis of previous literature [22,23,29]. Young’s modulus and Poisson’s ratio of both the background and the inclusion were fixed at 1.74 kPa and 0.25 kPa respectively as in [28]. To vary the fluid flow, permeability was varied between the background and the inclusion as listed in TABLE 1. Creep compression was simulated between two impervious plates for 600 s. The acquisition gap was set to 0.5 s. These parameters were chosen based on previous studies conducted in our lab [30,31]. Pre- and post-compression ultrasound RF data were simulated using a convolution model [32-34]. The simulated ultrasound transducer had 128 elements, frequency bandwidth between 5-14 MHz, a 6.6 MHz center frequency and 50% fractional bandwidth at -6 dB. The transducer’s beamwidth was assumed to be dependent on the wavelength and to be approximately 1 mm at 6.6 MHz. The sampling frequency was set at 40 MHz and Gaussian white noise was added to set the SNRs at 40 db. Axial strains were computed for both transducers at each time sample using cross-correlation based elastography algorithms [5,35]. The length of the correlation window, both for the pre- and post-compression signals, was fixed at 1.5 mm with an 80% overlap between adjacent windows.
| Contrast | Permeability Inclusion k (m4/N.s) | Permeability background k (m4/N.s) |
|---|---|---|
| 10 dB | 1.95 × 10⁻⁹ | 1.95 × 10⁻⁸ |
| 20 dB | 1.95 × 10⁻¹⁰ | 1.95 × 10⁻⁸ |
| 25 dB | 9.75 × 10⁻¹⁰ | 1.95 × 10⁻⁸ |
| 30 dB | 1.95 × 10⁻¹¹ | 1.95 × 10⁻⁸ |
Table 1. Permeability values for the inclusion and the background materials used for the finite element simulations.
Experiments
Three non-homogenous phantoms were created using tofu (Banyan foods, Houston, TX) as the material background and gelatin as the inclusion background similarly as in [21]. The size of the tofu was 6 cm*6 cm*6 cm with a cylindrical gelatin inclusion of 15 mm diameter. The gelatin inclusion was created by mixing 5% porcine gelatin (Sigma-Aldrich, USA) with 3% agar (Sigma-Aldrich, USA) as in [33]. FIGURE 1 show the experimental setup used in the study. The phantom was compressed from the top between the two plates and subjected to creep compression for 600 s [30].
Elastography experiments were performed using two identical Ultrasonix RP (Richmond, Canada) linear array transducers with 128 elements, 1 mm beam width and 50% fractional bandwidth and 6.6 MHz center frequency. Firing both the transducers at the same time led to acoustic interference between the ultrasound signals transmitted and received by the two devices. To avoid this source of noise, ultrasound RF data were acquired alternatively by the two transducers with a time difference of 50 minutes between paired acquisitions. The local axial and lateral strains at each time sample were computed using cross-correlation based elastography algorithms [5]. The length of the cross-correlation window, both for the pre- and post-compression signals, was fixed at 1.5 mm with an 80% overlap between adjacent windows, as for the simulation data. Strain images from the two transducers were computed in the same way as reported for the simulation data. Experiments were carried out under water to maintain good ultrasonic contact between the phantom and the transducers.
Estimation of EPR using the dual transducer method
For reliable estimation of EPR, the two transducers should scan the same image plan and should be orthogonal to each other. To address these constraints, the transducers were manually calibrated using the following calibration technique. A rectangular calibration phantom (40 mm*20 mm*1 mm) as shown in FIGURE 2 was 3D printed from ABS plastic. The phantom was scanned using the two transducers to obtain two B-mode images, one from each transducer. The specular reflection from the two orthogonal edges was segmented out in the B-mode images, and their angle with respect to each other was calculated. The relative position of the two transducers was manually adjusted and the experiment was repeated until the computed angle between the specular reflectors was found to be 90° ± 0.1°.

Figure 2. The calibration phantom used to calibrate the axial and lateral transducers.
As previously mentioned, the EPR elastogram is obtained by dividing co-registered lateral strain and axial strain elastograms. Image registration was performed using a feature based segmentation technique. The inclusion from the lateral and axial strain elastograms was segmented by global thresholding, which automatically determines an intensity threshold that best separates the stain elastograms into two regions (bimodal histogram) and the largest blob is isolated. The centroid positions of the respective blobs are the input parameters to an affine transformation. The affine transformation rotated (90°) and translated the lateral strain image to the coordinates of the axial strain image [36]. The output of the affine transformation is the lateral strain image registered to the axial strain image. The EPR poroelastogram was displayed as a timesequence of EPR elastograms [22].
Statistical analysis
To analyze the quality of the obtained poroelastograms, we used two parameters than have been previously used in elastography studies- the elastographic contrast to noise ratio (CNRe) and the mean absolute error (MAE). The EPR CNRe has been defined as [26].
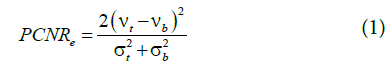
Where ν_t is the estimated EPR of the inclusion and ν_b is the estimated EPR of the background and σt and σb are the corresponding standard deviations.
The MAE provides an assessment of the accuracy of the estimation as compared to the expected or true value. The lower the MAE, the higher is the accuracy. MAE is mathematically defined as:
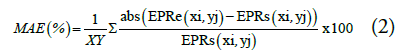
where EPRe is the estimated EPR and EPRs is true or actual value of EPR from the FE simulations, x and y are the image co-ordinates and the product XY being the total number of pixels in the image. These two quality factors were used to compare the performance of the dual transducer method with that of a single transducer method with and without averaging.
Results
FIGURE 3 shows examples of simulated EPR poroelastograms for a 25 dB permeability contrast between the inclusion and background: first row refers to the ideal strain ratio images obtained directly from the FE model; second row refers to the EPR images obtained using a single transducer with no averaging or filtering; third row refers to the EPR images obtained using a single transducer with multi-experiment averaging (30 independent realizations) and 5 by 5 pixels median filtering [21]; and fourth row refers to the EPR images obtained using the dual transducer method with no averaging and 5 by 5 pixels median filtering.

Figure 3.Simulated EPR poroelastograms for a 25 dB permeability contrast generated by: (a) FE model; (b) single transducer no averaging; (c) single transducer with averaging; and (d) dual-transducer method (no averaging). For the purpose of illustration, a 5 × 5 pixels median filter was applied to each image.
It can be seen that the EPR images of the dual transducer technique have the closest resemblance to the FE results. FIGURE 4 and FIGURE 5 show the estimated EPR CNRe and MAE for the cases shown in FIGURE 3. As it can be seen from FIGURE 4, the lowest estimated EPR CNRe was the one corresponding to the single transducer implementation and the highest was the one corresponding to the FE model. The dual transducer technique had a significantly higher EPR CNRe than both single transducer methods. Similar considerations can be derived from the MAE plots shown in FIGURE 5. Similar results were also obtained for all inclusion/background permeability contrasts analyzed in this study. The MAE caused by the 50 min gap between the axial and lateral acquisition was also quantified using simulations, and the peak MAE was found to be 3.5%. In all contrast cases analyzed in this study, the dual transducer method was the one providing the closest quality factors and qualitative images to the ideal FE results.

Figure 4.EPR CNRe comparison between the dual transducer method, FE model, single transducer with averaging and single transducer with no averaging for the case shown in FIGURE 3.

Figure 5.Mean absolute error (MAE) comparison for the cases shown in FIGURE 3.
FIGURE 6 shows examples of simulated EPR poroelastograms obtained for different inclusion/background permeability contrasts. A contrast in the underlying permeability creates a contrast in the corresponding poroelastograms. FIGURE 7 shows the corresponding EPR CNRe for the cases shown in FIGURE 6. It can be observed that both the values and temporal behavior of the EPR and the EPR CNRe vary with underlying permeability contrast.

Figure 6.Simulated EPR poroelastograms obtained using the dual transducer method for the following inclusion/background permeability contrasts: (a) 30 dB; (b) 25 dB; (c) 20 dB; and (d) 10 dB. For the purpose of illustration, a 5 × 5 pixels median filter was applied to each image.

Figure 7.EPR CNRe plots for the dual transducer technique for different simulated inclusion/ background permeability contrasts. Each point in the graph is the mean over 30 independent realizations and the error bars is the standard deviation over the 30 independent realizations.

Figure 8.Experimental EPR poroelastogram obtained from a tofu-gelatin inclusion phantom using the dual transducer technique. For the purpose of illustration, a 5 × 5 pixels median filter was applied to each image.

Figure 9.Experimental mean EPR as a function of time for the case shown in FIGURE 8. The red curve refers to the tofu background, which is known to behave as a poroelastic material. The blue curve refers to the gelatin inclusion, which does not appear to exhibit significant temporal changes within the time interval used for the experiment.
FIGURE 8 and FIGURE 9 show a set of experimental results obtained from a gelatin/ tofu phantom. FIGURE 8 shows an EPR poroelastogram generated using the dual transducer method with no averaging. In FIGURE 9, the mean of the observed EPR as computed from the images shown in FIGURE 8 is plotted vs. time. It can be observed that there is no appreciable temporal change in the EPR of the gelatin inclusion while the EPR in the tofu material decreases from 0.5 to its equilibrium value of around 0.2. These results demonstrate that it is feasible to use the proposed dual transducer method to estimate the EPR in poroelastic materials with no need of averaging and with quality comparable to that typical for standard axial strain elastography.
Discussion
Many diseases, such as cancers, have altered fluid transport mechanisms, which can result in changes in their ability to change volume upon compression. Poroelastography techniques aim at assessing these changes by observing the temporal behavior of the axial strain and EPR experienced by the tissue upon compression. However, reliable estimation of EPR is currently very difficult due to the known limitations of lateral strain estimation [23]. These limitations stem from the pitch of the ultrasound transducer itself, which limits the number of samples/ mm in the lateral direction as compared to axial direction. Previous techniques proposed to improve lateral strain elastography include: increasing the number of samples by using weighted interpolation, temporal and spatial averaging, compounding or multiple successive measurements from different angulations. All of these techniques have shown some improvement in the lateral strain estimation but have inherent limitations. In this study, we propose a new method that uses two transducers to image both the axial strain and the lateral strain distributions with high image quality. Since only ultrasonic axial data are used for both strain estimations, this technique allows reliable and fast estimation of the EPR. Our study shows that the EPR poroelastograms obtained using the dual transducer method has consistently significantly higher quality than those obtained using a single transducer. This was demonstrated for a series of simulated non-homogeneous phantoms with a range of permeability contrasts but will hold true also in the limiting case of a homogenous poroelastic sample. The inclusion case is of interest for poroelastography imaging not only because of its relevance for tumor applications but also because it is a scenario that is not particularly suitable to averaging.
The experimental results reported in this paper demonstrate that it is technically feasible to use the proposed dual transducer method to image the EPR distribution in controlled materials. The technique allowed clearly depicting and differentiating the temporal behavior of the EPR in the tofu, which is a compressible material and the gelatin, which is nearly incompressible. These results confirm the ones observed in [21], but with much higher visual contrast to noise ratio and spatial resolution.
The current experimental setup has some limitations. While this set up may be used to test the poroelastic behavior of samples in controlled experiments, it may not be suitable for in-vivo studies in its current form. For example, other angle configurations for the two transducers may need to be explored. Also the image registration techniques used in this work are preliminary to show the feasibility and as such for clinical applications more automated and robust algorithms may be used. For our experiments, two identical ultrasound systems were used for each acquisition. While the Ultrasonix RP system used for this study has the capability of using two transducers as input, alternatively switching acquisition between them is done by a mechanical relay switch and cannot be executed in a short time interval. In this work, the time interval between axial and lateral acquisitions was set to 50 min. Based on our simulation analysis and our previous observations on the poroelastic materials used for this study [21,30], this time interval did not affect the accuracy of our EPR estimation. This is presumably due to the fact that tofu and gelatin exhibited negligible time dependent changes due to fluid flow within 50 min. To make this technique a clinically viable tool where the time dependent behavior may be of short duration, lower time interval or a method to obtain simultaneous axial and lateral data acquisitions, may need to be developed. While the proposed method is still in its inception with respect to implementation, the results reported in this paper show that it has the potential to solve quality limitations of current ultrasound elastography methods. It may also encourage further developments of this technique so that it can become more suitable for clinical applications.
Conclusion
We have explored a new method to reliably and accurately map the EPR of poroelastic materials in controlled experiments. Simulation results show that the proposed method allows generation of EPR poroelastograms with higher contrast-to-noise ratio and lower mean absolute error than poroelastography methods using a single transducer. We have also demonstrated the experimental feasibility of the new technique in controlled homogeneous and non-homogenous phantoms.
References
- Ophir J, Cespedes I, Ponnekanti H, et al. Elastography: A quantitative method for imaging the elasticity of biological tissues. Ultrason Imaging. 13,111-134 (1991).
- Sarvazyan AP, Rudenko OV, Swanson SD, et al. Shear wave elasticity imaging: A new ultrasonic technology of medical diagnostics. Ultrasound Med Biol. 24,1419-1435 (1998).
- Konofagou EE, Harrigan TP, Ophir J, et al. Poroelastography: Imaging the poroelastic properties of tissues. Ultrasound Med Biol. 27,1387-1397 (2001).
- Berry GP, Bamber JC, Armstrong CG, et al. Towards an acoustic model-based poroelastic imaging method: I. Theoretical foundation. Ultrasound Med Biol. 32,547-567 (2006).
- Raffaella R, Brian SG, Louise MM, et al. The feasibility of using poroelastographic techniques for distinguishing between normal and lymphedematous tissues in vivo. Phys Med Biol. 52,6525 (2007a).
- Wang HF. Theory of linear poroelasticity. Princeton series in geophysics, Princeton University Press, Princeton, NJ. (2000).
- Fatt I. Dynamics of water transport in the corneal stroma. Exp Eye Res. 7,402-412 (1968).
- Mow VC, Holmes MH, Michael Lai W. Fluid transport and mechanical properties of articular cartilage: a review. J Biomech. 17,377-394 (1984).
- Jain RK. Barriers to drug delivery in solid tumors. Sci Am. 58-65 (1994).
- Jurvelin J, Buschmann M, Hunziker E. Optical and mechanical determination of Poisson's ratio of adult bovine humeral articular cartilage. J Biomech. 30,235-241 (1997).
- Van Houten EE, Doyley MM, Kennedy FE, et al. Initial in vivo experience with steady-state subzone-based MR elastography of the human breast. J Magn Reson Imaging. 17,72-85 (2003).
- Abbott NJ. Evidence for bulk flow of brain interstitial fluid: significance for physiology and pathology. Neurochem Int. 45,545-552 (2004).
- Jain RK. Transport of molecules in the tumor interstitium: A review. Cancer Res. 47,3039-3051 (1987).
- Boucher Y, Kirkwood JM, Opacic D, et al. Interstitial hypertension in superficial metastatic melanomas in humans. Cancer Res. 51,6691-6694 (1991).
- Roh H, Boucher Y, Kalnicki S, et al. Interstitial hypertension in carcinoma of uterine cervix in patients: possible correlation with tumor oxygenation and radiation response. Cancer Res. 51,6695-6698 (1991).
- Gutmann R, Leunig M, Feyh J, et al. Interstitial hypertension in head and neck tumors in patients: Correlation with tumor size. Cancer Res. 52,1993-1995 (1992).
- Nathanson SD, Nelson L. Interstitial fluid pressure in breast cancer, benign breast conditions and breast parenchyma. Ann Surg Oncol. 1,333-338 (1994).
- Boucher Y, Salehi H, Witwer B, Harsh G. Interstitial fluid pressure in intracranial tumours in patients and in rodents. Br J Cancer. 75,829 (1997).
- Heldin C-H, Rubin K, Pietras K, et al. High interstitial fluid pressure-an obstacle in cancer therapy. Nat Rev Cancer. 4,806-813 (2004).
- Hassid Y, Furman-Haran E, Margalit R, et al. Non-invasive magnetic resonance imaging of transport and interstitial fluid pressure in ectopic human lung tumors. Cancer Res. 66,4159-4166 (2006).
- Righetti R, Ophir J, Srinivasan S, et al. The feasibility of using elastography for imaging the Poisson's ratio in porous media. Ultrasound in Medicine & Biology. 30,215-228 (2004).
- Righetti R, Ophir J, Krouskop TA. A method for generating permeability elastograms and Poisson’s ratio time-constant elastograms. Ultrasound in Medicine & Biology. 31,803-816 (2005).
- Lubinski MA, Emelianov SY, Raghavan K, et al. Lateral displacement estimation using tissue incompressibility. IEEE Trans Ultrason Ferroelectr Freq Control. 43,247-256 (1996).
- Kallel F, Varghese T, Ophir J, et al. The non-stationary strain filter in elastography: Part II. Lateral and elevational decorrelation. Ultrasound in Medicine & Biology. 23,1357-1369 (1997).
- Konofagou E, Ophir J. A new elastographic method for estimation and imaging of lateral displacements, lateral strains, corrected axial strains and Poisson’s ratios in tissues. Ultrasound in Medicine & Biology. 24,1183-1199 (1998).
- Raffaella R, Seshadri S, Arun Thitai K, et al. Assessing image quality in effective Poisson's ratio elastography and poroelastography: I. Phy Med Biol. 52,1303 (2007b).
- Abeysekera JM, Zahiri Azar R, Goksel O, et al. Analysis of 2-D motion tracking in ultrasound with dual transducers. Ultrasonics. 52,156-168 (2012).
- Chaudhry A, Unnikrishnan G, Reddy J. Effect of permeability on the performance of elastographic imaging techniques. Medical Imaging. 32,189-199 (2013).
- Netti PA, Berk DA, Swartz MA, et al. Role of extracellular matrix assembly in interstitial transport in solid tumors. Cancer Res. 60,2497-2503 (2000).
- Nair SP, Xu Y, Krouskop TA, et al. Performance analysis of a new real-time elastographic time constant estimator. Medical Imaging. 30,497-511 (2011).
- Nair S, Varghese J, Chaudhry A, et al. Effect of temporal acquisition parameters on image quality of strain time constant elastography. Ultrason Imaging. (2014).
- Kallel F, Bertrand M. Tissue elasticity reconstruction using linear perturbation method. Medical Imaging. 15,299-313 (1996).
- Kallel F, Prihoda CD, Ophir J. Contrast-transfer efficiency for continuously varying tissue moduli: Simulation and phantom validation. Ultrasound in Medicine & Biology. 27,1115-1125 (2001).
- Chaudhry A. Effect of boundary conditions on performance of poroelastographic imaging techniques in non-homogeneous poroelastic media. Texas A&M University. (2010).
- Ophir J, Cespedes I, Garra B, et al. Elastography: ultrasonic imaging of tissue strain and elastic modulus in vivo. European Journal of Ultrasound. 3,49-70 (1996).
- Lamdan Y, Schwartz JT, Wolfson HJ. Object recognition by affine invariant matching. In: Computer Vision and Pattern Recognition, 1988 Proceedings CVPR'88. Computer Society Conference. IEEE. 335-344 (1988).


