Review Article - Pharmaceutical Bioprocessing (2024) Volume 12, Issue 2
Strategies Used in Manufacturing Processes to Drive and Control Mammalian Cells to Undergo a Lactate Metabolic Shift
- Corresponding Author:
- Naveenganesh Muralidharan
Department of Manufacturing Science and Technology (MSAT),
AGC Biologics,
Boulder,
Colorado,
USA
E-mail: nmural@agcbio.com
Received: 01-Mar-2024, Manuscript No. FMPB-24-129314; Editor assigned: 05-Mar-2024, PreQC No. FMPB-24-129314 (PQ); Reviewed: 19-Mar-2024, QC No. FMPB-24-129314; Revised: 28-Mar-2024, Manuscript No. FMPB-24-129314 (R); Published: 05-Apr-2024, DOI: 10.37532/2048-9145.2024.12(2).152-157
Abstract
Mammalian cells used in the production of biologics frequently switch from glucose to lactate as a source of energy, a process known as a lactate metabolic shift. While this response is desirable because it leads to high yields, it does not occur spontaneously nor is it well understood. Even in highly controlled commercial manufacturing facilities, some batches undergo a lactate metabolic shift while others do not. Here we review our current understanding of the bioreactor operating parameters that may have an impact on the lactate metabolic shift, including pH, pCO2, and glucose and lactate together with conditions used for media preparation, filtration, batching, and equilibration. The information presented might be used to troubleshoot problems leading to inconsistent lactate metabolic shifts and the development of more effective control strategies.
Keywords
Bioprocessing • Upstream cell culture • Mammalian cell • Lactate metabolic shift • Upstream control strategy
Introduction
Mammalian cells used for biologics production initially consume glucose as the primary carbon source and will produce lactate during early exponential phase growth. Once the culture approaches the stationary phase, the cells will begin to consume lactate as their main carbon source. The shift from glucose to lactate as the main energy source is known as the lactate metabolic shift. This shift is desirable during upstream operations in biologics production as it typically results in higher protein yields. A review of basic cellular metabolism is shown in Figure 1. As part of this process, glucose is converted to pyruvate which is then transferred to the mitochondria where it enters the Tricarboxylic Acid (TCA) cycle. In this way, pyruvate is oxidized to H2O and CO2 and energy is produced. However, if the mitochondrial oxidative potential is insufficient, pyruvate will be converted to lactate which will accumulate in the culture broth. High concentrations of lactate will result in a reduction in pH; this will signal the automatic addition of additional base titrant by the bioreactor’s pH control mechanism. The addition of base titrant increases the osmolality of the culture broth; this will ultimately inhibit cell growth, reduce protein productivity, and alter the glycosylation profile of the therapeutic protein produced [1]. Although largely considered a desirable response, the lactate metabolic shift is frequently inconsistent between batches even in controlled commercial-scale operations [2]. The mechanisms underlying the control of this metabolic shift remain poorly understood and have been reported piecemeal with no systemic overview. To address this important concern, we review the current literature focused on the parameters that may affect the lactate metabolic shift in mammalian cell culture manufacturing processes. We provide a consolidated summary of factors believed to control metabolic behavior in cell culture leading to the desired lactate metabolic shift.

Figure 1: Lactate metabolic shift.
Literature Review
Factors influencing the lactate shift
Effect of CO2 concentration: In a typical fedbatch culture, CO2 is produced by cellular respiration as glucose is metabolized. This process plays a major role in energy production needed to support cell growth and productivity. During the early phases of culture growth under standard bioreactor conditions, CO2 sparging is required to maintain the pH. As the cell density increases, the concentration of CO2 also increases. In a typical cell culture, one mole of CO2 is produced for every mole of O2 consumed. Under these conditions, the Respiratory Quotient (RQ)=1 [1]. Therefore, to maintain an optimal CO2 concentration inside the bioreactor, O2 transfer, and CO2 removal must be balanced. Bioreactor operating conditions, including sparger gas flow rate, agitation, and pressure can all have an impact on CO2 accumulation in the culture broth. For example, increasing the flow rate of the sparger gas may result in the removal of too much CO2. A pCO2 concentration below 25 mmHg during the first three days may alter cell culture performance by inhibiting the lactate metabolic shift [3].
By contrast, low rates of gas flow can lead to an increase in the concentration of dissolved CO2. Inappropriately elevated levels of CO2 may delay or even prevent cells from undergoing the desired lactate metabolic shift and lead to lactate accumulation. For example, Brunner, et al. [4] reported that pCO2 concentrations >95 mmHg can prevent the desired lactate metabolic shift. Therefore, ensuring the pCO2 concentration between 25 mmHg and 95 mmHg during the early stages of cell growth in culture may be critical to ensure a consistent lactate metabolic lactate shift across multiple batches.
Effects of glucose and lactate concentration: The density profile of viable cells grown in batch or fed-batch mode can be divided into exponential growth, stationary, and declining phases. The cell growth rate is highest during the first (exponential) phase and plateaus as the cells enter the stationary phase. The cell growth rate then falls as the cells enter the declining phase. Mulukutla, et al. [5] reported that cells can be pushed toward a lactate metabolic shift by limiting the concentration of available glucose during the follow-up to the initial lactate production phase. Under these conditions, cells can consume glucose and produce lactate until the glucose concentration falls below a threshold value (0.5 mM or 0.1 g/L) and lactate has accumulated to 15 to 40 mM (1.4 g/L to 3.4 g/L). The cells are then maintained under glucose limitation for a specific duration. When the glucose limitation period has been completed, cells are then re-fed to achieve an extracellular glucose concentration of no more than 2 g/L. These researchers also noted that a change in the duration of glucose limitation might prevent the cells from achieving the desired lactate metabolic shift [5]. It is critical to note that cells under glucose limitation still need a trace amount to prevent starvation. Acosta et al. [6] reported that CHO cells undergo lactate shift at glucose concentration 1.0 to 1.5 mM, this value is two to three times higher than previously reported value by Mulukutla et al. [5]. Furthermore, Acosta also demonstrated monitoring molar ratio of lactate to glucose against glucose concentration over the period of glucose limitation as an effective explanatory tool to monitor metabolic shift. Therefore, it is recommended that maintaining consistent molar ratio of lactate to glucose over duration of glucose limitation is more critical than the absolute concentrations.
Liste-Calleja, et al. [7] reported that HEK293 cells responded to a reduction in pH by undergoing a lactate metabolic shift. This group also noted that a reduction in pH accompanied by lactate supplementation resulted in the coconsumption of both glucose and lactate.
In summary, it will be important to consider the interactive effects and the overall impact of pH, pCO2, glucose and lactate concentrations, and the duration of glucose limitation. These parameters might be maintained as uniformly as possible across all batches to achieve a consistent lactate metabolic shift across multiple batches.
Effect of seeding density and glucose concentration per cell: Viable cell seeding density and the cell growth profile frequently vary between batches in commercial cell culture operations. This variability may be introduced either from raw material, inherent error from cell counting machines, and/or from the manufacturing operation itself. Thus, if the system is designed as a constant continuous or bolus glucose feeding strategy independent of bioreactor cell count, different batches will have different glucose concentrations per cell. Drapeau D, et al. [8] reported that lactate production by mammalian cells is controlled by feeding glucose at the rate of glucose consumed by cells rather than constant fed-batch or continuous rate of glucose addition-based on bioreactor sample glucose concentration. Here the rate of glucose consumed is a function of viable cell density profile. Therefore, it is recommended to monitor and control glucose concentration per cell to achieve consistency in lactate metabolic shift between batches.
Effect of bioreactor mixing time and the pH gradient: The bioreactor’s automated pH control signals the addition of a base titrant whenever the pH hits a lower deadband. In large-scale bioreactors, the base titrant is frequently added to the surface of the culture liquid. Mixing time will increase as the scale of operation increases. Longer bioreactor mixing times can create pH gradients of ≥ 9.0 units over 5% of the volume of largescale bioreactors. This localized region of the high pH zone is often called the alkaline zone. Brunner, et al. [9] identified a 5% alkaline zone in a stirred tank bioreactor with operating volume of 10,000 to 12,000 L. Langheinrich and Nienow [10] demonstrated that intracellular pH (pHi) increases by ~2 units as the cells enter the alkaline zone even with a very short exposure time. Xu, et al. [11] showed that the addition of base titrant in response to an increase in pCO2 in largescale bioreactors with long mixing times causes stress to fed-batch CHO cultures and prevents them from undergoing a lactate metabolic shift. Therefore, when scaling up a bioreactor manufacturing process, it is imperative to consider the bioreactor mixing time and/or ensure that the base titrant is introduced at a point close to the impeller zone (Figure 2).

Figure 2: pH gradient inside large manufacturing scale bioreactor.
Effect of bioreactor mixing time and the dissolved O2 gradient: O2 characteristic time (tc) is defined as the ratio of O2 concentration (C*) in the incoming gas (in mM) to the rate of O2 consumption by the cells (in mM/sec). In other words, O2 tc is a measure of how fast the delivered O2 is consumed as expressed in equation (1) [12]. C* is the molar concentration of O2 in a purged gas bubble as calculated in equation (2). H is Henry’s coefficient for O2 solubility in liquid. For typical culture conditions at 37°C, H=1.07 mmol/(L.atm) is a good approximation, with P representing the average pressure in the bioreactor in atm. A positive pressure above atmospheric pressure (1 atm) is maintained in the bioreactor; thus, the pressure in the headspace added to the pressure from liquid height inside the bioreactor will be >1 atm.
However, for simplicity in our calculation, P is assumed to be 1 atm. Foxy is the fraction of O2 in the incoming gas (Figure 3). The fraction of O2 in air is 0.21. The rate of O2 consumed is expressed as the O2 Uptake Rate (OUR). As shown in equation (3), the OUR is calculated as the product of the viable cell density and their rate of O2 consumption [1]. Here, we approximate the specific O2 consumption rate of cells (Qo2) at 5.5 pmol/cell.day [13]. Xi is the Viable Cell Density (VCD; × 106 cells/mL). Thus: When scaling up a bioreactor manufacturing process, it is critical to ensure the bioreactor mixing time is shorter than O2 characteristic (tc) for the peak cell density of the process as identified in Figure 3 to avoid existence of O2 gradients (inhomogeneity) in bioreactor.
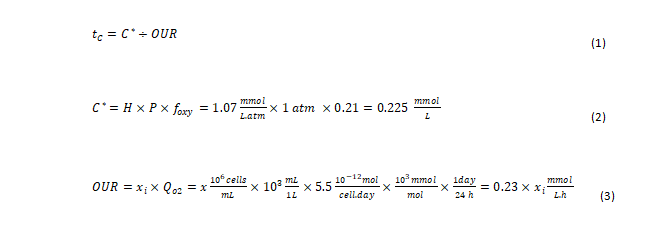

Figure 3: O2 characteristic time (tc) vs. Viable Cell Density (VCD).
Discussion
Effect of media preparation, filtration, and equilibration
Media preparation: Typically, one needs to accommodate uncertainties (e.g., equipment downtime and availability) in large-scale commercial production suites. The flexibility in media composition is incorporated in process design, for example, taking into consideration whether cell culture media is filtered directly into the receiving bioreactor or into to storage tank and then transferred into the receiving bioreactor at a later time. Forte T, et al. [14] reported that the stability of a liquid cell culture medium depends on various factors that affect storage conditions, such as temperature, exposure to light and time. Forte T also showed improper storage conditions have led to degradation of organic components, precipitate of amino acids in formulated medium leading to poor cell culture performance. Furthermore, Neutsch L, et al. [15] showed exposing cell culture media and feeds to ambient light source only for short period resulted in photo-degradation of vital nutrients in media impacting cell culture performance. Typical biomanufacturing platforms do include intermediate storage of feeds and media in transparent plastic bottles or transparent bags, which do not guarantee exclusion of light over prolonged duration without light protection. Hence, the option of using transparent storage containers without proper shielding from exposure to light does have potential to impact media stability and thereby cell culture performance and metabolic shift. Therefore, one’s specific procedural choice on filtration of media directly in bioreactor or filtration into storage tank or transparent containers and then transfer into bioreactor can lead to differences in cell culture performance between the batches. Thus, to maintain consistency between batches, it is recommended to carefully characterize all possible media storage conditions.
Media filtration: During the scale-up operation, an oversized filter is typically selected to avoid the possibility of clogging or as an extra safety factor to facilitate microbial control. The risks associated with the use of oversized filter membranes generally go unnoticed. Growth media contain a metabolically balanced composition of basal nutrients, such as amino acids, carbohydrates, inorganic salts, and vitamins in water, which are necessary for cell growth and proliferation [2]. Loss of nutrients from cell culture media is expected to have adverse impact on cell culture performance. Na J, et al. [16] reported that loss of organic components from cell culture media during filtration using 0.2 μm sterile hydrophilic membrane filters. Therefore, as a simplified best practice it is recommended to maintain the filtration volume to effective filter area ratio as close as possible to the receiving site, which is commonly employed in the biopharmaceutical industry for sizing normal flow filtration [17].
Media equilibration and dissolved O2 standardization process: Cell culture media pH is typically maintained using a CO2-bicarbonatebased buffer system. Hoshan, et al. [18], reported that air sparge removes dissolved CO2 from cell culture media and spontaneously increases the medium pH. Therefore, problems can emerge secondary to excess gassing using only processed air over a short duration during Dissolved O2 (DO) probe standardization or even from mild airflow over a long duration when the media has been added to the bioreactor substantially before the time of inoculation. Both processes can remove CO2 from the culture media and increase the pH; Brantley et al. [19] reported that increase in pH resulted in the precipitation of critical components (trace elements) from the cell culture media and thus impart differences in cell culture performance. Therefore, for consistent cell culture performance, it is recommended to use 5%-7% of CO2 along with air based on bicarbonate concentration in the growth media to avoid excessive removal of CO2 from cell culture media and the resulting increase in pH [2].
Conclusion
The rates of natural reactions depend on duration, the availability of substrates, and environmental conditions. With these three base factors as inception of an idea to explore, we reviewed the different manufacturing and operating parameters that can influence the lactate metabolic shift in mammalian cell culture. Future work will need to focus on a multivariable analysis of these parameters to understand their potential additive and synergistic impact on cell culture performance.
Acknowledgment
None.
Conflict of Interest
None.
Disclaimer
The views and opinions expressed in this document are those of the authors only and do not necessarily reflect the official policy or position of AGC Biologics.
References
- Muralidharan N, Johnson T, Bolduc E et al. CO2 control strategy for large-scale cell culture bioreactor operation. Adv BioSci Bioeng. 12, 1-13 (2024).
- Hu, WS. Cell culture data analysis. In Cell Culture Bioprocess Engineering. 2nd ed., CRC Press, 172-174 (2020).
- Zhao L, Wang C, Wang J et al. Low CO2 partial pressure steers CHO cells into a defective metabolic state. Biotechnol Lett. 45, 1103-1115 (2023).
[Crossref] [Google Scholar] [PubMed]
- Brunner M, Doppler P, Klein T et al. Elevated pCO2 affects the lactate metabolic shift in CHO cell culture processes. Eng Life Sci. 18, 204-214 (2017).
[Crossref] [Google Scholar] [PubMed]
- Mulukutla BC, Yongky A, Grimm S et al. Multiplicity of steady states in glycolysis and shift of metabolic state in cultured mammalian cells. PLoS One. 10, 1-20 (2015).
[Crossref] [Google Scholar] [PubMed]
- Acosta ML, Sanchez A, Garcia F et al. Analysis of kinetic, stoichiometry and regulation of glucose and glutamine metabolism in hybridoma batch cultures using logistic equations. Cytotechnology. 54, 189-200 (2007).
[Crossref] [Google Scholar] [PubMed]
- Liste-Calleja L, Lecina M, Lopez-Repullo J et al. Lactate and glucose concomitant consumption as a self-regulated pH detoxification mechanism in HEK293 cell cultures. Appl Microbiol Biotechnol. 99, 9951-9960 (2015).
[Crossref] [Google Scholar] [PubMed]
- Drapeau D, Stanek T, Luan Y-T. Restricted glucose feed for animal cell culture. US patent. US7429491B2. September 30, (2008)
- Brunner M, Braun P, Doppler P et al. The impact of pH inhomogeneities on CHO cell physiology and fed-batch process performance-two-compartment scale-down modelling and intracellular pH excursion. Biotechnol J. 12 (2017).
[Crossref] [Google Scholar] [PubMed]
- Langheinrich C, Nienow AW. Control of pH in large-scale, free suspension animal cell bioreactors: Alkali addition and pH excursions. Biotechnol Bioeng. 66, 171-179 (1999).
[Crossref] [Google Scholar] [PubMed]
- Xu S, Jiang R, Mueller R et al. Probing lactate metabolism variations in large-scale bioreactors. Biotechnol Prog. 34, 756-766 (2018).
[Crossref] [Google Scholar] [PubMed]
- Lara AR, Galindo E, Ramirez OT et al. Living with heterogeneities in bioreactors: Understanding the effects of environmental gradients on cells. Mol Biotechnol. 34, 355-381 (2006).
[Crossref] [Google Scholar] [PubMed]
- Muralidharan, N, Bolduc E, Davis M. Characterizing oxygen mass transfer and shear during cell culture calculating the maximum cell density supported by a 20,000-liter stirred-tank bioreactor. Bioprocess Int. 22, 2-10 (2024).
- Forte T, Grinnell C, Zhang A et al. Methods for identifying precipitates and improving stability of chemically defined highly concentrated cell culture media. Biotechnol Prog. 39, e3345 (2023).
[Crossref] [Google Scholar] [PubMed]
- Neutsch L, Kroll P, Brunner M et al. Media photo-degradation in pharmaceutical biotechnology-impact of ambient light on media quality, cell physiology, and IgG production in CHO cultures. J Chem Technol Biotechnol. 93, 2141-2151 (2018).
[Crossref] [Google Scholar] [PubMed]
- Na J, Suh D, Cho YH et al. Comparative evaluation of the performance of sterile filters for bioburden protection and final fill in biopharmaceutical processes. Membranes (Basel). 12, 524 (2022).
[Crossref] [Google Scholar] [PubMed]
- Haindl S, Stark J, Dippel J et al. Scale-up of microfiltration processes. Chemie Ingenieur Technik. 92, 746-758 (2020).
- Hoshan L, Jiang R, Moroney J et al. Effective bioreactor pH control using only sparging gases. Biotechnol Prog. 35, e2743 (2019).
[Crossref] [Google Scholar] [PubMed]
- Brantley T, Moore B, Grinnell C et al. Investigating trace metal precipitation in highly concentrated cell culture media with Pourbaix diagrams. Biotechnol Bioeng. 118, 3888-3897 (2021).
[Crossref] [Google Scholar] [PubMed]