Review Article - Imaging in Medicine (2012) Volume 4, Issue 3
Sonography of carpal tunnel syndrome: why, when and how
Siegfried Peer1*, Hannes Gruber2 and Alexander Loizides2
1CTI GesmbH & Roentgeninstitut B7, Innsbruck, Austria
2 Innsbruck Medical University, Department of Radiology, Innsbruck, Austria
- *Corresponding Author:
- Siegfried Peer
CTI GesmbH & Roentgeninstitut B7 Innsbruck
Austria
Tel: +4351258677653
E-mail: info@siegfried-peer.at
Abstract
Due to technical progress in hardware and software, high-resolution ultrasonography has become one of the most important techniques for imaging of peripheral nerves. Consequently it has become an important adjunct to the work-up of patients with carpal tunnel syndrome. With sufficient knowledge of the normal sonographic appearance of the median nerve/carpal tunnel and the direct pathophysiological expression of compression neuropathy on the sonographic presentation of the median nerve, sonography is complementary to electrophysiological testing in the diagnosis of carpal tunnel syndrome.
Keywords
carpal tunnel syndrome; compression; europathy; median; erve ; neural conduction studies; sonography; ultrasound imaging
With an incidence of one to three subjects per one thousand, carpal tunnel syndrome (CTS) is the most frequent of compression neuropathies [1]. It typically develops in individuals of 45–60 years of age and is more frequent in women compared with men. Clinical presentation and patient history are quite characteristic: typically patients report that their hands fall asleep or that things slip from their fingers without them noticing. Numbness and tingling sensations in the first to third finger and the radial half of the fourth finger are characteristic findings. Symptoms may be intermittent, occur with certain activities or awaken the patient from sleep. The latter is a quite frequent finding and the disturbing sensations of CTS often show an early morning maximum. Often symptoms may be relieved by vigorously shaking the hand or wrist. Pain in CTS is typically of an aching nature and extends into the radial forearm. Weakness and loss of grip may occur, but often motor impairment is primarily caused by loss of sensory feedback.
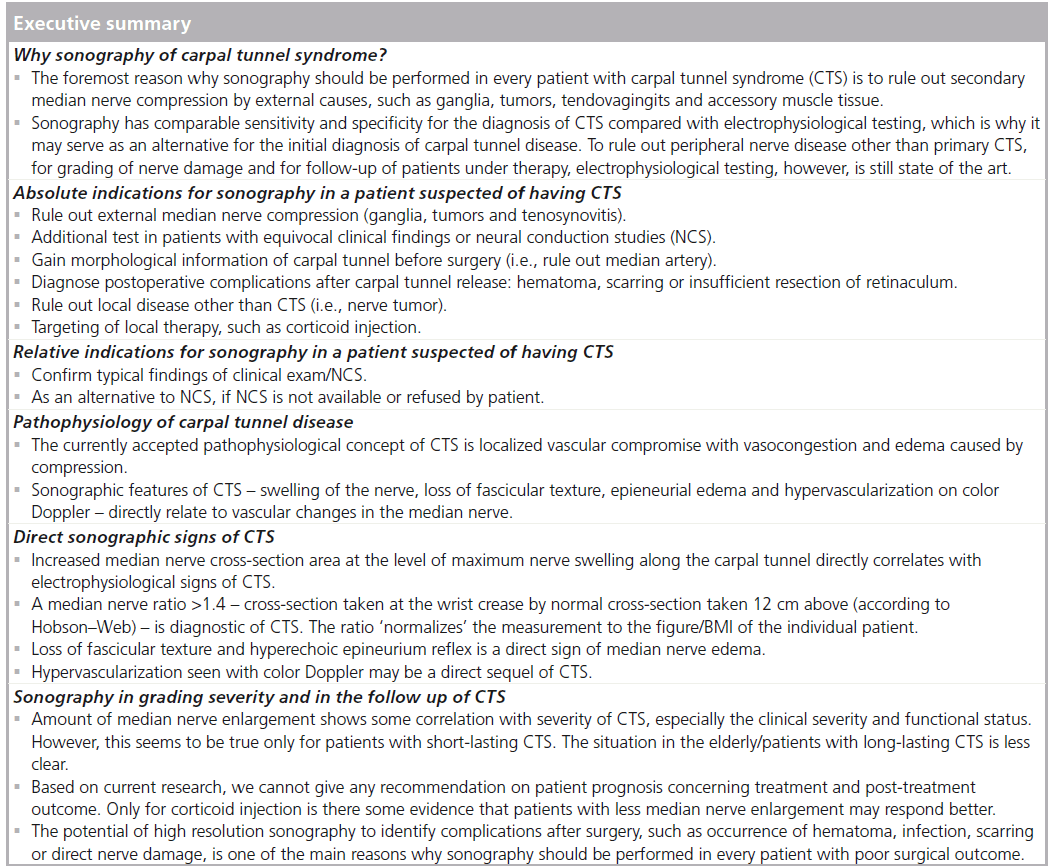
With careful history taking and some simple clinical function tests – such as Phalen’s maneuver (there is a variety of other provocative maneuvers, but they proved less reliable) – a neurologist or family physician may arrive at a definite diagnosis of CTS in more than 80% of cases [1]. In this regard the use of additional CTS-scores has to be mentioned: the concept of clinical questionnaires for CTS-diagnosis is not essentially new. In 1993 Levine and colleagues introduced the ‘CTS severity instrument’ to grade subjective severity and functional impairment [2]. Later this concept underwent various amendments and changes, but even with the use of sophisticated methods, such as regression analysis or artificial neural networking, scoring systems achieve sensitivity of no more than 88% and specificity of 50% in predicting abnormal median nerve conduction [3]. So while a patients’ history and symptoms may be quite characteristic, there is no definitve method to diagnose a patient of having ‘true’ CTS based on clinical examination. There is ample evidence in the literature of failed CTS treatment, showing that the initial diagnosis of CTS was incorrect: only later it became obvious that the patients had polyneuropathy, ulnar nerve lesions, cervical radiculopathy, rheumatological disorders, multiple sclerosis, syringomyelia or motor neuron disease [4]. Because of this substantial overlap, even the typical patient does, on the one hand, need further work-up to rule out diseases other than primary CTS. On the other hand, any additional modality used in the workup of CTS must yield a higher diagnostic sensitivity and specificity than clinical neurological examination (i.e., closer to 100%). This leads us to the first important question: why sonography of CTS?
Why sonography of CTS?
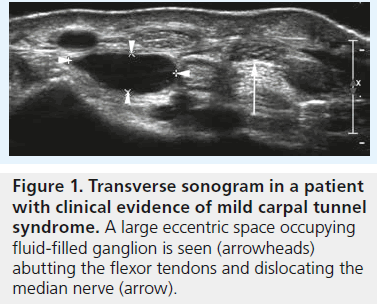
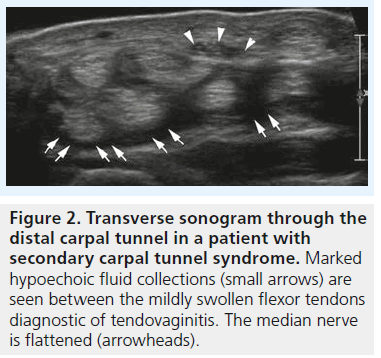
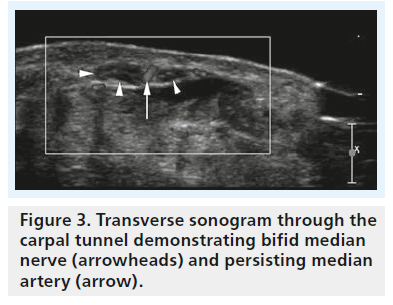
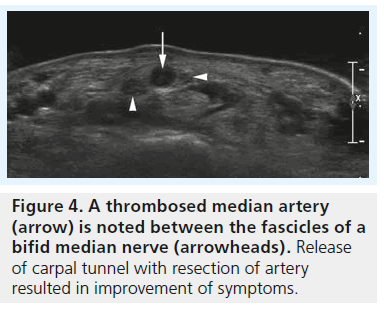
Since its first description, CTS was long considered to be a relatively straightforward diagnosis. Ongoing research in recent years has provided us with new insights into the disease and today it is clear that CTS is anything but simple; it is a complex and diverse condition. In principle we have to differentiate so-called idiopathic CTS from a variety of local conditions with secondary, external compression of the median nerve: swelling of flexor tendons in tenosynovitis, ganglia or other tumors, accessory muscle tissue and even vascular anomalies (a persistent median artery, aneurysms or vascular malformations) may result in reduced space inside the carpal tunnel and lead to symptoms quite similar to those of idiopathic CTS (Figure 1–4). Needless to say, these conditions are rarely diagnosed based on clinical or neurological examination, or with electrophysiological testing. This does not mean that there is no value in clinical functional testing or neurophysiology regarding the work-up of a patient suspected of having CTS, but still both methods and any combination of the two do not represent an accepted gold standard for CTS diagnosis. Nerve-conduction studies are helpful for definition of the site and extent of damage (i.e., conduction slowing) along the course of a nerve: this is especially important in the discrimination of a localized problem such as CTS and generalized peripheral neuropathies, or nerve entrapment at another site (i.e., at the elbow). Neural conduction studies also provide a means to measure the severity of nerve damage, which is especially valuable for follow-up examinations during treatment. However, neurophysiological testing – like any other medical test – is less than 100% accurate.
High-resolution ultrasonography has proven its ability for imaging of very small musculoskeletal structures and especially for imaging the peripheral nerve. It is readily available, cost effective and less invasive compared with electrophysiological testing and other imaging techniques, such as MRI. We will discuss the typical sonographic features of idiopathic CTS later in this article, but the potential of sonography to definitely rule out external compression of the median nerve (i.e., secondary CTS) is one of the main reasons why we should perform sonography in every patient suspected of having CTS – especially in the case of atypical or inconclusive symptoms. For the clinical radiologist and the sonographer alike the sonographic diagnosis of lesions like ganglia or tenosynovitis is straightforward and typical examples of such lesions resulting in secondary CTS are provided in Figures 1 & 2. The typical sonographic features of CTS – changes in the appearance of the median nerve and the carpal tunnel as a whole – however, are still less well known. To understand these direct signs of CTS we have to remind ourselves of normal median nerve ultrastructure and the pathophysiology of carpal tunnel disease.
Median nerve ultrastructure & sonographic correlation
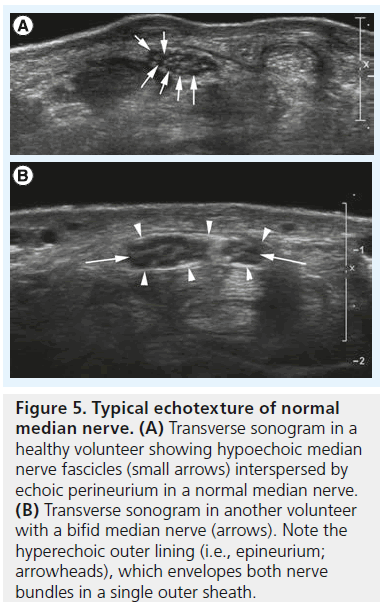
Like any peripheral nerve, the median nerve consists of multiple axons, which are grouped into so-called fascicles surrounded by a dense perineurial sheath [5]. Multiple fascicles interspersed by loose connective and adipose tissue combine into an individual peripheral nerve surrounded by an outermost sheath of epineurium. The number of fascicles in an individual nerve varies and ranges from one to 100. With current clinical sonographic equipment we cannot see individual axons; the smallest structure resolved is the fascicle (Figure 5A). Since the work of Silvestri et al. we know that the sonographic presentation of a peripheral nerve correlates nicely with nerve ultrastructure [6]. As nerve fascicles are continuous, the sonographic appearance of a nerve is quite distinct: on longitudinal scans hypoechoic tubular elements represent single fascicles. Tiny hyperechoic layers divide one fascicle from the other and a somewhat thicker hyperechoic surface (i.e., the outer epineurium separates the nerve as a whole from its surroundings; Figure 5B). On cross-section the nerve consequently exhibits a honeycomb appearance with tiny hypoechoic dots (the fascicles) interspersed and surrounded by a meshwork of hyperechoic connective tissue (the peri- and epi-neurium;Figure 5A & B).
Figure 5.Typical echotexture of normal median nerve. (A) Transverse sonogram in a healthy volunteer showing hypoechoic median nerve fascicles (small arrows) interspersed by echoic perineurium in a normal median nerve. (B) Transverse sonogram in another volunteer with a bifid median nerve (arrows). Note the hyperechoic outer lining (i.e., epineurium; arrowheads), which envelopes both nerve bundles in a single outer sheath.
Pathophysiology of carpal tunnel disease
Peripheral nerves are vascularized structures with a surface epineurial and internal intra- and inter-fascicular vascular plexus [7]. These vascular plexuses are interconnected by oblique and transverse connections along the course of the nerve [8]. According to the current state of nerve research the leading hypothesis considers these vascular structures the responsible mechanism for CTS [9]. Vascular changes in CTS occur in three stages: stage I venous congestion, stage II nerve edema resulting from an anoxic damage to the capillary endothelium and stage III impairment of both venous and arterial blood supply. Compression of a nerve, such as the median nerve, results in a localized circulatory disturbance with collapse of the blood–nerve barrier [10]. A resulting increase of the endoneurial fluid pressure causes a swelling of the nerve and at the same time further impairs local blood flow. Current research shows that this also affects the axonal excitability of the nerve [11].
Direct sonographic signs of CTS
According to the aforementioned pathophysiologic concept of CTS, median nerve compression causes changes of nerve caliber: at the site of maximum nerve compression the nerve gets flattened and above this region it is swollen because of vasocongestion with increase in endoneurial fluid and localized edema. This change in nerve size has long been used as a single measure for the sonographic definition of CTS [12–15]. Buchberger et al. [16] were the first to describe the use of four distinct measurements for the diagnosis of CTS:
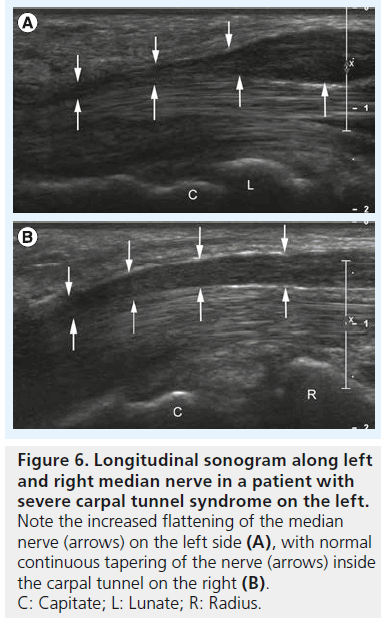
▪ Increased flattening ratio of the median nerve measured at the level of the hook of the hamate (Figure 6A & B);
Figure 6.Longitudinal sonogram along left and right median nerve in a patient with severe carpal tunnel syndrome on the left. Note the increased flattening of the median nerve (arrows) on the left side (A), with normal continuous tapering of the nerve (arrows) inside the carpal tunnel on the right (B). C: Capitate; L: Lunate; R: Radius.
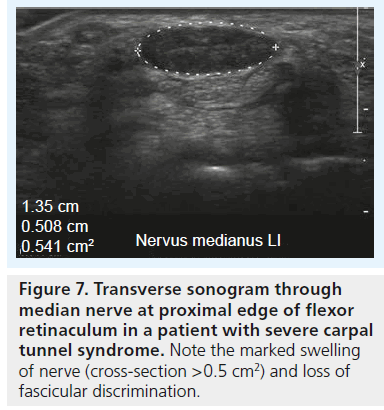
▪ Increased cross-section area at the level of the pisiform bone (Figure 7) and to a lesser extent at the level of the hook of the hamate;
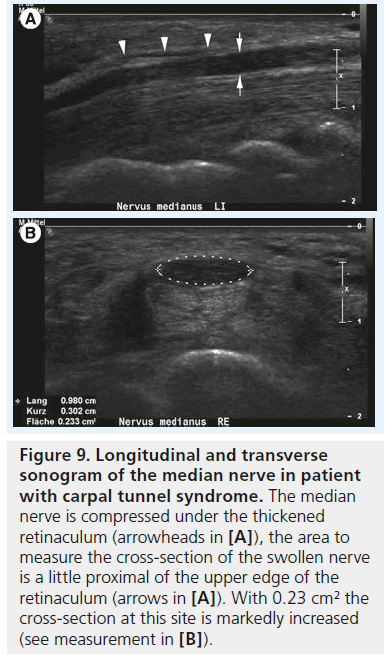
Figure 9.Longitudinal and transverse sonogram of the median nerve in patient with carpal tunnel syndrome. The median nerve is compressed under the thickened retinaculum (arrowheads in [A]), the area to measure the cross-section of the swollen nerve is a little proximal of the upper edge of the retinaculum (arrows in [A]). With 0.23 cm² the cross-section at this site is markedly increased (see measurement in [B]).
▪ Significantly increased cross-section area at the level of the pisiform bone compared with the cross-section area at the level of the distal radius;
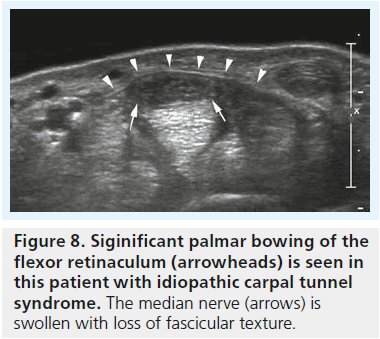
▪ Signif icant bowing of the retinaculum (Figure 8) [16].
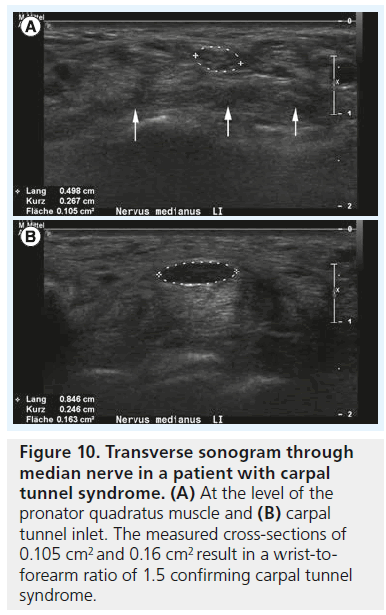
The cross-sectional area of the median nerve is easily measured with state-of-the-art ultrasound equipment by use of a continuous boundary trace or ellipsoid calculation and its value for the diagnosis of CTS has been subject of thorough clinical investigation. Duncan et al. reported good reproducibility of the measurement [13], which was later confirmed by Nakamichi et al. who found good intraobserver agreement [17]; interobserver agreement, however, was not tested in this study. There is some debate regarding where to measure the median nerve, with some investigators advocating measurement of the nerve at the level of the pisiform bone [13], some under the proximal edge of the retinaculum (i.e., the carpal tunnel inlet) [18,19], while others suggest at the level of the maximum cross-section area along the carpal tunnel [20]. Depending on the aforementioned pathophysiological concept the last technique makes sense: the maximum vascular changes occur at the level of nerve compression, with perfusion impairment tapering some centimeters above and below the level of compression. Therefore, we recommend taking cross-section measurements at the level of maximum median nerve swelling independent of its location along the carpal tunnel (Figure 9A & B). In a prospective age-matched case–control study Wong et al. defined a single cross-sectional measurement at the carpal tunnel inlet the most useful criterion to diagnose CTS with a diagnostic value approaching that of electrophysiological testing [19]. The problem with such a single measurement, however, is the disregard of interindividual differences of nerve size among normal subjects, which is why there is still no general agreement on cutoff value to differentiate normal subjects from patients, or mild CTS from severe CTS. Normal values for median nerve cross-sectional area have been reported from 7 to 9.4 mm2 [21–23], and the values for diagnosing CTS from 9 to 15 mm2 [24]. These quite profound differences in the literature are due to differences in measurement technique and study populations. To cope with this problem, the idea of introducing a ratio between the median nerve cross-section area in a definitely normal location and the maximum cross-section area along the carpal tunnel was raised by some authors. Hobson–Webb finally suggested using a wrist-to-forearm median nerve ratio [25]. In their original study, the median nerve was imaged in a transverse plane at the level of the distal wrist crease and 12 cm proximally in the forearm. Those two measurements were used to calculate a median nerve wrist to forearm ratio, with a ratio of greater than 1.4 resulting in a sensitivity for CTS diagnosis of close to 100% (Figure 10A & B). Klauser et al. slightly altered this approach, by suggesting to measure the normal median nerve at the level of the pronator quadratus muscle and then calculate the difference between the enlarged and normal nerve crosssection [20]. They showed that this gave a better standardization of the median nerve reference value and that a threshold for the difference of more than 2 mm2 achieved a combined sensitivity and specificity of 99 and 100%, respectively. In clinical practice, one of either approaches – or a combination of the two – is meanwhile used all around the world, but there is still an unresolved question, which has been addressed earlier by Altinok et al.: even with the most sophisticated measurement technique – a combination of the median nerve cross-section area at the level of the pisiform bone, a measurement of palmar displacement of the flexor retinaculum and a median nerve swelling ratio – they achieved an overall discriminatory accuracy of only 83.8% [26]. While the authors of this study conclude that additional diagnostic confirmation can be provided by ultrasonography, and ultrasonography may be preferred as the initial step instead of electrophysiological studies, they admit that there is still an overlap in median nerve size, thickness or cross-section between healthy individuals and patients, especially patients with mild CTS.
Figure 10.Transverse sonogram through median nerve in a patient with carpal tunnel syndrome. (A) At the level of the pronator quadratus muscle and (B) carpal tunnel inlet. The measured cross-sections of 0.105 cm2 and 0.16 cm2 result in a wrist-toforearm ratio of 1.5 confirming carpal tunnel syndrome.
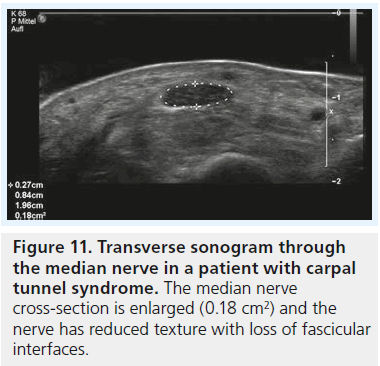
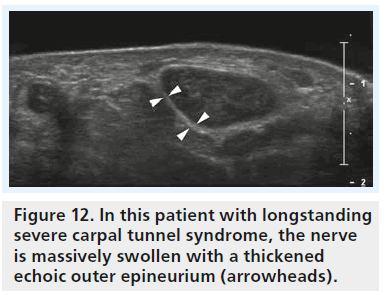
All the aforementioned studies rely solely on measurements to diagnose CTS with ultrasound but ignore the direct effect of the pathophysiological changes on median nerve texture. This is interesting as hypoechogenicity of the median nerve as a direct result of local edema has been demonstrated even in the very first reports on sonography of CTS (Figure 11) [9,11,19]. While at first sight the analysis of nerve texture by an observer seems a highly subjective task, Lee et al. could show two things [27]: evaluation of nerve echogenicity by an objective grayscale is feasible and a subjective grading index shows a close correlation with grayscale representation. To our knowledge there is no report in the literature with investigation of median nerve echotexture in normal individuals and CTS patients. One report with integration of texture analysis into ultrasound diagnosis of compression neuropathy is by Gruber et al. for the diagnosis of ulnar neuropathy at the elbow [28]. Similar to what we know about CTS, there was a marked overlap between cross-section areas and cross-section ratios (humeral to cubital cross-section of the ulnar nerve) in this study. Only the combination of a cross-section ratio greater than 1.4 and partial fascicular masking of the ulnar nerve (caused by edema) resulted in high specificity for the diagnosis of ulnar neuropathy and sufficient discrimination of normals and patients. Quite the same may be true for CTS, but there is no research that confirms this. From our personal experience with sonography of different types of peripheral nerve disease, there may even be more to texture analysis than that. The typical patient with acute/subacute compression neuropathy shows a hypoechoic nerve with loss of fascicular texture and loss of the hyperechoic reflex of the outer epineurium, both findings due to edema. By contrast, we often see patients with longstanding compression and in these patients the nerve, while it may be similarly enlarged, is less hypoechoic and the outer epineurium, in contrast to the acute forms, is thickened and hyperechoic (Figure 12). We think that this is caused by chronic compression/friction of the nerve and the sonographic representation of fibrosis. However, this is only our personal impression and not backed by data from case–control studies. Quite interestingly the latter patients are often poor surgical candidates.
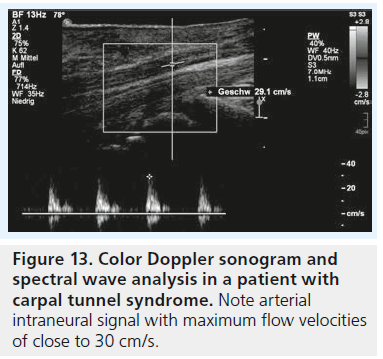
If we consider the pathophysiological concept of nerve compression with local vascular disturbance to be the single most important aspect of the disease process, the aforementioned sonographic findings of changes in nerve size and texture are only indirect signs of altered nerve perfusion; but what about direct imaging of nerve vascularization/perfusion with sonography? It is postulated that repeated injury, ischemia and inf lammation of the median nerve in CTS result in secondary autoregulation and vascular disturbance in small arterioles within the median nerve, thus the intraneural microvasculature of the median nerve gets prominent and dilated [29]. This might in principal be useful for the diagnosis of CTS and there are at least two reports in the literature where this was attempted. Mallouhi et al. used color Doppler ultrasound to evaluate the intraneural vasculature (Figure 13) and used statistical regression analysis to define sensitivity and specificity of various clinical and ultrasound findings (nerve cross-section and presence of color signals on Doppler sonography) for the diagnosis of CTS. They found that nerve vascularity had a sensitivity of 95% and a specificity of 71% in the diagnosis of CTS [30]. In this retrospective study, however, all study subjects were positive for CTS (a combination of clinical exam and neurophysiological testing was used as a ‘gold standard’) and a comparison of the vasculature in patients with healthy individuals was not attempted. Therefore these results have to be taken with caution. In a recent publication color Doppler and power Doppler ultrasound have been used to diagnose and assess the severity of CTS [31]. By quantitative evaluation of the number of vascular signals inside the median nerve, healthy volunteers and CTS patients were discriminated with a sensitivity of 83% and specificity of 89%.
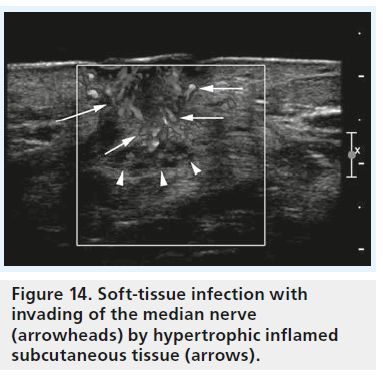
Figure 14.Soft-tissue infection with invading of the median nerve (arrowheads) by hypertrophic inflamed subcutaneous tissue (arrows).
Positive results of color Doppler examination were even seen in patients with clinical evidence of CTS but negative findings at electrodiagnosis, which was equally confirmed in a study by Joy et al. [32]. Ghasemi-Esfe et al. [31], as well as Joy et al., conclude that color Doppler analysis is a helpful tool for the diagnosis of CTS, allows to define the severity of CTS and proves especially helpful in the diagnosis of mild forms. This sounds especially promising, as earlier research relying on B-mode ultrasound analysis of the median nerve alone showed unequivocal results for the prediction of severity or functional status in idiopathic CTS with sonography [33].
The sonographic features mentioned up to now – measurement of cross-section areas, cross-section ratios and texture analysis – are generally accepted and quite well studied and therefore firmly placed in ultrasound practice. Color Doppler analysis shows interesting prospects for future investigation. However, considering the existing evidence in the literature and our personal experience, we may say that there is no general agreement on the position of sonography in the diagnosis of CTS: should it be performed first line or second line? Is it complimentary to neurophysiology? A substitute? This uncertainty still exists and mainly derives from contradictory results concerning the sensitivity/ specificity of sonography reported in different articles. According to our experience the latter is caused by overt differences in the sonographic methods applied and the strong reliance on single features/measurements for CTS diagnosis. In a way this personal belief is confirmed by work of Rahmani et al., who performed logistic regression analysis to search for diagnostic ultrasound features in patients who were clinically suspected of having CTS but negative on neural conduction studies [34]. They found a combination of cross-section measurement, texture analysis (presence of hypoechogenicity) and hypervascularity to be most efficient, with a probability of CTS of 90%. Another potential application of color Doppler is the study of vasomotor disturbances in CTS. Vasomotor fibers are superficially located in the median nerve trunk and damaged early in the course of CTS. Symptoms attributed at least partly to damage of these neural elements are color changes in the skin, coldness and hyperesthesia. Also the common finding of pain relief by rapid shaking of the wrist may essentially be attributed to vasomotor effects. Özcan et al. have shown significant differences in the radial artery blood flow of CTS patients and normal subjects during rest and different hand movements [35]. Increased blood flow was obvious with CTS patients in neutral position and decreased blood flow in a Phalen’s maneuver. They believe that sympathetically mediated vasoconstriction of the vascular bed in the hands of CTS patients might have indirectly caused decreased blood flow in the radial artery. Similar findings were recently reported by Ghasemi-Esfe et al. for measurements of the pulsatility index in the radialis indicis artery [36]. Compared with normal individuals, pulsatility index in CTS patients was low at rest and the response to sympathetic activation (taking a deep breath and coughing) less pronounced.
There are additional features of CTS, such as palmar bowing of the retinaculum, an indentation of the median nerve at the proximal edge of the retinaculum and the flattening ratio among others, which may be noted with sonography, but according to our opinion their value for the diagnosis of CTS has not been sufficiently studied. Therefore, we register these findings, but their diagnostic value in daily clinical practice is rather limited.
Sonography in grading severity & in the follow-up of CTS
Some reports in the literature have shown that sonography directly correlates with electrophysiological measurements and even allows us to estimate the severity of CTS [27,37–39]. El Miedany recommended cross-section area cutoff points that discriminate between different grades of CTS severity as 10–13 mm2 for mild symptoms, 13–15 mm2 for moderate symptoms and >15 mm2 for severe patients [37]. This idea was later tested by Karadag et al. who found high concordance of sonography with electrophysiological results in defining CTS severity [38]. They showed that sonography mainly correlated with scores of the Boston CTS symptom severity scale and a functional status scale; in other words, the increase in nerve cross-section reflects the degree of nerve damage as expressed by the clinical picture. Even rather sophisticated methods, such as the motor unit number estimation method, showed close and significant correlations between the ultrasonographic findings and motor unit number estimation as well as electrophysiological stage of CTS [30]. The motor unit number estimation method revealed a reduction in axon count in CTS patients reflecting the process of demyelination in early stages, accompanied by axonal loss in advanced stages. In a recent article Miwa et al. demonstrated a good correlation of enlarged median nerve cross-section with distal latencies of motor or sensory nerve conduction velocities in patients with CTS [40]. However, they found less pronounced thickening of median nerves in elderly patients with long-lasting disease. In these patients, the incidence of absent nerve conduction is high and may also be consistent with a loss of axons in the median nerve in elderly patients. However, given that the loss of axons occurs as a result of long-term compression, the cross-section would consequently be decreased. We already mentioned our experience of less thickened, less hypoechoic nerves in patients with long-lasting neuropathy in the previous paragraph. This may be consistent with the findings of Miwa et al., but as mentioned, this impression is not supported by clinical research [40].
Given what has been said up to now, sonography may be a complementary first-line method and may be a cost-effective method to reduce the need for electrodiagnosis in patients with suspected CTS. However, classic needle electromyography and conduction studies are essential to resolve clinical doubts and to rule out cervical radiculopathy, brachial plexopathy, polyneuropathy and other focal mononeuropathies.
Can we arrive at any predictions for patient outcome under conservative or surgical therapy based on sonographic findings? To a certain extent we can: with extrapolation of the aforementioned results for grading of CTS severity with ultrasound we may consider patients with less severe CTS as better candidates for therapy. This was, for example, tested in a study comparing median nerve cross-section areas with outcome after local corticoid injections [41]. In their report Meys et al. conclude that less pronounced median nerve swelling indicates a less severe stage of CTS and therefore these patients are more likely to respond to treatment with corticosteroid injection [41]. However, these results might be true for patients with short-lasting CTS only, who show edema with loss of fascicular texture and somewhat enlarged median nerve cross-section. According to the research of Miwa et al., patients with long-lasting CTS may have minimally enlarged or even normal median nerve cross-section and may still be poor candidates for any kind of therapy [34].
The findings of Meys et al. could until now not be confirmed for patients undergoing surgery. Smidt and Visser, for example, could not find any correlation between preoperative median nerve cross-section area and surgical outcome [42]. They could find a reduction of median nerve cross-section after surgery in a substantial number of patients, but the reduction of median nerve swelling did not correlate directly with favorable or poor surgical outcome. In an MRI study on recurring CTS after surgery Campagna et al. found no differences in median nerve cross-section areas between patients with CTS recurrence and patients with good outcome [43]. The results of these two studies suggest that cross-section measurements have limited clinical utility in the evaluation of postoperative CTS. Campagna et al., however, found, that median nerves in patients with recurrence showed marked gadolinium contrast uptake, a direct expression of a disturbance of the localized nerve–blood barrier. Color Doppler ultrasound or microbubble contrast ultrasound may probably show similar findings, but results from controlled trials applying these techniques to the follow up of CTS patients after treatment are currently not available.
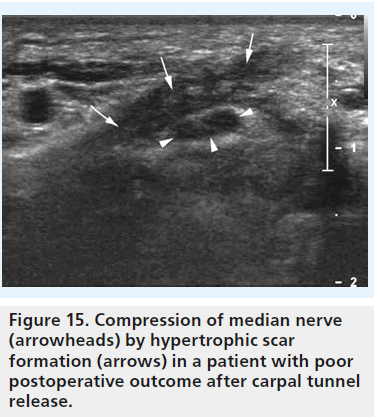
Currently, the value of a sonographic examination in patients after treatment, and especially after surgery, is to search for reasons of unfavorable outcome, such as the occurrence of hematoma, infection (Figure 14), scar formation (Figure 15), damage to the nerve with formation of neuroma, or incomplete dissection of the retinaculum [44]. The potential of high-resolution sonography to define these pathologies is outstanding. Therefore, sonography should be performed in every patient with poor outcome after surgery or conservative treatment.
Conclusion
Many authorities in the field agree that highresolution ultrasonography has an important position in the diagnosis of CTS. Several large scientific trials have confirmed that sonography is equally suited for the diagnosis of idiopathic CTS as is electrophysiological testing. It exceeds every other diagnostic method in the diagnosis of secondary CTS and the evaluation of post-treatment findings. Despite continuing concern on the variability of sonography when performed by different examiners, it has shown good inter- and intra-observer agreement concerning median nerve measurement. However, we have to state that constant highquality diagnoses are only achieved with stateof- the-art equipment, sufficient knowledge of local anatomy and the direct sonographic expression of CTS pathophysiology, as well as high standardization of the whole sonographic examination. Further research has to be done to answer the open questions in sonography of compression neuropathy but the future of nerve ultrasound looks bright.
Future perspective
During recent years, a high level of expertise in sonography of peripheral nerves has been achieved by the scientific community. B-mode sonography is meanwhile state of the art for the diagnosis of compression neuropathy, direct nerve trauma, nerve tumors and degenerative nerve disease. Color and power Doppler ultrasound techniques are currently being studied and may become important tools for the study of nerve vascularization, infection and degenerative disease alike. In this regard, the application of microbubble contrast ultrasound to the sonographic study of the peripheral nerve may be very promising, if we consider the pathophysiological nature of compression neuropathy.
Higher frequency transducers with further improved spatial resolution and contrast may soon be available and will enable the sonographer to look deeper into the ultrastructure of superficial peripheral nerves [45]. Results from ongoing ultrasound small animal research on the regeneration of peripheral nerves after trauma will give new insights into the evolution of nerve lesions and potentially alter the way we treat patients with nerve trauma [46].
Financial & competing interests disclosure
The authors have no relevant affiliations or financial involvement with any organization or entity with a financial interest in or financial conflict with the subject matter or materials discussed in the manuscript. This includes employment, consultancies, honoraria, stock ownership or options, expert testimony, grants or patents received or pending, or royalties.
No writing assistance was utilized in the production of this manuscript.
References
Papers of special note have been highlighted as:
* of considerable interest
- Seror P. Sonography and electrodiagnosis in carpal tunnel syndrome diagnosis, an analysis of the literature. Eur. J. Radiol. 67, 146–152 (2008).
- Levine DW, Simmons BP, Koris MJ, Daltroy LH, Hohl GG, Fossel AH. A self-administered questionnaire for the assessment of severity of symptoms and functional status in carpal tunnel syndrome. J. Bone Joint Surg. Am. 75, 1585–1592 (1993).
- Bland JDP, Weler P, Rudolfer S. Questionnaire tools for the diagnosis of carpal tunnel syndrome from the patient history. Muscle Nerve 44, 757–762, (2011).
- Witt JC, Stevens JC. Neurologic disorders masquerading as carpal tunnel syndrome: 12 cases of failed carpal tunnel release. Mayo Clin. Proc. 75, 409–413 (2000).
- Maravilla KR, Bowen BC. Imaging of the peripheral nervous system: evaluation of peripheral neuropathy and plexopathy. Am. J. Neuroradiol. 19, 1011–1023 (1998).
- Silvestri E, Martinoli C, Derchi LE et al. Echotexture of peripheral nerves: Correlation bewteen US and histologic findings and criteria to differentiate tendons. Radiology 197, 291–296 (1995). & First and path-breaking work on the correlation of peripheral nerve histology with sonographic representation.
- Blunt MJ. The vascular anatomy of the median nerve in the forearm and hand. J. Anat. 93, 15–23 (1959).
- Lundborg G. Ischemic nerve injury: experimental studies on intraneural microvascular pathophysiology and nerve function in a limb subjected to temporary circulatory arrest. Scand. J. Plast. Reconstr. 6, 11–47 (1970).
- Sunderland S. The carpal tunnel syndrome. In: Nerves and Nerve Injuries (2nd Edition). Churchill Livingstone, NY, USA, 711–727 (1981).
- Sugimoto H, Miyaji N, Ohsawa T. Carpal tunnel syndrome: evaluation of median nerve circulation with dynamic contrast enhanced MR imaging. Radiology 190, 459–466 (1994).
- Han Se, Lin C, Bolanr R et al. Nerve compression, membrane excitability, and symptoms of carpal tunnel syndrome. Muscle Nerve 44, 402–409 (2011).
- Buchberger W, Judmaier W, Birbamer G et al. Carpal tunnel syndrome: diagnosis with high resolution sonography. Am. J. Roentgenol. 159, 793–798 (1992).
- Duncan I, Sullivan P, Lomas F. Sonography in the diagnosis of carpal tunnel syndrome. Am. J. Roentgenol. 173, 681–684 (1999).
- Lee D, van Holsbeeck MT, Janevski PK, Ganos DL, Ditmars DM, Darian VB. Diagnosis of carpal tunnel syndrome. Ultrasound versus electromyography. Radiol. Clin. North Am. 37, 859–872 (1999).
- Sarria L, Cabada T, Cozcolluela R et al. Carpal tunnel syndrome: usefulness of sonography. Eur. Radiol. 10, 1920–1925 (2000).
- Buchberger W, Schon G, Strasser K, Jungwirth W. High resolution ultrasonography of the carpal tunnel. J. Ultrasound Med. 10, 531–537 (1991).
- Nakamichi KI, Tachibana S. Enlarged median nerve in idiopathic carpal tunnel syndrome. Muscle Nerve 23, 1713–1718 (2000).
- Koyuncuoglu HR, Kutluhan S, Yesildag A, Oyar O, Guler K, Ozden A. The value of ultrasonographic measurement in carpal tunnel syndrome in patients with negative electrodiagnostic test. Eur. J. Radiol. 56, 365–369 (2005).
- Wong SM, Griffith JF, Hui ACF, Tang A, Wong KS. Discriminatory sonographic criteria for the diagnosis of carpal tunnel syndrome. Arthritis Rheum. 46, 1914–1921 (2002).
- Klauser A, Halpern EJ, De Zordo T et al. Carpal tunnel syndrome assessment with US: value of additional cross-sectional area measurements of the median nerve in patients versus healthy volunteers. Radiology 250, 171–177 (2009).
- Hammer HB, Hovden IAH, Haavardsholm EA, Kvien TK. Ultrasonography shows increased cross-sectional area of the median nerve in patients with arthritis and carpal tunnel syndrome. Rheumatology 45, 584–588 (2006).
- Walker FO. Imaging nerve and muscle with ultrasound. Suppl. Clin. Neurophysiol. 57, 243–254 (2004).
- Werner RA, Jacobson JA, Jamadar DA. Influence of body mass index on median nerve function, carpal tunnel pressure, and cross-sectional area of the median nerve. Muscle Nerve 30, 481–485 (2004).
- Beekman R, Visser LH. Sonography in the diagnosis of carpal tunnel syndrome: a critical review of the literature. Muscle Nerve 27, 26–33 (2003).
- Hobson-Webb LD, Massey JM, Juel VC, Sanders DB. The ultrasonographic wrist-toforearm median nerve area ratio in carpal tunnel syndrome. Clin. Neurophysiol. 119(6), 1353–1357 (2008). & Introduces the concept of a median nerve cross-section ratio, which is still one of the most important and reliable measurements in clinical practice.
- Altinok T, Baysal O, Karakas HM et al. Ultrasonographic assessment of mild and moderate idiopathic carpal tunnel syndrome. Clin. Radiol. 59(10), 916–925 (2004).
- Lee SH, Lee SH, Chan VW, Lee JO, Kim HI. Echotexture and correlated histologic analysis of peripheral nerves important in regional anesthesia. Reg. Anesth. Pain Med. 36(4), 382–386 (2011).
- Gruber H, Glodny B, Peer S. The validity of ultrasonographic assessment in cubital tunnel syndrome: the value of a cubital-to-humeral nerve area ratio (CHR) combined with morphologic features. Ultrasound Med. Biol. 36(3), 376–382 (2010)
- Kobayashi S, Meir A, Baba H, Uchida K, Hayakawa K. Imaging of intraneural edema by using gadolinium-enhanced MR imaging: experimental compression injury. Am. J. Neuroradiol. 26(4), 973–980 (2005).
- Mallouhi A, Pülzl P, Trieb T, Piza H, Bodner G. Predictors of carpal tunnel syndrome: accuracy of gray-scale and color Doppler sonography. Am. J. Roentgenol. 186(5), 1240–1245 (2006).
- Ghasemi-Esfe AR, Khalilzadeh O, Vaziri- Bozorg SM et al. Color and power Doppler US for diagnosing carpal tunnel syndrome and determining its severity: a quantitative image processing method. Radiology 261(2), 499–506 (2011). & Takes the step from looking at median nerve vasculature with color Doppler ultrasound to quantification of vascular signals, which is probably the concept for the future.
- Joy V, Therimadasamy AK, Chan YC, Wilder-Smith EP. Combined Doppler and B-mode sonography in carpal tunnel syndrome. J. Neurol. Sci. 308, 16–20 (2011).
- Kaymak B, Ozçakar L, Cetin A, Candan Cetin M, Akinci A, Hasçelik Z. A comparison of the benefits of sonography and electrophysiologic measurements as predictors of symptom severity and functional status in patients with carpal tunnel syndrome. Arch. Phys. Med. Rehabil. 89(4), 743–748 (2008).
- Rahmani M, Ghasemi Esfe AR, Vaziri-Bozorg SM et al. The ultrasonographic correlates of carpal tunnel syndrome in patients with normal electrodiagnostic tests. Radiol. Med. 116(3), 489–496 (2011).
- Özcan HN, Kara M, Özcan F et al. Dynamic Doppler evaluation of the radial and ulnar arteries in patients with carpal tunnel syndrome. Am. J. Roentgenol. 197, W817–W820 (2011).
- Ghasemi-Esfe AR, Morteza A, Khalilzadeh O et al. Color Doppler ultrasound for evaluation of vasomotor activity in patients with carpal tunnel syndrome. Skeletal Radiol. 41(3), 281–286 (2012).
- El Miedany YM, Aty SA, Ashour S. Ultrasonography versus nerve conduction study in patients with carpal tunnel syndrome: substantive or complementary tests? Rheumatology 43(7), 887–895 (2004).
- Karadag YS, Karadag Ö, Cicekli E et al. Severity of carpal tunnel syndrome assessed with high frequency ultrasonography. Rheumatol. Int. 30, 761–765 (2010).
- Bayrak IK, Bayrak AO, Tilki HE et al. Ultrasonography in carpal tunnel syndrome: comparison with electrophysiological stage and motor unit number estimate. Muscle Nerve 35, 344–348 (2007).
- Miwa T, Miwa H. Ultrasonography of carpal tunnel syndrome: clinical significance and limitations in elderly patients. Intern. Med. 50, 2157–2161 (2011).
- Meys V, Thissen S, Rozeman S, Beekman R. Prognostic factors and carpal tunnel syndrome treated with a corticosteroid injection. Muscle Nerve 44, 763–768 (2011).
- Smidt MH, Visser LH. Carpal tunnel syndrome: clinical and sonographic follow up after surgery. Muscle Nerve 38, 987–991 (2008). & One of the few existing articles addressing the potential of ultrasound for the follow-up after carpal tunnel release.
- Campagna R, Pessis E, Feydy A et al. MRI assessment of recurrent carpal tunnel syndrome after open surgical release of the median nerve. Am. J. Roentgenol. 193, 644–650 (2009).
- Tan TC, Yeo CJ, Smith EW. High definition ultrasound as diagnostic adjunct for incomplete carpal tunnel release. Hand Surg. 16(3), 289–294 (2011).
- Stokvis A, van Neck JW, van Dijke CF, van Wamel A, Coert JH. High-resolution ultrasonography of the cutaneous nerve branches in the hand and wrist. Hand Surg. 34(6), 766–771 (2009).
- Kuffler DP. Ultrasound imaging of regenerating rat sciatic nerves in situ. J. Neurosci. Methods 188(2), 276–279 (2010).
