Review Article - Imaging in Medicine (2011) Volume 3, Issue 3
Role of CT perfusion imaging in the diagnosis and treatment of vasospasm
Edward D Greenberg1, Y Pierre Gobin1, Howard Riina1, Carl E Johnson2, Apostolos J Tsiouris2, Joseph Comunale2 & Pina C Sanelli†2,31Division of Interventional Neuroradiology, Department of Neurosurgery, Weill Cornell Medical College, NewYork-Presbyterian Hospital, NY, USA
2Department of Radiology, Weill Cornell Medical College, NewYork-Presbyterian Hospital, 525 East 68th Street, Starr 8A, New York, NY 10065, USA
3Department of Public Health, Weill Cornell Medical College, NY, USA
- Corresponding Author:
- Pina C Sanelli
Department of Radiology
Weill Cornell Medical College
NewYork-Presbyterian Hospital
525 East 68th Street, Starr 8A
New York, NY 10065, USA
Tel: +1 917 361 1628
E-mail: edg2008@nyp.org
Abstract
The current role of CT perfusion (CTP) imaging in the diagnosis and treatment of vasospasm in the setting of aneurysmal subarachnoid hemorrhage is discussed in this article, with specific attention directed towards defining the terminology of vasospasm and delayed cerebral ischemia. A commonly used CTP technique in clinical practice is described. A review of the literature regarding the usefulness of CTP for the diagnosis of vasospasm and its role in guiding treatment are discussed. Recent research advances in the utilization of CTP and associated ongoing challenges are also presented.
Keywords
CT perfusion ▪ delayed cerebral ischemia ▪ digital subtraction angiography ▪ subarachnoid hemorrhage ▪ vasospasm
Aneurysmal subarachnoid hemorrhage (A-SAH) is a potentially devastating condition, affecting as many as 30,000 Americans each year [1]. According to a large multinational WHO study, the age-adjusted annual incidence of SAH varies by tenfold between different countries, from 2.0 cases per 100,000 individuals in China to 22.5 per 100,000 in Finland [2]. Despite many advances in the diagnosis and treatment of A-SAH, outcomes for patients remain poor, with mortality rates as high as 50% and significant morbidity among many of the survivors [1,3]. Major causes of morbidity and mortality in the setting of A-SAH include the development of vasospasm and delayed cerebral ischemia (DCI), which can have the sequelae of permanent neurologic deficit, infarction and death [4]. In clinical practice, diagnosis is challenging because patients with cerebral vasospasm or delayed cerebral ischemia may not necessarily exhibit definitive clinical or radiological findings. Despite these difficulties, it is critical that the diagnosis be confirmed as early as possible, since early diagnosis and treatment of vasospasm or delayed cerebral ischemia reduces morbidity and mortality in A-SAH patients [5]. Diagnosis is usually made by clinical examination, transcranial Doppler ultrasound (TCD) and digital subtraction angiography (DSA). More recently, CT angiography (CTA), magnetic resonance angiography and perfusion techniques, such as magnetic resonance perfusion (MRP) and CT perfusion (CTP), have emerged as newer modalities to assist in the diagnosis of vasospasm [6]. MRP may be performed using dynamic susceptibility contrast-enhanced techniques or arterial spin labeling techniques and has been shown to be useful for the early detection of ischemia in the setting of vasospasm [7–9]. This review discusses the use of CTP to assist in the early diagnosis of vasospasm and DCI in order to prompt immediate treatment.
Terminology & definitions
In recent years, the terminology of vasospasm has been under review to more accurately define the different aspects of this entity. The term ‘cerebral vasospasm’ is commonly used to refer to both the clinical findings of delayed onset of neurologic deficits and the narrowing of cerebral vessels documented by imaging studies. The caveat is that patients do not necessarily exhibit both clinical and imaging findings of vasospasm, and symptoms can be nonspecific. Thereby, several terms have emerged to describe its various features, such as symptomatic or clinical vasospasm, angiographic vasospasm and DCI, and infarction after A-SAH.
Recently, an expert opinion recommended reserving the term vasospasm for patients with arterial narrowing documented on imaging studies [10]. Vasospasm on imaging studies is seen as narrowing of the large- or mediumsized intracranial arteries, affecting up to 70% of A-SAH patients. DSA is the gold standard for the diagnosis of vasospasm, although CTA and magnetic resonance angiography can also be used. Angiographic assessment of vasospasm is both subjective and semiquantitative, relying on the comparison of the size of the cerebral arteries to an internal standard, such as the distal internal carotid artery or to a prior baseline study. Severe vasospasm is defined as a greater than 50% reduction in the vessel diameter, moderate vasospasm as a 25–50% reduction and mild vasospasm as a less than 25% reduction in the vessel lumen.
Delayed cerebral ischemia is used to describe patients who develop new focal neurological impairment, which may include patients with microvascular vasospasm not seen on DSA. DCI is defined as the delayed onset of neurological deterioration or the presence of cerebral infarction documented on imaging studies, which is not explained by other causes [11]. DCI affects approximately 20–30% of A-SAH patients, and may manifest as alterations in consciousness or clinical worsening, such as new motor neurologic deficits or speech disturbance. Imaging is performed to exclude other causes of neurologic decline, such as aneurysm rebleeding, extraaxial hematoma or hydrocephalus. Fever, metabolic abnormality or systemic factors that may contribute to neurologic change should also be excluded. The absence of other factors to account for deterioration of the patient’s neurologic status usually prompts further evaluation with imaging studies, such as TCD, CTA or DSA, to evaluate for vasospasm. Frontera et al. emphasize that DCI is the most clinically relevant term because of its strong association with poor clinical outcome, cognitive impairment and reduced quality of life [11].
It is important to note that the terms vasospasm and DCI are related; neurologic deterioration or cerebral infarction in DCI not explained by other causes are presumably the result of arterial narrowing. Conversely, the presence of significant vasospasm on imaging studies can result in reduced blood flow and perfusion to a focal region of the brain manifesting as a neurologic deficit and/or infarction. Although several studies have shown that vasospasm documented at imaging and DCI are not always concurrently present in patients [4,12], these terms have been used interchangeably, particularly in sedated or comatose patients who cannot be evaluated by clinical examination. In order to address inconsistencies and prevent confusion in the literature, an expert panel has reviewed this terminology and provided the following recommendations for research studies: DCI is defined as cerebral infarction identified on CT or MRI, after exclusion of procedure-related infarctions and/or outcome measures of neurologic function showing alteration not attributed to other causes. The term vasospasm is reserved for the presence of arterial narrowing documented on imaging studies [10]. These efforts are essential to uniformly classify A-SAH patients in research studies and allow for the translation of research discoveries into new clinical practice strategies in order to ultimately prevent DCI and improve patient outcomes.
Pathophysiology
The pathogenesis of cerebral vasospasm is complex and not well understood. There is strong evidence that cerebral vasospasm results from prolonged smooth muscle contraction mediated by the presence of subarachnoid blood. A relationship between the volume of blood in the subarachnoid space and the severity of vasospasm seen at DSA has been demonstrated in a canine model [13]. In support of this concept, Zhang et al. found that the removal of blood clots in the subarachnoid space reverses angiographic vasospasm in an animal model using monkeys [14]. In addition, the amount of subarachnoid blood seen on CT in patients with A-SAH correlated with the severity of vasospasm [15]. Furthermore, symptoms of vasospasm were attributed to brain regions supplied by vessels that were initially surrounded by a thick subarachnoid clot [15]. Risk factors for patients developing vasospasm after A-SAH include younger age (<68 years), cigarette smoking, hypertension and cocaine use.
Other theories suggest that oxyhemoglobin has a central role in the development of cerebral vasospasm based on the premise that patients with perimesencephalic hemorrhage from a venous source have a significantly lower incidence of vasospasm compared with patients with A-SAH from an arterial source [16–19]. Furthermore, it has been shown that erythrocytes are a necessary component for vasospasm to develop, and their most vasoactive substance is oxyhemoglobin [17]. Oxyhemoglobin may have a direct contractile effect on smooth muscle fibers and may also mediate indirect effects through mechanisms involving superoxide free radicals and the release of vasoactive substances from the arterial wall [16]. The production of superoxide free radicals leads to the release of lipid peroxides, which are capable of producing vasospasm [16]. Superoxide free radicals may also result in reduced availability of nitric oxide, a potent arterial vasodilator, resulting in smooth muscle contraction [20,21]. The formation of superoxide free radicals is also associated with an alteration in the balance between prostaglandin I2 (a vasodilator) and prostaglandin E2 (a vasoconstrictor) through calcium- and/or calmodulin-dependent mechanisms [21]. In addition, the release of the potent vasoconstricting factor endothelin-1 from the endothelium of the arterial wall may contribute to the development of vasospasm [19]. Prolonged cerebral vasospasm eventually leads to intimal hyperplasia, media smooth muscle cell proliferation, collagen deposition and subendothelial fibrosis that may continue to compromise the vessel lumen [4]. In support of these theories, treatments for vasospasm that target these pathophysiological mechanisms have demonstrated improvement in patients’ outcomes. For example, simvastatin is capable of increasing endothelial nitric oxide synthase activity and has been shown to ameliorate vasospasm in mice [22].
In summary, a multifaceted and complex cascade of events initiated after A-SAH ultimately leads to vasospasm in many patients. The breakdown of blood products in the subarachnoid space probably triggers the calcium-dependent vasoconstriction of smooth muscle cells. This process also involves lipid peroxides, superoxide free radicals, endothelium-derived vasoconstrictors, nitric oxide and arachidonic acid metabolites. Evidence also implicates disruption of the neuronal mechanisms that regulate the vascular tone of the vessels, and other factors that work together to produce the clinical and radiological entity of vasospasm [16].
CTP technique
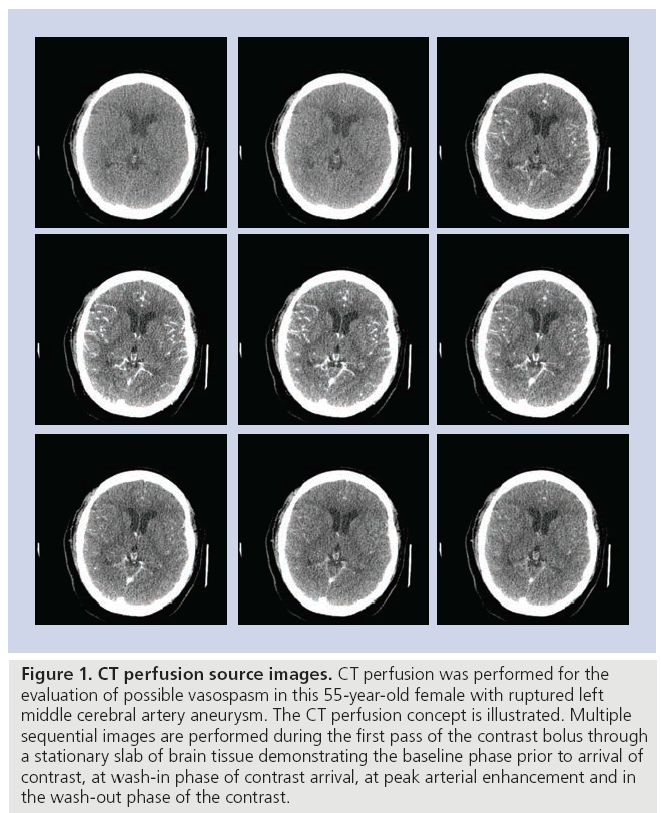
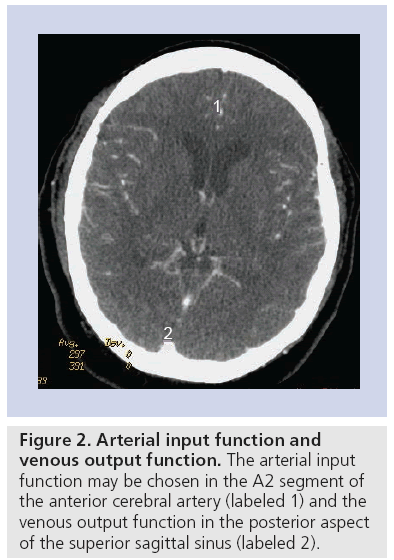
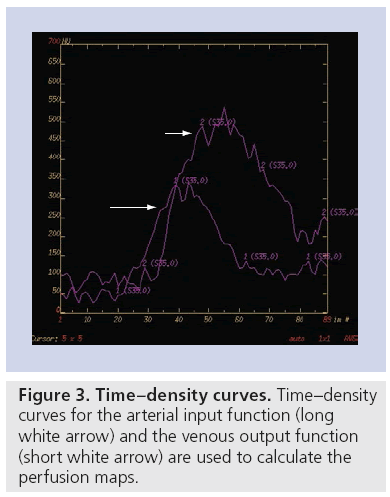
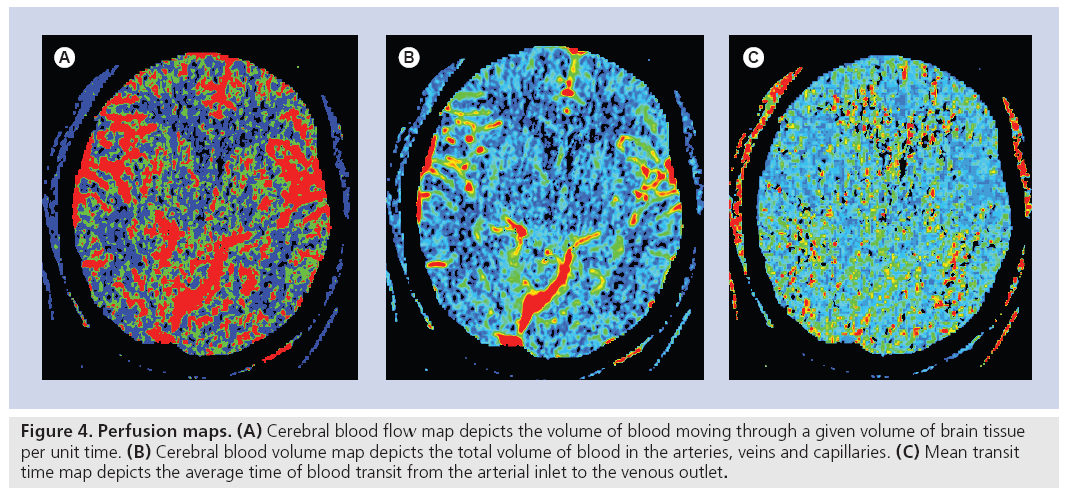
CT perfusion is a functional imaging study of the brain performed with cine scanning acquisition during the rapid administration of a single small bolus of intravenous contrast material. Cine scanning is the repeated sequential scanning through a limited region of brain tissue performed during the passage of a contrast material bolus through the cerebral vasculature (Figures 1–4). After rapid contrast-agent injection, there is a transient increase in the attenuation of the brain parenchyma measured in Hounsfield units, which is proportional to the amount of contrast material delivered. The change in attenuation over the scanning period is represented as the time–attenuation curve, depicting the rise and fall in attenuation as the contrast material bolus arrives and washes out. Time–attenuation curves can be obtained for arterial, venous and parenchymal regions of interest (Figures 1–4). There are two postprocessing methods that can be employed to calculate the perfusion parameters of cerebral blood flow (CBF), cerebral blood volume (CBV) and mean transit time (MTT) from these data: the deconvolution method and the maximumslope method. The differences in these methods are based on their mathematical algorithms. The most important practical difference between these two methods is that the maximum-slope method requires a contrast-material injection rate of 8 ml/s, while the deconvolution method allows for injection rates as low as 3–4 ml/s. Since the slower injection rate is more practical for most patients, the deconvolution method is more widely used in clinical practice. There are conflicting reports regarding the potential variability in the qualitative and quantitative CTP results based on these two methods. One recent study showed that the deconvolution and maximum- slope methods yield comparable qualitative and quantitative results, although a second recent report concluded that CTP maps were significantly different between software packages using deconvolution and maximum-slope methods [23,24]. The deconvolution method utilizes an ideal tissue time–attenuation curve, known as the impulse residual function to calculate CBF, MTT and CBV, which are also related by the central volume principle: CBF = CBV/MTT. The accuracy of this method depends on the assumption of an intact blood–brain barrier and no recirculation of contrast material [25,26].
Figure 1: CT perfusion source images. CT perfusion was performed for the evaluation of possible vasospasm in this 55-year-old female with ruptured left middle cerebral artery aneurysm. The CT perfusion concept is illustrated. Multiple sequential images are performed during the first pass of the contrast bolus through a stationary slab of brain tissue demonstrating the baseline phase prior to arrival of contrast, at wash-in phase of contrast arrival, at peak arterial enhancement and in the wash-out phase of the contrast.
Figure 4: Perfusion maps. (A) Cerebral blood flow map depicts the volume of blood moving through a given volume of brain tissue per unit time. (B) Cerebral blood volume map depicts the total volume of blood in the arteries, veins and capillaries. (C) Mean transit time map depicts the average time of blood transit from the arterial inlet to the venous outlet.
At our institution, a multidetector row scanner (Pro-16 or -64 scanners; GE Medical Systems, Milwaukee, WI, USA) is used for CTP imaging. Our CTP protocol includes an initial unenhanced CT of the whole brain acquired at 5-mm collimation. Immediately following, a 20-mm section is prescribed with its inferior extent at the level of the basal ganglia. The sections are angled to avoid the orbits in order to minimize radiation exposure to the lens. At this level, representations of the anterior, middle and posterior cerebral artery territories are included in the scanning field. A total of 45 ml of nonionic iodinated contrast material is power injected intravenously at a rate of 5 ml/s. At 5 s after the contrast material injection, a 45-s cine scan is acquired at one rotation per second, 80 kV, and 150 mA.
Postprocessing of the parametric maps is performed on a GE Advantage Workstation using CTP software version 3.0 or 4.0 (GE Medical Systems), which employs a delay-insensitive deconvolution technique and a singular-value decomposition deconvolution algorithm. The arterial input function (AIF) is typically chosen in the A2 segment of the anterior cerebral artery and the venous output function in the posterior aspect of the superior sagittal sinus, in order to maintain standardization in the postprocessing technique (Figures 1–4). The impulse residual function represents the ideal time–density curve that would result from an instantaneous injection of contrast material. Given that such an instantaneous injection is not possible in clinical practice, deconvolution methods are used to determine the impulse residual function, taking into account the true injection rate, as determined by the AIF. The perfusion values of CBV, CBF and MTT are derived from the impulse residual function. The venous output function allows for correction of the arterial time–attenuation curve for the effects of partial volume averaging [26]. It is important to select the locations of the arterial input and venous output functions, which yield the highest peak enhancement on the time–density curve since higher peak enhancement values are associated with a better signal-to-noise ratio on the perfusion maps [27]. Small differences in the location of the arterial input and venous output functions within a given artery or vein can result in variability in perfusion map quality, likely due to volume averaging [27]. Although there is some concern regarding the appropriate selection of the AIF location, several studies have shown that there are no significant variations in the quantitative CTP parameters of patients with acute cerebral ischemia when using different AIF locations [28–30]. Delay of contrast material arrival and/or dispersion of contrast material have been shown to result in overestimation of ischemic territories in the setting of acute infarction, but the use of a delay-insensitive technique reduces the effect of selecting an AIF location in a diseased vessel [30–32] .
CTP interpretation for vasospasm & DCI
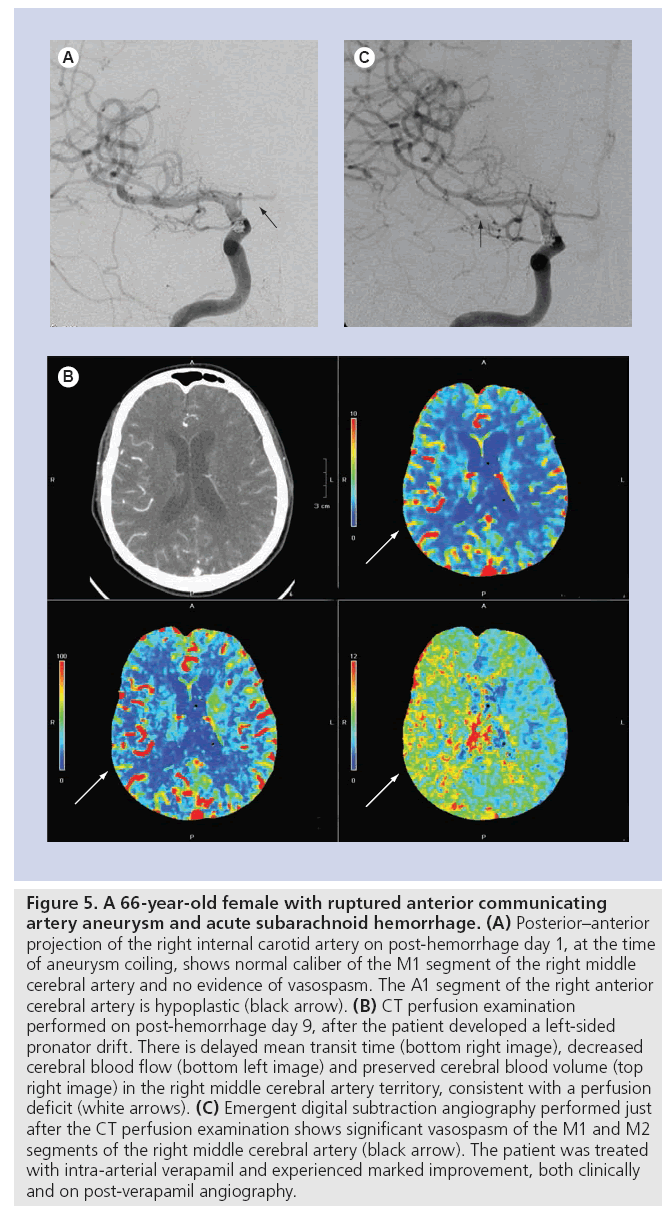
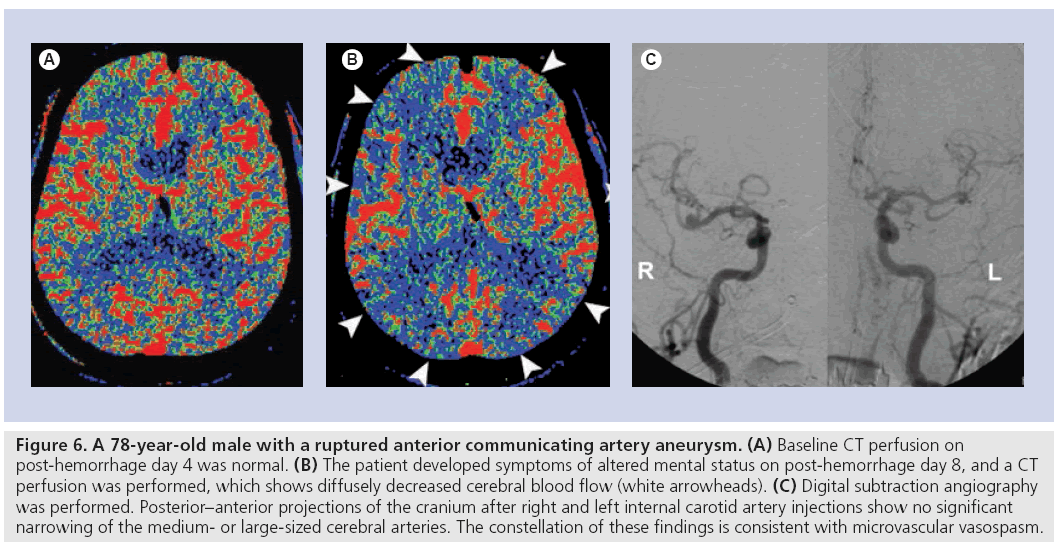
Recent studies have shown that there is an association between angiographic vasospasm and the presence of a perfusion deficit in the corresponding territory. A-SAH patients with greater than 50% angiographic narrowing of a given vessel tend to have a perfusion deficit with reduced CBF (Figure 5) [4]. Dankbaar et al. demonstrated a correlation between the severity of angiographic vasospasm and the degree of the perfusion deficit. The vascular territory of the most spastic vessel corresponded with the least perfused region [33]. However, many patients with cerebral ischemia or infarction in the setting of A-SAH do not exhibit angiographic vasospasm involving the large- or medium-sized vessels (Figure 6) [34]. A likely explanation is the presence of vasospasm of the small arterioles. The term microvascular vasospasm has been used to describe patients with a perfusion deficit that do not have evidence of angiographic vasospasm involving the large- or medium-sized intracranial arteries supplying the area of the perfusion abnormality. Microvascular vasospasm is best demonstrated in perfusion imaging studies. Consequently, the introduction of perfusion imaging, and CTP in particular, has led to more emphasis on evaluating the cerebral microcirculation at the capillary level in A-SAH patients.
Figure 5: A 66-year-old female with ruptured anterior communicating artery aneurysm and acute subarachnoid hemorrhage. (A) Posterior–anterior projection of the right internal carotid artery on post-hemorrhage day 1, at the time of aneurysm coiling, shows normal caliber of the M1 segment of the right middle cerebral artery and no evidence of vasospasm. The A1 segment of the right anterior cerebral artery is hypoplastic (black arrow). (B) CT perfusion examination performed on post-hemorrhage day 9, after the patient developed a left-sided pronator drift. There is delayed mean transit time (bottom right image), decreased cerebral blood flow (bottom left image) and preserved cerebral blood volume (top right image) in the right middle cerebral artery territory, consistent with a perfusion deficit (white arrows). (C) Emergent digital subtraction angiography performed just after the CT perfusion examination shows significant vasospasm of the M1 and M2 segments of the right middle cerebral artery (black arrow). The patient was treated with intra-arterial verapamil and experienced marked improvement, both clinically and on post-verapamil angiography.
Figure 6: A 78-year-old male with a ruptured anterior communicating artery aneurysm. b Baseline CT perfusion on post-hemorrhage day 4 was normal. (B) The patient developed symptoms of altered mental status on post-hemorrhage day 8, and a CT perfusion was performed, which shows diffusely decreased cerebral blood flow (white arrowheads). (C) Digital subtraction angiography was performed. Posterior–anterior projections of the cranium after right and left internal carotid artery injections show no significant narrowing of the medium- or large-sized cerebral arteries. The constellation of these findings is consistent with microvascular vasospasm.
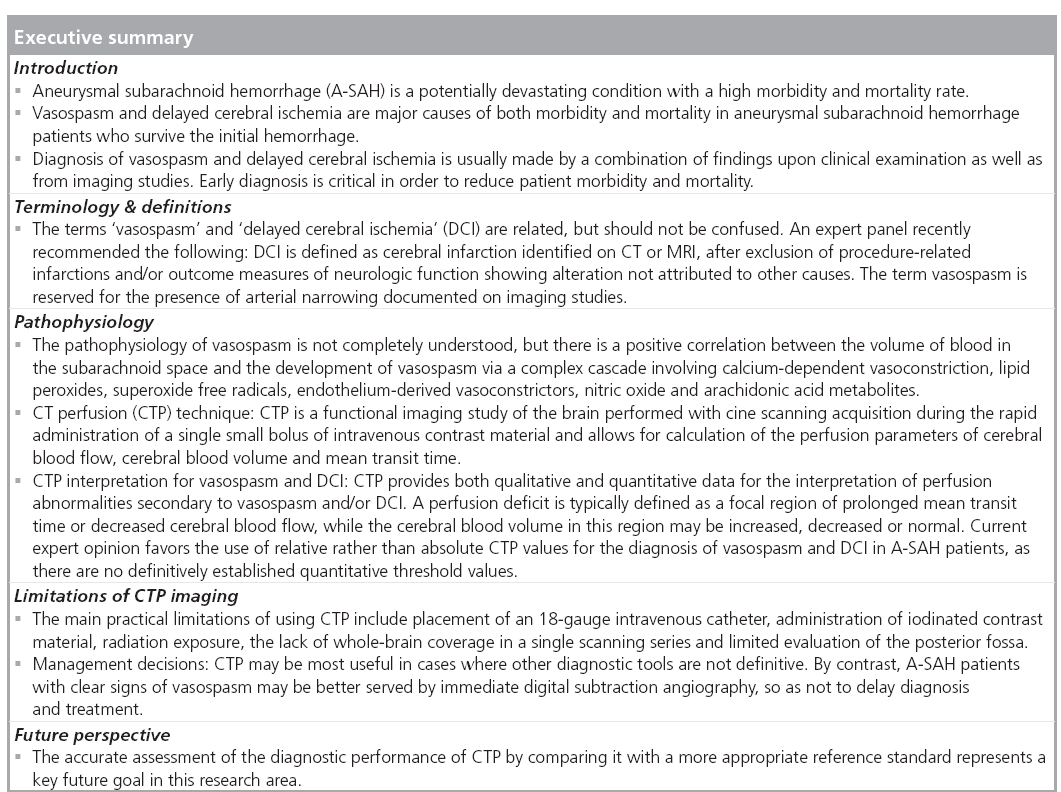
Both qualitative and quantitative data are provided by CTP for the interpretation of perfusion abnormalities secondary to vasospasm and/or DCI. Similar to Xenon-CT, PET and SPECT, CTP evaluates the hemodynamic status of the brain at the capillary level. Qualitative interpretation of CTP maps relies on the comparison between the right and left hemispheres to detect a focal region of abnormality. A perfusion deficit is typically defined as a focal region of prolonged MTT or decreased CBF. The CBV in this region may be increased, decreased or normal. CTP also provides quantitative data in the form of CBF (ml/100 g/min), CBV (ml/100 g) and MTT (s). CBF values, as measured by CTP, have been validated by comparison with Xenon-CT and PET. One study reported global CBF values of 46 ± 24 ml/100 g/min, and gray matter values of 68 ± 13 ml/100 g/min [35]. Another study reported that the normal range of CBF in the cerebral cortex with vessels is 58 ± 13 ml/100 g/min, in the cerebral cortex without vessels is 44 ± 7 ml/100 g/min, in deep gray matter is 42 ± 7 ml/100 g/min and in white matter is 13 ± 2 ml/100 g/min [36]. The authors of this study acknowledge that these CTP values are somewhat low compared with other reports, a fact that they attribute to the age of the population in their study, which was 67–80 years. The normal range for CBV is 4.4 ± 0.9 ml/100 g in gray matter and 2.3 ± 0.4 ml/100 g in white matter [37]. The normal range of values for MTT is less than 5 s [38,39].
Currently, there are no definitively established quantitative threshold values for MTT, CBF and CBV for the diagnosis of vasospasm and DCI in A-SAH patients. In a recent study, Dankbaar et al. analyzed the threshold values of the CTP parameters for the diagnosis of DCI in A-SAH patients [40]. The investigators demonstrated that prolonged MTT and decreased CBF were the most useful metrics for diagnosing DCI. Furthermore, an MTT threshold of 5.9 s or an MTT difference of greater than 1.1 s between normal and abnormal regions were shown to be the optimal diagnostic threshold values. The sensitivity and specificity were 70 and 77% for MTT, respectively. A CBF threshold of 36.3 ml/100 g/min or a CBF ratio of 0.77 between abnormal and normal contralateral hemisphere yielded sensitivity and specificity values of 74 and 76%, and 63 and 63%, respectively. Another study demonstrated that the combination of qualitative CTA findings for arterial narrowing and an MTT threshold of 6.4 s is the most accurate (93%) combination of imaging findings for the diagnosis of vasospasm [41]. In addition, MTT alone represented the most sensitive parameter with a negative predictive value of 98.7% [41]. A recent meta-analysis comparing CTP with DSA in the diagnosis of vasospasm found high diagnostic accuracy for CTP, with 74.1% sensitivity, 93.0% specificity, 9.3 positive-likelihood ratio (LR+) and 0.2 negative- likelihood ratio (LR-). Receiver operating characteristic analysis yielded an AUC of 97 ± 3.0%, representing the diagnostic accuracy of CTP. These results were considered preliminary findings derived from the current literature, since there were few research studies that met the meta-analysis inclusion criteria. Also, the studies that were included varied significantly in their methodological quality and reporting methods [42]. Other investigators have studied the diagnostic performance of CTP by comparing it with a clinical reference standard as opposed to DSA. One such study using a clinical reference standard for the diagnosis of vasospasm found that qualitative CTP interpretation is superior to routine noncontrast CT and CTA for vasospasm diagnosis in A-SAH patients, with a sensitivity and specificity of 84 and 79%, respectively [43].
Thresholds of CTP in the setting of acute cerebral infarction may also be applicable to A-SAH patients suspected of having vasospasm and, therefore, knowledge of these thresholds is also relevant. Reported optimal threshold values for ischemic penumbra and core infarction vary widely. This variability could be related to the wide range of perfusion techniques and software, the variation in statistical techniques used to analyze threshold values and the innate time dependence of perfusion thresholds in the setting of acute cerebral ischemia. One systematic review reported CBF thresholds for the ischemic penumbra and infarct core, as measured by MRP or PET, ranging from 14.1 to 35.0 ml/100 g/min and 4.8 to 8.4 ml/100 g/min, respectively [44]. Another study showed that a CBV value below 2.0 ml/100 g was an accurate threshold for core infarction and that ischemic penumbra can be determined by relative MTT values greater than 145% of the normal contralateral vascular territory [45]. Schaefer et al. demonstrated that the CBF ratio between the normal and abnormal tissue is the best parameter for distinguishing regions of core infarction and ischemic penumbra [46]. In this study, areas of brain parenchyma with a mean CBF of less than 32% of the normal contralateral side were infarcted on follow-up CT or T2-weighted MRI, whereas brain parenchyma with a CBF ratio greater than 44% did not infarct on follow-up imaging. In addition, areas of brain parenchyma with a CBV ratio less than 68% appeared infarcted on follow-up imaging. In terms of absolute quantitative values, a CBF of less than 12.7 ml/100 g/min or a CBV of less than 2.2 ml/100 g resulted in infarction on follow-up imaging [46]. These results are consistent with other reports in the literature indicating that cell death occurs when the CBF drops below 10 ml/100 g/min, although loss of neuronal function ensues at CBF values below 20 ml/100 g/min [39]. CBV values less than 2.0 ml/100 g can also be considered as core infarction.
In summary, caution is emphasized when using absolute quantitative CTP values for the diagnosis of vasospasm and DCI in A-SAH patients. Current expert opinion favors the use of relative rather than absolute CTP values, given the potential for variability in absolute quantification of CTP parameters and the dependence of these values on an appropriate but an often arbitrary venous output scaling factor [47]. Dankbaar et al. have demonstrated that relative threshold values have better diagnostic properties than absolute measurements since relative measurements reduce the variability caused by the postprocessing steps [40,48]. Going forward, standardization and validation of CTP methodology and postprocessing techniques are necessary for its widespread implementation in A-SAH patients.
Limitations of CTP imaging
The main practical limitations of using CTP include placement of an 18-gauge intravenous catheter, administration of iodinated contrast material and radiation exposure. Another limitation of CTP is that it does not allow for whole-brain coverage in a single scanning series, although technological advances with volumetric scanning techniques may overcome this disadvantage in clinical practice. Furthermore, beam hardening artifact from adjacent bone limits CTP evaluation of the posterior fossa.
Management decisions
Commonly used medical treatment options for vasospasm include calcium channel blockade, usually with nimodipine, and hypertension– hypervolemia– hemodilution therapy. Interventional treatment options include selective and superselective infusion of vasodilatory substances, such as verapamil, as well as balloon angioplasty. However, hypertension– hypervolemia– hemodilution treatment risks include cerebral edema, aneurysm rebleeding and pulmonary edema, as well as potential cardiac injury related to the use of pressor-type medications, while interventional treatments carry the main risks of stroke and groin complications [49]. Therefore, the accurate diagnosis of vasospasm is critical in order to avoid exposing patients to unnecessary risks. CTP may be most useful in cases where other diagnostic tools, such as TCD and clinical examination, are not definitive. This is often the case in many patients with A-SAH who are intubated and/or sedated, in whom only a limited clinical examination is possible. In addition, some A-SAH patients may not have ideal or adequate sonographic windows for reliable TCD examination. By contrast, A-SAH patients with clear signs of vasospasm may be better served by immediate DSA, so as not to delay diagnosis and treatment. In addition, A-SAH patients who develop vasospasm may demonstrate early alterations in cerebral perfusion detectable on baseline CTP examinations performed within the first few days post-hemorrhage [50]. The ability of CTP to identify patients at high risk for developing vasospasm has the potential to reduce morbidity and mortality by prompting robust preventative measures and early treatment.
Given that CTP provides information about the cerebral microvascular circulation, CTP may be best utilized in vasospasm diagnosis in conjunction with CTA or conventional angiography, enabling one to evaluate the entirety of the cerebral vasculature, from the largest vessels to the capillaries. In support of this combined approach, one study using DSA as a reference standard demonstrated that qualitative assessment of vessel caliber on CTA combined with CTP analysis having a corresponding MTT threshold of 6.4 s represented the most accurate (93%) combination of CTA and CTP for the diagnosis of vasospasm [41].
Future perspective
The accurate assessment of the diagnostic performance of CTP by comparing it with a more appropriate reference standard represents a key future goal in this research area. In the recent special report by Vergouwen et al., the authors proposed using the presence or absence of cerebral infarction on CT or MRI, as well as functional outcome, as the two main outcome measures in future studies aimed at investigating strategies to prevent DCI. The authors further recommended that clinical deterioration be used as a secondary measure of outcome, and that angiographic findings be reserved to discuss vasospasm. The presence of cerebral infarction and the functional status of the patient are of major importance in uniformly classifying A-SAH patients in clinical trials. However, it is also important to recognize the value of clinical examination and imaging findings, including DSA, in the prospective clinical care of these patients, in order to prevent DCI/vasospasm and improve functional outcomes in these patients. An alternative reference standard, which has been both published and validated, recognizes the significance of the above outcome measures by incorporating them into a combined reference standard based on a clinical practice approach using intensive clinical monitoring and serial imaging examinations. The strengths of this reference standard include its applicability to the entire A-SAH population, incorporation of the most relevant outcome measures of cerebral ischemia in the setting of A-SAH, thorough criteria to exclude other potential causes and consideration of response-to-treatment to determine diagnosis [51,52]. Despite the strengths of using this reference standard, there are no studies published to date that assess the diagnostic performance of CTP when compared with such a reference standard. Such a study would be expected to provide more robust results and is an important area of future research efforts.
Conclusion
For those A-SAH patients who survive the initial hemorrhage, both vasospasm and delayed cerebral ischemia may result in significant morbidity and mortality. Currently, standard diagnostic algorithms such as clinical examination, TCD and DSA do not always result in timely or accurate diagnoses, and new modalities are being examined for their potential to offer a more accurate diagnostic performance. The emerging technology of CTP imaging provides quantitative and qualitative functional cerebral perfusion information in the form of CBF, CBV and MTT maps. Such cerebral perfusion information has been recognized as a valuable tool for the diagnosis of vasospasm and/or delayed cerebral ischemia. Furthermore, CTP can be combined with CTA in order to assess both anatomic vessel narrowing (CTA) and cerebral perfusion (CTP) during a single examination. CTP may be most useful in cases where other diagnostic tools, such as TCD and clinical examination, are not definitive, as patients with clearly diagnosed vasospasm may be better served by prompt treatment. Further studies are needed to better determine the diagnostic accuracy of CTP in the detection of vasospasm, and its role in guiding management decisions and assessing clinical outcome. The accurate assessment of the diagnostic performance of CTP by comparing it with a more appropriate reference standard represents a key future goal in this research area.
Financial & competing interests disclosure
The authors have no relevant affiliations or financial involvement with any organization or entity with a financial interest in or financial conflict with the subject matter or materials discussed in the manuscript. This includes employment, consultancies, honoraria, stock ownership or options, expert testimony, grants or patents received or pending, or royalties.
No writing assistance was utilized in the production of this manuscript.
References
Papers of special note have been highlighted as:
• of interest
• • of considerable interest
- Bederson JB, Connolly ES Jr, Batjer HH et al.: Guidelines for the management of aneurysmal subarachnoid hemorrhage: a statement for healthcare professionals from a special writing group of the Stroke Council, American Heart Association. Stroke 40(3), 994–1025 (2009).
- Ingall T, Asplund K, Mahonen M et al.: A multinational comparison of subarachnoid hemorrhage epidemiology in the WHO MONICA stroke study. Stroke 31(5), 1054–1061 (2000).
- van Gijn J, Kerr RS, Rinkel GJ: Subarachnoid haemorrhage. Lancet 369(9558), 306–318 (2007).
- Sanelli PC, Ougorets I, Johnson CE et al.: Using CT in the diagnosis and management of patients with cerebral vasospasm. Semin. Ultrasound CT MR 27(3), 194–206 (2006).
- Rosenwasser RH, Armonda RA, Thomas JE et al.: Therapeutic modalities for the management of cerebral vasospasm: timing of endovascular options. Neurosurgery 44(5), 975–979 (1999).
- Wintermark M, Sesay M, Barbier E et al.: Comparative overview of brain perfusion imaging techniques. Stroke 36(9), E83–E99 (2005).
- Ohtonari T, Kakinuma K, Kito T et al.: Diffusion-perfusion mismatch in symptomatic vasospasm after subarachnoid hemorrhage. Neurol. Med. Chir. (Tokyo) 48(8), 331–336 (2008).
- Hertel F, Walter C, Bettag M et al.: Perfusion-weighted magnetic resonance imaging in patients with vasospasm: a useful new tool in the management of patients with subarachnoid hemorrhage. Neurosurgery 56(1), 28–35 (2005).
- Leclerc X, Fichten A, Gauvrit JY et al.: Symptomatic vasospasm after subarachnoid haemorrhage: assessment of brain damage by diffusion and perfusion-weighted MRI and single-photon emission computed tomography. Neuroradiology 44(7), 610–616 (2002).
- Vergouwen MD, Vermeulen M, van Gijn J et al.: Definition of delayed cerebral ischemia after aneurysmal subarachnoid hemorrhage as an outcome event in clinical trials and observational studies: proposal of a multidisciplinary research group. Stroke 41(10), 2391–2395 (2010).
- Frontera JA, Fernandez A, Schmidt JM et al.: Defining vasospasm after subarachnoid hemorrhage: what is the most clinically relevant definition? Stroke 40(6), 1963–1968 (2009).
- Dankbaar JW, Rijsdijk M, van der Schaaf IC et al.: Relationship between vasospasm, cerebral perfusion, and delayed cerebral ischemia after aneurysmal subarachnoid hemorrhage. Neuroradiology 51(12), 813–819 (2009).
- Zabramski JM, Spetzler RF, Bonstelle C: Chronic cerebral vasospasm: effect of volume and timing of hemorrhage in a canine model. Neurosurgery 18(1), 1–6 (1986).
- Zhang ZD, Yamini B, Komuro T et al.: Vasospasm in monkeys resolves because of loss of and encasement of subarachnoid blood clot. Stroke 32(8), 1868–1874 (2001).
- 15 Fisher CM, Kistler JP, Davis JM: Relation of cerebral vasospasm to subarachnoid hemorrhage visualized by computerized tomographic scanning. Neurosurgery 6(1), 1–9 (1980).
- Kolias AG, Sen J, Belli A: Pathogenesis of cerebral vasospasm following aneurysmal subarachnoid hemorrhage: putative mechanisms and novel approaches. J. Neurosci. Res. 87(1), 1–11 (2009).
- Macdonald RL, Weir BK: A review of hemoglobin and the pathogenesis of cerebral vasospasm. Stroke 22(8), 971–982 (1991).
- Nishizawa S, Laher I: Signaling mechanisms in cerebral vasospasm. Trends Cardiovasc. Med. 15(1), 24–34 (2005).
- Pluta RM: Delayed cerebral vasospasm and nitric oxide: review, new hypothesis, and proposed treatment. Pharmacol. Ther. 105(1), 23–56 (2005).
- Hänggi D, Steiger HJ: Nitric oxide in subarachnoid haemorrhage and its therapeutics implications. Acta Neurochir. (Wien) 148(6), 605–613 (2006).
- Treggiari-Venzi MM, Suter PM, Romand JA: Review of medical prevention of vasospasm after aneurysmal subarachnoid hemorrhage: a problem of neurointensive care. Neurosurgery 48(2), 249–261 (2001).
- McGirt MJ, Lynch JR, Parra A et al.: Simvastatin increases endothelial nitric oxide synthase and ameliorates cerebral vasospasm resulting from subarachnoid hemorrhage. Stroke 33(12), 2950–2956 (2002).
- Kudo K, Sasaki M, Yamada K et al.: Differences in CT perfusion maps generated by different commercial software: quantitative analysis by using identical source data of acute stroke patients. Radiology 254(1), 200–209 (2010).
- Abels B, Klotz E, Tomandl BF et al.: Perfusion CT in acute ischemic stroke: a qualitative and quantitative comparison of deconvolution and maximum slope approach. AJNR Am. J. Neuroradiol. 31(9), 1690–1698 (2010).
- Eastwood JD, Lev MH, Azhari T et al.: CT perfusion scanning with deconvolution analysis: pilot study in patients with acute middle cerebral artery stroke. Radiology 222(1), 227–236 (2002).
- Hoeffner EG, Case I, Jain R et al.: Cerebral perfusion CT: technique and clinical applications. Radiology 231(3), 632–644 (2004).
- Kealey SM, Loving VA, Delong DM et al.: User-defined vascular input function curves: influence on mean perfusion parameter values and signal-to-noise ratio. Radiology 231(2), 587–593 (2004).
- Wintermark M, Lau BC, Chien J et al.: The anterior cerebral artery is an appropriate arterial input function for perfusion-CT processing in patients with acute stroke. Neuroradiology 50(3), 227–236 (2008).
- Sanelli PC, Lev MH, Eastwood JD et al.: The effect of varying user-selected input parameters on quantitative values in CT perfusion maps. Acad. Radiol. 11(10), 1085–1092 (2004).
- Ferreira RM, Lev MH, Goldmakher GV et al.: Arterial input function placement for accurate CT perfusion map construction in acute stroke. AJR Am. J. Roentgenol. 194(5), 1330–1336 (2010).
- Sasaki M, Kudo K, Ogasawara K et al.: Tracer delay-insensitive algorithm can improve reliability of CT perfusion imaging for cerebrovascular steno-occlusive disease: comparison with quantitative single-photon emission CT. AJNR Am. J. Neuroradiol. 30(1), 188–193 (2009).
- Calamante F, Gadian DG, Connelly A: Delay and dispersion effects in dynamic susceptibility contrast MRI: simulations using singular value decomposition. Magn. Reson. Med. 44(3), 466–473 (2000).
- Dankbaar JW, Rijsdijk M, van der Schaaf IC et al.: Relationship between vasospasm, cerebral perfusion, and delayed cerebral ischemia after aneurysmal subarachnoid hemorrhage. Neuroradiology 51(12), 813–819 (2009).
- Kivisaari RP, Salonen O, Servo A et al.: MR imaging after aneurysmal subarachnoid hemorrhage and surgery: a long-term follow-up study. AJNR Am. J. Neuroradiol. 22(6), 1143–1148 (2001).
- Wintermark M, Thiran JP, Maeder P et al.: Simultaneous measurement of regional cerebral blood flow by perfusion CT and stable xenon CT: a validation study. AJNR Am. J. Neuroradiol. 22(5), 905–914 (2001).
- Ziegelitz D, Starck G, Mikkelsen IK et al.: Absolute quantification of cerebral blood flow in neurologically normal volunteers: dynamicsusceptibility contrast MRI-perfusion compared with computed tomography (CT)-perfusion. Magn. Reson. Med. 62(1), 56–65 (2009).
- Koenig M, Klotz E, Luka B et al.: Perfusion CT of the brain: diagnostic approach for early detection of ischemic stroke. Radiology 209(1), 85–93 (1998).
- Klotz E, Konig M: Perfusion measurements of the brain: using dynamic CT for the quantitative assessment of cerebral ischemia in acute stroke. Eur. J. Radiol. 30(3), 170–184 (1999).
- Harrigan MR, Leonardo J, Gibbons KJ et al.: CT perfusion cerebral blood flow imaging in neurological critical care. Neurocrit. Care 2(3), 352–366 (2005).
- Dankbaar JW, de Rooij NK, Rijsdijk M et al.: Diagnostic threshold values of cerebral perfusion measured with computed tomography for delayed cerebral ischemia after aneurysmal subarachnoid hemorrhage. Stroke 41(9), 1927–1932 (2010).
- Wintermark M, Ko NU, Smith WS et al.: Vasospasm after subarachnoid hemorrhage: utility of perfusion CT and CT angiography on diagnosis and management. AJNR Am. J. Neuroradiol. 27(1), 26–34 (2006).
- Greenberg ED, Gold R, Reichman M et al.: Diagnostic accuracy of CT angiography and CT perfusion for cerebral vasospasm: a meta-analysis. AJNR Am. J. Neuroradiol. 31(10), 1853–1860 (2010).
- Dankbaar JW, de Rooij NK, Velthuis BK et al.: Diagnosing delayed cerebral ischemia with different CT modalities in patients with subarachnoid hemorrhage with clinical deterioration. Stroke 40(11), 3493–3498 (2009).
- Bandera E, Botteri M, Minelli C et al.: Cerebral blood flow threshold of ischemic penumbra and infarct core in acute ischemic stroke: a systematic review. Stroke 37(5), 1334–1339 (2006).
- Wintermark M, Flanders AE, Velthuis B et al.: Perfusion-CT assessment of infarct core and penumbra: receiver operating characteristic curve analysis in 130 patients suspected of acute hemispheric stroke. Stroke 37(4), 979–985 (2006).
- Schaefer PW, Roccatagliata L, Ledezma C et al.: First-pass quantitative CT perfusion identifies thresholds for salvageable penumbra in acute stroke patients treated with intra-arterial therapy. AJNR Am. J. Neuroradiol. 27(1), 20–25 (2006).
- Konstas AA, Goldmakher GV, Lee TY et al.: Theoretic basis and technical implementations of CT perfusion in acute ischemic stroke, part 2: technical implementations. AJNR Am. J. Neuroradiol. 30(5), 885–892 (2009).
- Kealey SM, Loving VA, Delong DM et al.: User-defined vascular input function curves: influence on mean perfusion parameter values and signal-to-noise ratio. Radiology 231(2), 587–593 (2004).
- Sen J, Belli A, Albon H et al.: Triple-H therapy in the management of aneurysmal subarachnoid haemorrhage. Lancet Neurol. 2(10), 614–621 (2003).
- Sanelli PC, Jou A, Gold R et al.: Using CT perfusion during the early baseline period in aneurysmal subarachnoid hemorrhage to assess for development of vasospasm. Neuroradiology DOI: 10.1007/s00234-010- 0752-z (2010) (Epub ahead of print).
- Reichman M, Gold R, Greenberg E et al.: Validation of a new reference standard for the diagnosis of vasospasm. Acad. Radiol. 17(9), 1083–1089 (2010).
- Reichman MB, Greenberg ED, Gold RL et al.: Developing patient-centered outcome measures for evaluating vasospasm in aneurysmal subarachnoid hemorrhage. Acad. Radiol. 16(5), 541–545 (2009).
• Discusses the timing of endovascular intervention in the treatment of vasospasm. The authors conclude that when a patient develops symptomatic vasospasm and is unresponsive to traditional measures of critical care management, angioplasty may be effective in improving the patient’s neurological status if this procedure is performed as early as possible. The results in this study indicate that a 2-h window may exist for restoration of blood flow to ultimately improve the patient’s outcome.
• • This publication by an expert multidisciplinary research group clarifies terminology related to vasospasm and delayed cerebral ischemia and proposes that in observational studies and clinical trials aiming to investigate strategies to prevent delayed cerebral ischemia, the two main outcome measures should be: cerebral infarction identified on CT, MRI or proven at autopsy, after exclusion of procedure-related infarctions; and functional outcome.
• Provides an excellent overview of the pathogenesis of cerebral vasospasm and of novel approaches used in basic and translational research.
• • This publication is a meta-analysis of the diagnostic performance of CT angiography and CT perfusion for vasospasm in aneurysmal subarachnoid hemorrhage (A-SAH) patients using digital subtraction angiography as the gold standard. The authors demonstrated high diagnostic accuracy for both CT angiography and CT perfusion, suggesting that they are potentially valuable techniques for vasospasm diagnosis in A-SAH patients.
• Supports the authors’ hypothesis that A-SAH patients who develop vasospasm may demonstrate early alterations in cerebral perfusion, with statistically significant cerebral blood flow reduction and mean transit time prolongation. Future clinical implications include using CT perfusion during the baseline period for early identification of A-SAH patients at high risk for vasospasm to prompt robust preventative measures and treatment.
• • Internal validation of a new reference standard for vasospasm diagnosis in A-SAH patients. This new reference standard is a combined standard based on a clinical practice approach using intensive clinical monitoring and serial imaging examinations.
