Review Article - Imaging in Medicine (2011) Volume 3, Issue 6
Parametric imaging of myocardial blood flow and viability using [15O]H2O and PET/CT
Hendrik J Harms1*, Marc C Huisman1, Paul Knaapen2, Adriaan A Lammertsma1 and Mark Lubberink1,3
1Department of Nuclear Medicine& PET Research, VU University Medical Center, Amsterdam, The Netherlands
2Department of Cardiology, VU University Medical Center, Amsterdam, The Netherlands
3PET centre, Uppsala University Hospital, Uppsala, Sweden
- *Corresponding Author:
- Hendrik J Harms
Department of Nuclear Medicine& PET Research
VU University Medical Center, Amsterdam
The Netherlands
Tel:+ 31 204 444 214
Fax: + 31 204 443 525
E-mail: h.harms@vumc.nl
Abstract
PET using [15O]H2O is a powerful tool for imaging coronary artery disease, being capable of quantifying myocardial blood flow and coronary flow reserve. Historically, its application in the clinic has remained limited due to technical and infrastructural difficulties and the lack of clinically useful images of myocardial blood flow. Recently, several of these difficulties have been overcome. This review provides a comparison of [15O]H2O with the other most widely used myocardial blood flow tracers, [13N]NH3 and 82Rb. In addition, an overview is given of tracer kinetic modeling of [15O]H2O data and of calculating parametric images of both myocardial blood flow and myocardial viability.
Keywords
[15O]H2O; coronary artery disease; myocardial blood flow; myocardial viability; parametric images; PET; PET/CT
PET is the unrivalled image modality to visualize and measure a wide range of (patho) physiological processes in vivo, depending on the positron emitting tracer being used. Its use in assessing regional myocardial blood flow (MBF) has been demonstrated [1–6], reforming noninvasive imaging of coronary artery disease (CAD). In contrast to SPECT, which is the clinical standard for qualitative assessment of MBF using 99mTc-sestamibi, PET is inherently quantitative due to the possibility of exact attenuation correction. PET can be used for both qualitative and quantitative studies of MBF due to its high temporal and spatial resolution and high reproducibility [7–9]. Indeed, MBF measured with [15O]H2O correlated well with MBF measured with microspheres on both 2D [1,2,10] and 3D [11] scanners, and the method has high reproducibility [9]. In addition, radiation burden of MBF imaging with PET is much lower compared with SPECT (0.5–10 vs 6–20 mSv) [12,13]. It has also been shown that PET is more cost effective in diagnosing CAD despite higher single scan costs [14], mainly due to its higher specificity. The specificity and sensitivity of 82Rb, the most widely used tracer, are 89 and 90% [15], respectively versus 53–76 and 80–84% for SPECT [16,17]. A recent study showed the excellent specificity and sensitivity of quantitative MBF measurements using [15O] H2O alone (92 and 95%, respectively, on a pervessel basis) and in combination with CT coronary angiography (99 and 93%, respectively, on a per-vessel basis) [18].
Several different tracers have been used for visualizing and quantifying MBF [1–4,15,19–21] of which [13N]NH3, 82Rb and [15O]H2O are the most widely used (Table 1). Their short half-lives enable MBF to be studied under both normal resting and pharmacologically induced stress conditions in the same scanning session. This is in contrast with for example, 18F-labeled tracers (half-life 110 min) [22], which require the patient to undergo PET scans on 2 days or protocols consisting of a single scan with dual injections, which may lead to associated errors in quantification of MBF. Introduction of hybrid PET/ CT scanners enables additional CT angiography and calcium scoring [15] in the same session, providing both functional and anatomical information for diagnosis of CAD [13].
Quantification of MBF using appropriate tracer kinetic models (Figure 1) has several benefits [23]. Its main advantage lies in the ability to diagnose patients with triple vessel disease or balanced CAD. These patients have a global reduction in MBF and qualitative studies may fail to uncover the disease or only select regions supplied by arteries with the most severe stenoses [24]. Quantification can also be used to exclude ischemia in symptomatic patients when heterogeneous but sufficiently high MBF values are found. Furthermore, absolute MBF can be used to calculate coronary flow reserve, defined as the ratio of stress and rest MBF, and coronary vascular resistance. These parameters may be of great clinical importance [24–29] and can also be used to study effects of interventions. In short, quantitative MBF measurements provide a wealth of information and diagnostic accuracy is expected to be higher than for qualitative analyses.
Despite these benefits, clinical use of quantitative cardiac PET has remained limited, mainly due to the difficulty of quantitative analysis and limited tracer availability. 13N, 15O and 82Rb have very short half-lives of 9.6 min, 122 s and 76 s, respectively, forcing on-site tracer production. Furthermore, kinetic analysis, required for quantification, can only be performed when specialized software is available and scan statistics of earlier generations of PET scanners were insufficient to calculate MBF on a voxel-by-voxel basis.
Recent developments, such as improvements in detector efficiency and electronics, development of advanced analysis software and introduction of 3D scanners and hybrid PET/CT systems have partially overcome these limitations, improving the feasibility of quantitative MBF imaging. Perfusion scans can now be combined with calcium scoring and CT angiography yielding complementary anatomical and functional information. Furthermore, introduction of CT attenuation correction decreases scan time and risk of patient motion between scans, increasing reliability of quantification. It should be noted, however, that slow CT rather than ‘snapshot’ CT scans are required, since both PET perfusion and slow CT scans are taken over several cardiac cycles, while ‘snapshot’ CT scans are not, leading to potential misalignment between PET and CT. Finally, the latest generation of PET/CT systems enable [15O]H2O scans with sufficient counting statistics to calculate parametric images of MBF and myocardial viability within only several minutes [30,31]. This review will first discuss advantages and disadvantages of [15O]H2O compared with other MBF tracers. Next, quantification of MBF using [15O]H2O on a voxel-by-voxel basis will be discussed.
Comparison of [15O]H2O with other MBF tracers
At present, there are three MBF tracers in common use (Table 1):

▪ [15O]H2O, which diffuses freely into and out of the myocardium;

Figure 1. Compartment model used for quantification of myocardial blood flow. For [15O]H2O and 82Rb, only K1 and k2 are used, while for [13N]NH3, k3 must be included.
▪ [13N]NH3, which rapidly diffuses into the myocardium where it becomes metabolically bound;
▪ The potassium analog 82Rb.
Initial results have shown that for diagnosing CAD, all three tracers have similar diagnostic accuracy: 92% for [15O]H2O [18] and 90% for 82Rb and [13N]NH3 [15], respectively. Although use of [15O]H2O in clinical practice has remained limited, it has several properties that make it the gold standard for noninvasive quantification of MBF. First and most importantly, [15O]H2O is freely diffusible with complete first pass extraction (Figure 2), even at the very high MBF levels commonly found in hyperemic conditions. In addition, [15O]H2O is metabolically inert. Therefore, changes in myocardial tissue concentrations are solely dependent on MBF and not on metabolic effects or extraction fractions, making quantification of MBF with [15O]H2O straightforward.

Figure 2. Relationship between K1 (extraction x MBF) and MBF for [15O]H2O, [13N]NH3 [33] and 82Rb [34]. For all tracers other than [15O]H2O, the relationship between K1 and MBF is nonlinear due to decreasing extraction. Without correction, perfusion is underestimated for these tracers. MBF: Myocardial blood flow.
In contrast to [15O]H2O, first pass extraction of [13N]NH3 and 82Rb is not complete. Uptake of [13N]NH3 in myocardium is by active transport or diffusion, while 82Rb is actively taken up into myocardium. This leads to an incomplete extraction for both tracers, although for [13N]NH3 extraction is still very high and linear over a wide range of MBF values. By contrast, first pass extraction of 82Rb is only around 65% and it decreases rapidly with increasing MBF (i.e., during pharmacologically induced stress) (Figure 2). Although correction factors [32–34] can be applied, they increase noise levels, especially for higher (stress) MBF values. Therefore, quantification of MBF using 82Rb has remained very limited.
The short half-life of 15O (122 s) enables fast protocols, including rest and pharmacologically induced stress scans with high patient throughput. Generally, after 5–10 half-lives, activity from the first scan is so low that it does not affect the second scan, enabling stress-rest protocols with a total duration of less than 30 min. Similar or even shorter protocol durations can be obtained with 82Rb due to its half-life of only 76 s, further increasing patient throughput. The half-life of [13N]NH3, however, is significantly longer (9.6 min), and hence protocol durations are increased. This greatly reduces patient throughput or poses a logistic challenge. At least, it decreases patient comfort due to the much longer total scan protocol than for [15O]H2O and 82Rb.
A unique feature of [15O]H2O is that MBF is calculated from tracer washout rather than uptake, since MBF is the only factor determining tracer washout. This has several implications. First, MBF calculated with [15O]H2O represents MBF in perfusable nonscar tissue. Since there is no or negligible uptake of [15O] H2O in scar tissue, measured washout rates are washout rates in perfusable tissue only. Hence, calculated MBF is MBF of perfusable (viable) tissue only. This enables calculation of the perfusable tissue fraction (PTF), the fraction of tissue in a region of interest (ROI) or voxel capable of rapidly exchanging water with the blood pool. In viable segments this results in an absolute correction for partial volume, whilst in (partially) nonviable segments this represents a measure for viability. It is important to note that this feature may lead to different estimates of MBF in nonviable segments compared with other MBF tracers, where MBF represents MBF as a mean for both viable and nonviable tissue. More of this feature will be described below
Another implication is that MBF, calculated from [15O]H2O scans, is relatively insensitive to misalignment between [15O]H2O and (CT) transmission scans [35]. Misalignment between emission and transmission data occurs in approximately 25% of all scans [36–43] and may lead to errors in absolute radioactivity concentrations. Washout rates, however, are insensitive to this mismatch and MBF values were found to be unaffected by misalignment between PET and CT. A recent study [44] showed that CT transmission scanning could even be omitted entirely and still provide accurate MBF values and parametric MBF images.
A drawback of both [15O]H2O and [13N]NH3 is that both isotopes require an on-site cyclotron for production, whilst 82Rb is obtained from an 82Sr/82Rb generator. Due to the short half-lives of 15O and 13N, the cyclotron must be located in close proximity to the PET scanner and this may lead to infrastructural challenges. The latter is especially true for [15O]H2O, which requires final production very near to the scanner in order to reduce radiation dose to staff. For 82Rb, specialized infusion systems [45] are available, enabling a direct connection between the generator and patient, reducing the dose to the staff, eliminating infrastructural difficulties and enabling rapid administration of the tracer. Bedside production and administration systems have also been developed for [15O]H2O, but they are not yet provided commercially.
Since [15O]H2O is freely diffusible, intravascular concentrations remain high and, consequently, there are no (qualitative) uptake images that can be used for quick visual analysis. Hence, quantification is required for analysis of [15O]H2O scans, increasing postprocessing time. Furthermore, signal-to-noise ratios are relatively lower due to the lack of active transport and/or trapping in tissue. While the need for quantification is not strictly a disadvantage of [15O]H2O, it has hampered widespread clinical use due to the increased postprocessing time required to obtain MBF images. In addition, with the previous generation of 2D PET scanners, signal-to-noise ratios were too low to allow for voxel-by-voxel calculations. [13N]NH3 and 82Rb both provide diagnostic images of the relative tracer distribution that can be used immediately after reconstruction for qualitative assessment of perfusion defects. Recent developments, however, enable rapid calculation of parametric (i.e., voxel-byvoxel) MBF images using [15O]H2O, as will be described below.
A drawback of 82Rb is the high energy (3.15 MeV) of the emitted positron, and hence the relatively long positron flight, compared with [15O]H2O and [13N]NH3 [46]. This can significantly degrade image quality and quantitative accuracy. Furthermore, 82Rb emits a photon in 14% of all decays, which may lead to further errors in quantification. Recently, a correction method for these prompt gammas has been proposed [47], but effects on quantification of MBF have not been reported.
Absolute quantification of MBF using [15O]H2O
Compartment model
Quantification of MBF is based on the model first proposed by Kety and Schmidt [48–50] for calculation of cerebral blood flow using nitrous oxide. Using conservation of mass and assuming that tracer distribution is instantly homogeneous within a compartment, for an inert and freely diffusable tracer, the change in tissue concentration in a region is equal to the difference in arterial and venous blood concentrations, multiplied by the amount of blood flowing through the region (MBF):
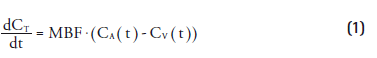
in which CT(t), CA(t) and CV(t) represent tracer concentrations in tissue, arterial and venous compartments, respectively. This equation can be rewritten, using the blood–tissue partition coefficient (p) and an additional parameter for the extraction (E) of the tracer:
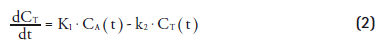
where K1 = E*MBF, k2 = E*MBF/p and p represents the blood–tissue partition coefficient of the tracer used. This differential equation can be solved and yields the basic equation for the single tissue compartment model used for quantification of MBF using [15O]H2O:
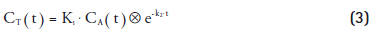
in which ⊗ denotes the convolution integral. The first study reporting on the use of [15O] H2O to assess MBF, compared [15O]H2O derived results with the gold standard (i.e., infusion of radiolabeled microspheres directly into a coronary artery) [1]. Using the method described above, a good correlation between both MBF estimates was found, validating the quantitative accuracy of [15O]H2O. Furthermore, it was confirmed that the extraction fraction of [15O]H2O was near complete (E = 1) and constant over a wide range of physiological MBF levels, proving that [15O]H2O is indeed a freely diffusible tracer that can be used to quantify MBF.
Corrections for partial volume effects & spill-over
One of the technical issues related to the heart is the relatively thin myocardial wall compared with the limited resolution of PET scanners. Activity concentrations in structures smaller than the resolution of the scanners are therefore underestimated. Therefore, only a fraction of the counts in an ROI or voxel originates from myocardial tissue, while the rest is due to spill-over, primarily from blood. For accurate quantification, it is important to correct for these effects. Several correction methods have been proposed, but these rely on the actual dimensions of the myocardial wall [51], which are not always known.
Iida et al. introduced an additional parameter, PTF, in the kinetic model of Equation 3 to correct for partial volume effects [2,3]. PTF represents the fraction of tissue within an ROI or voxel that is capable of rapidly exchanging [15O]H2O with blood (Figure 3). In order to prevent overdetermination of Equation 3, p needed to be fixed to a constant value of 0.91 ml∙g-1 [52]. Equation 3 was therefore modified into
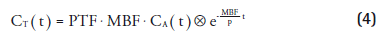

Figure 3. Volume of interest containing both perfusable and nonperfusable tissues. Due to spill-over and partial volume effects, VOI size is larger than total tissue size. Perfusable tissue fraction represents the fraction of viable tissue within the VOI, excluding nonperfusable scar tissue. Total anatomical tissue fraction represents the fraction of tissue within a VOI, including both perfusable and nonperfusable tissue.VOI: Volume of interest.Adapted from [57].
PTF was found to accurately correct for partial volume effects, yielding results that correlated well with those obtained with radiolabeled microspheres [10,53]. Furthermore, when ROI size increased, MBF remained constant and PTF decreased, indeed showing that MBF was insensitive to partial volume effects.
In addition to an exact correction for partial volume effects, introduction of PTF had another important implication. As MBF is calculated from the rate of washout of [15O]H2O from the myocardium rather than its rate of uptake, [15O] H2O is capable of distinguishing between regions with a low fraction of perfusable tissue (i.e., scar tissue) and regions with reduced MBF. In other words, pure infarction shows reduced PTF but normal MBF, while ischemia shows normal PTF but reduced MBF. More details are given in the ‘Perfusable tissue index’ section below.
Spill-over from blood into myocardium poses another challenge in absolute quantification of MBF. Especially when the tracer is injected as a bolus, a high spill-over contribution is present during the first pass of the bolus. Furthermore, the myocardium itself has a non-negligible blood volume. Several correction methods have been proposed. The first was to use an additional [15O]CO scan [2,54] and subtract this (scaled) scan from the [15O]H2O images. The result is an [15O]H2O image, free from intravascular activity, to which Equation 4 could be applied. However, there is a risk of motion between scans, which can reduce quantitative accuracy.
An alternative solution was developed by adding an additional parameter VA representing arterial blood volume and spill-over from the left ventricle [3,52,53] into the kinetic model. At first, no correction for venous blood volume was included in the model, as venous and tissue concentrations are similar, and hence can not be distinguished. However, spill-over from the right ventricle into the myocardium did affect obtained values of MBF and especially PTF [55,56]. Neglecting the early phase of [15O]H2O scans, in which spill-over from the right ventricle is most severe, yielded accurate MBF values in the septum, although PTF was overestimated [56]. To solve this issue, an additional parameter VRV to correct for spill-over from the right ventricle in the very early phase of the scans was incorporated and validated [55], leading to the final model of Equation 5:
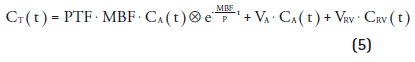
However it is important to note that since the concentrations of venous blood and perfusable tissue are similar, VRV only represents spill-over from the right ventricle (primarily determined during the first pass) and not venous blood volume. By contrast, VA represents both spillover from the left ventricle and actual arterial blood volume within the myocardium. Using VRV, both MBF and PTF values in the septum were no longer significantly different from other regions in the heart, indicating that the spill-over corrections were accurate. Nevertheless, actual venous blood volume is still included in PTF.
Perfusable tissue index
Shortly after its introduction as a correction for partial volume effects, it was suggested that PTF could also be used as a marker for myocardial viability [3]. In infarct regions, there was a discrepancy between PTF and extravascular density (later renamed to anatomical tissue fraction [ATF]), as PTF was reduced while ATF remained constant (Figure 3). This is due to the presence of nonperfusable tissue (i.e., necrotic tissue incapable of rapidly exchanging [15O] H2O with blood). The ratio of PTF and ATF, termed perfusable tissue index (PTI), was validated as a marker of myocardial viability [57] and is calculated using Equation 6:
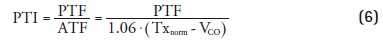
where Txnorm is a normalized transmission scan, VCO represents the blood volume fraction based on an [15O]CO scan and 1.06 represents the density of blood. In several studies [57–63] it was found that PTI could be used to predict functional recovery after treatment, showing a significantly reduced PTI in infarct regions compared with remote control regions. This was confirmed in a study where PTI was compared with ex vivo histochemical data in an animal model of myocardial infarction [64]. Furthermore, it was shown that dysfunctional tissue (i.e., tissue with low MBF but preserved PTI at rest) was capable of regaining its contractility, in contrast to dysfunctional tissue with reduced PTI. PTI in the septum was, however, significantly higher than in other regions due to spill-over from the right ventricle.
Despite these results, clinical use of PTI has remained controversial since it was shown in a simulation study that heterogeneity in MBF, as commonly found in infarct regions, resulted in a negative bias in PTI [65]. Furthermore, the requirement of an additional [15O]CO scan has made routine application of PTI impractical. A recent study [31] showed that PTI could also be calculated using fitted blood volume fractions based on [15O]H2O scans (i.e., VA and VRV in Equation 5) instead of an additional [15O]CO scan:
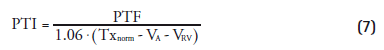
This enabled simultaneous assessment of both MBF and myocardial viability using just a [15O]H2O scan.
Input functions
In order to solve the compartment model underlying Equations 3–5, it is imperative to measure the arterial input function CA(t) accurately. The gold standard for obtaining CA(t) is arterial sampling with an on-line blood sampler [2]. However, a blood curve obtained with arterial sampling has to be corrected for dispersion and delay, introducing additional uncertainties in quantification. Additionally, arterial cannulation is required, which can be a burden to the patient and is less suitable for routine clinical use. For clinical applicability, noninvasive alternatives have to be found. In a direct comparison with arterial sampling [52], the use of CA(t) obtained directly from the PET scan itself by extracting the time–activity curve of the left atrium, left ventricle or aorta (image-derived input function [IDIF]) was validated. The blood pool was visualized using [15O]CO on which an ROI was drawn. This region was then transferred to the [15O]H2O images and CA(t) was extracted. However, CA(t) was overestimated due to spillover from the myocardium. A method to correct for this spill-over was presented [66], enabling more accurate and noninvasive quantification of MBF using [15O]H2O.
However, there were still some issues with IDIF, especially considering the administration protocol, which greatly influences IDIF. When [15O]H2O was injected as a bolus on older scanners, the high count rates commonly found in the early phase of a scan caused a large loss of sensitivity due to detector dead time. An alternative method of administering [15O]H2O was implemented using [15O]CO2 inhalation [10,53]. [15O]CO2 is rapidly converted into [15O]H2O in the lungs and, therefore, inhalation of [15O]CO2 is similar to an infusion of [15O]H2O and high count rates in the early phase of the scan are avoided. The method provided MBF values similar to those obtained with microspheres when using an IDIF from the left atrium, showing both the feasibility of the administration protocol and the validity of IDIF. However, it was expected that quantification of MBF and PTF in the septum would be inaccurate due to the complex spill-over from both left and right ventricles. This was later confirmed in a study in which bolus injection, slow infusion and inhalation of [15O]CO2 were compared [56]. Blood volume in the septum was underestimated using [15O]CO2 inhalation whilst PTF was significantly higher than in other regions due to right-ventricular spill-over. Furthermore, PTF, and consequently PTI, showed a large bias in the septum. Results obtained with arterial sampling and bolus injection were the most reproducible, when the early phase was neglected, but slow infusion provided the most reproducible noninvasive results. When PTF and PTI were of interest, the use of [15O]CO2 was not recommended. Another study several years later showed that IDIF was also feasible with bolus injection [55]. In this study, the early phase was not neglected as count rate capabilities of the scanner used were sufficient to accurately measure the early phase. Furthermore, introduction of right-ventricular spill-over correction, as mentioned above, enabled accurate fitting of the early phase in the septum.
The introduction of 3D PET scanners and new detector materials improved sensitivity and count rate capabilities of PET scanners, yielding a statistical advantage over conventional 2D scanners [67]. A validation study using a 3D PET scanner [11] showed that, even with bolus injection and using the early phase of the scan, accurate MBF results could be obtained.
Automatic definition of input functions
In the first studies using IDIF, ROI were drawn manually on a blood pool image obtained with [15O]CO. This is labor intensive, observer dependent, sensitive to motion between scans and it requires an additional [15O]CO scan. Hence, obtaining IDIF from the [15O]H2O scan itself is preferred, for which a number of automated techniques [68–74] became available, extracting underlying time-activity curves automatically from dynamic data. Feasibility of extracting IDIF using these techniques was shown for [15O]H2O [75–77], eliminating the need for an additional [15O]CO scan for manual ROI definition. This reduced analysis time considerably. In a recent study [30] several of these techniques were compared in a clinical setting, showing the feasibility of these techniques for rapid analysis of [15O]H2O scans.
Parametric imaging
The lack of clinically useful uptake images has remained a major drawback of [15O]H2O and has limited its clinical use. Manual definition of heart segments is labor intensive, observer dependent and all information regarding flow heterogeneity within a segment is lost. Furthermore, it has been shown that f low heterogeneity, commonly seen in infarcted regions, may result in negative bias in PTI [65]. To overcome these issues, it is desirable to calculate MBF (Figures 4–7) and PTI (Figure 8) for each voxel, yielding parametric images of MBF and PTI at the highest possible resolution. Parametric images can be used for both visual assessment of regional MBF and for quantification of MBF, as they are inherently quantitative. Finally, information regarding flow heterogeneity is retained in parametric images.

Figure 4. Parametric myocardial blood flow images at (A) rest and (B) stress for a patient without perfusion abnormalities.

Figure 5. Parametric myocardial blood flow images at (A) rest and (B) stress for a patient with a perfusion abnormality in the antero-septal region. Color scales are equal to those in Figure 4.

In order to calculate parametric images, Equation 5 has to be solved for every voxel in a dynamic scan. Typical image sizes are, for example, 144 × 144 × 45 or 128 × 128 × 63 voxels, resulting in 933,120 and 1,032,192 voxels, respectively. The gold standard for fitting Equation 5 is nonlinear least square regression. However, this is computationally demanding and therefore not feasible for such large numbers of voxels. Furthermore, voxel noise levels are high and nonlinear least square regression is sensitive to noise, resulting in noisy images of low quality.
Basis function implementation in calculation of parametric MBF images
Several methods [78–82] have been developed for rapid calculation of parametric images. The most commonly used method is the basis function method, originally developed by Gunn et al. [81], which has been used for a variety of tracers, including [15O]H2O, both in oncology [83,84] and cardiology [30,80,82]. In this method, the nonlinear term of Equation 5 is predefined for a range of MBFi values using:
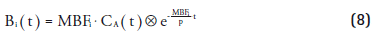
This can be substituted in Equation 5, yielding:
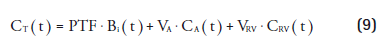
For each predefined value MBFi Equation 9 is linear, which can be solved with high computational speed. For each voxel, the MBFi value that provided the best fit is entered in the parametric MBF image together with its corresponding PTF, VA and VRV values (Figures 4 & 8). It was shown that basis function method had favorable noise properties compared to nonlinear least square regression [80] and that parametric images of diagnostic quality could be obtained [30].
Parametric PTI images
Generating parametric PTI images has long been impractical because of the need to align transmission, [15O]CO and [15O]H2O scans. The high risk of misalignment (patient movement), added to the cumbersome scanning protocol, has limited the use of PTI in general and ruled out parametric imaging of PTI. A recent study [31], however, showed that arterial and venous blood volume and spill-over fractions, obtained directly from a [15O]H2O scan, could be used as an alternative for [15O]CO in both an animal model and in patients with ischemic cardiomyopathy. Using low-dose CT scans instead of traditional transmission scans further reduced the time required for measurement of PTI. Furthermore, PTI could be calculated directly using only a single [15O]H2O PET/CT scan. Since parametric images of PTF and blood volume fractions are also obtained during calculation of parametric MBF images, this enabled calculation of parametric PTI images in addition to MBF images, enabling simultaneous assessment of MBF and viability on a voxel level (Figure 8).

Figure 7. Parametric myocardial blood flow images at (A) rest and (B) stress for a patient with severe ischemic cardiomyopathy and an old myocardial infarction in the anterior wall. Myocardial blood flow is reduced globally during stress and, at rest, also in the anterior region, indicative of a myocardial infarction with reduced perfusion reserve in the remainder of the myocardium.
Discussion
Direct comparison of [15O]H2O with 82Rb & [13N]NH3
A limited number of studies compared quantification of MBF using [15O]H2O with [13N]NH3 or 82Rb. One recent study [85] compared quantification of MBF with [15O]H2O and 82Rb in smokers and healthy controls during rest and cold pressor testing. A poor agreement was found (intraclass correlation coefficient of 0.48), indicating that quantification using 82Rb remains difficult. For [13N]NH3, more studies have been performed. One study [8] compared both [13N]NH3 and [15O] H2O with the microsphere technique in dogs and found that both methods correlated highly with microsphere-derived flow values. Correlation of MBF measured with [13N]NH3 and [15O]H2O, however, was not reported. Another study [86] compared [13N]NH3 and [15O]H2O in humans, showing excellent correlation and no significant differences in MBF in healthy volunteers (y = 0.02 + 1.02x; r = 0.99) over a wide range of MBF values. In a different study [87] only including patients with chronic ischemic cardiomyopathy, however, no correlation was found between [15O]H2O- and [13N]NH3-based MBF values. A possible explanation is that scar tissue could be present in dysfunctional tissue. Taking this into account by multiplying [15O]H2O-based MBF with PTI, a significant, although poor, correlation was found in these segments. It has to be noted, however, that these direct comparisons were performed on previous generation scanners with low signal-to-noise ratios, which can have a major impact on precision of quantification of MBF, reducing correlation between obtained results.
Future developments Implementation of time of flight in routine generation of parametric MBF images
Introduction of new detector materials and improvements in detector timing resolution have enabled implementation of time of flight (TF) information in standard reconstruction protocols on state-of-the-art scanners [88]. In a number of studies, the benefits of TF reconstructions on image quality [89–91] and tumor-detection [92–95] have been shown. These studies have demonstrated improved image quality or similar image quality with lower injected dose.
Although the benefits of TF on image quality are clear, the benefits cannot be translated directly to parametric image quality. Since parametric images are calculated from dynamic images, accuracy of fits rather than myocardiumto- background ratios or detection rates should be improved in order to increase parametric image quality. However, TF should improve signal-tonoise ratios as well, which in turn should lead to more accurate fits, and hence to increased parametric image quality. The real benefit of TF, however, needs to be determined in a direct comparison.
Application of cardiac & respiratory gating

Figure 8.Parametric images of (A) perfusable tissue fraction, (B) total blood volume (VA+VRV), (C) perfusable tissue index and (D) anatomical tissue fraction for the patient shown in Figure 4.
Although perfusable tissue fraction corrects for cardiac motion-induced partial volume effects, parametric images are still blurred due to cardiac and respiratory motion. Furthermore, differentiating between endocardial and epicardial MBF is difficult without cardiac gating, but it may yield important diagnostic information. To date, signal-to-noise ratios have been insufficient in order to apply cardiac or respiratory gating to dynamic studies, although it has not been studied on state-of-the-art PET/CT scanners. Motion freezing techniques [96,97] have been proposed to improve signal-to-noise ratios in gated myocardial perfusion studies. Ideally, this should enable dual-gated PET for dynamic studies rather than for static studies [98–100] only, yielding nonblurred images of MBF. However, motion freezing requires clearly defined borders of the myocardium, which are difficult to obtain in dynamic [15O]H2O images.
Optimization of energy & coincidence windows for dynamic scanning
The current generation of PET and PET/CT scanners is optimized for whole body oncological studies, in which the range of count rates is limited. Energy and coincidence windows were chosen for optimal sensitivity. In dynamic studies, required for parametric imaging of MBF, the range of count rates is much broader and a different trade-off between sensitivity and counting capabilities could be made.
Optimizing the coincidence window for higher count rates may decrease the large number of random coincidences, while sensitivity should remain similar or decrease only slightly. This is expected to decrease dead-times at higher count rates, which is likely to improve quantitative accuracy. A similar rationale may be used for the energy window, where the scatter fraction may be reduced at the expense of a slightly lower sensitivity.
Routine implementation of [15O]H2O & costs
Generally, 82Rb is preferred in clinical use due to its ease of production and the fact that no large initial investments have to be made. The 82Sr/82Rb generator is commercially supplied and replenished every 28 days with new cyclotron-produced 82Sr. At present, costs are approximately €20,000 per 28 days. Use of [15O]H2O or [13N]NH3 requires large initial investments because of the installation of a cyclotron. However, once a cyclotron is available, additional costs for staff are minimal since production of both tracers requires minimal intervention and can be performed by a single nuclear medicine technologist. Moreover, additional tracer production costs per patient are very limited. At a facility with high patient throughput a cyclotron can generate enough [15O]H2O or [13N]NH3 to utilize more than one scanner, while an 82Rb generator can not. Furthermore, a cyclotron opens the possibility to produce a much wider range of PET tracers, which otherwise have to be purchased ([18F]FDG) or are not available at all (any 11C-labeled tracer). The costs of an on-site standard PET cyclotron are around €2 million with a similar amount for maintenance costs over a period of 10 years. Acquiring a cyclotron solely for generation of [15O]H2O or [13N]NH3 on a single scanner may therefore not be cost effective in comparison with 82Rb. On the other hand, a standard PET cyclotron, producing protons with energies above 9 MeV, is not necessary for production of [15O]H2O since it can be produced using 3 MeV deuterons [101]. If a small, self-shielded low-energy deuteron cyclotron specifically for production of [15O]H2O would be available, it could considerably reduce initial investment as well as maintenance costs and result in competitive overall per-patient costs.
Future perspective
In a limited number of centers, [15O]H2O is routinely used for clinical assessment of myocardial blood flow. Only recently, its excellent diagnostic accuracy has been demonstrated. Practical considerations, such as the requirement of an on-site cyclotron, its relatively low signal-to-noise ratio and the lack of qualitative uptake images that are proportional to flow, have hampered widespread use of [15O]H2O. However, several of these issues have recently been overcome. Within a few minutes [30,31], parametric MBF and PTI images of diagnostic quality can be obtained as alternatives to qualitative uptake images, with the obvious additional advantage of yielding quantitative MBF rather than radioactivity concentrations. Furthermore, introduction of small, self-shielded cyclotrons dedicated to the production of 15O (low energy) should overcome one of the major limitations of [15O]H2O, namely costs of production and availability. Finally, only recently, it has been demonstrated that the diagnostic accuracy of [15O]H2O [18] is similar to that of the more commonly used qualitative tracers 82Rb and [13N]NH3. These factors may increase routine clinical applicability of this tracer, which is superior for absolute quantification of myocardial blood flow, although the actual clinical benefit of quantitative MBF imaging remains to be determined.
Financial & competing interests disclosure
This work was supported in part by a research grant from Philips Healthcare. The authors have no other relevant affiliations or financial involvement with any organization or entity with a financial interest in or financial conflict with the subject matter or materials discussed in the manuscript apart from those disclosed.
No writing assistance was utilized in the production of this manuscript.
References
Papers of special note have been highlighted as:
* of interest
* of considerable interest
- Bergmann SR, Fox KA, Rand AL et al. Quantification of regional myocardial blood flow in vivo with H2 15O. Circulation 70(4), 724–733 (1984).
- Iida H, Kanno I, Takahashi A et al. Measurement of absolute myocardial blood flow with H2 15O and dynamic positronemission tomography. Strategy for quantification in relation to the partial-volume effect. Circulation 78(1), 104–115 (1988). & Paper introducing the correction of the partial volume effect, required for accurate quantification of myocardial blood flow (MBF) using [15O]H2O.
- Iida H, Rhodes CG, De SR et al. Myocardial tissue fraction – correction for partial volume effects and measure of tissue viability. J. Nucl. Med. 32(11), 2169–2175 (1991).
- Schelbert HR, Phelps ME, Huang SC et al. N-13 ammonia as an indicator of myocardial blood flow. Circulation 63(6), 1259–1272 (1981).
- Selwyn AP, Allan RM, L’Abbate A et al. Relation between regional myocardial uptake of rubidium-82 and perfusion: absolute reduction of cation uptake in ischemia. Am. J. Cardiol. 50(1), 112–121 (1982).
- Herrero P, Markham J, Shelton ME, Bergmann SR. Implementation and evaluation of a two-compartment model for quantification of myocardial perfusion with rubidium-82 and positron emission tomography. Circ. Res. 70(3), 496–507 (1992).
- El Fakhri G, Kardan A, Sitek A et al. Reproducibility and accuracy of quantitative myocardial blood flow assessment with 82Rb PET: comparison with 13N-ammonia PET. J. Nucl. Med. 50(7), 1062–1071 (2009).
- Bol A, Melin JA, Vanoverschelde JL et al. Direct comparison of [13N] ammonia and [15O] water estimates of perfusion with quantification of regional myocardial blood flow by microspheres. Circulation 87(2), 512–525 (1993).
- Kaufmann PA, Gnecchi-Ruscone T, Yap JT, Rimoldi O, Camici PG. Assessment of the reproducibility of baseline and hyperemic myocardial blood flow measurements with 15O-labeled water and PET. J. Nucl. Med. 40(11), 1848–1856 (1999).
- Araujo LI, Lammertsma AA, Rhodes CG et al. Noninvasive quantification of regional myocardial blood flow in coronary artery disease with oxygen-15-labeled carbon dioxide inhalation and positron emission tomography. Circulation 83(3), 875–885 (1991).
- Schafers KP, Spinks TJ, Camici PG et al. Absolute quantification of myocardial blood flow with H2 15O and 3-dimensional PET: an experimental validation. J. Nucl. Med. 43(8), 1031–1040 (2002).
- Einstein AJ, Moser KW, Thompson RC, Cerqueira MD, Henzlova MJ. Radiation dose to patients from cardiac diagnostic imaging. Circulation 116(11), 1290–1305 (2007).
- Knaapen P, de Haan S, Hoekstra OS et al. Cardiac PET-CT: advanced hybrid imaging for the detection of coronary artery disease. Neth. Heart J. 18(2), 90–98 (2010).
- Merhige ME, Breen WJ, Shelton V, Houston T, D’Arcy BJ, Perna AF. Impact of myocardial perfusion imaging with PET and 82Rb on downstream invasive procedure utilization, costs, and outcomes in coronary disease management. J. Nucl. Med. 48(7), 1069–1076 (2007).
- Di Carli MF, Hachamovitch R. New technology for noninvasive evaluation of coronary artery disease. Circulation 115(11), 1464–1480 (2007). & Review summarizing the benefits of hybrid PET/CT imaging in the assessment of coronary artery disease.
- Stewart RE, Schwaiger M, Molina E et al. Comparison of rubidium-82 positron emission tomography and thallium-201 SPECT imaging for detection of coronary artery disease. Am. J. Cardiol. 67(16), 1303–1310 (1991).
- Go RT, Marwick TH, MacIntyre WJ et al. A prospective comparison of rubidium-82 PET and thallium-201 SPECT myocardial perfusion imaging utilizing a single dipyridamole stress in the diagnosis of coronary artery disease. J. Nucl. Med. 31(12), 1899–1905 (1990).
- Kajander S, Joutsiniemi E, Saraste M et al. Cardiac positron emission tomography/ computed tomography imaging accurately detects anatomically and functionally significant coronary artery disease. Circulation 122(6), 603–613 (2010). & First study showing the excellent diagnostic accuracy of quantitative assessment of MBF combined with CT coronary angiography.
- Herrero P, Hartman JJ, Green MA et al. Regional myocardial perfusion assessed with generator-produced copper-62-PTSM and PET. J. Nucl. Med. 37(8), 1294–1300 (1996).
- Melon PG, Brihaye C, Degueldre C et al. Myocardial kinetics of potassium-38 in humans and comparison with copper-62- PTSM. J. Nucl. Med. 35(7), 1116–1122 (1994).
- Madar I, Ravert HT, Du Y et al. Characterization of uptake of the new PET imaging compound 18F-fluorobenzyl triphenyl phosphonium in dog myocardium. J. Nucl. Med. 47(8), 1359–1366 (2006).
- Higuchi T, Nekolla SG, Huisman MM et al. A new 18F-labeled myocardial PET tracer: myocardial uptake after permanent and transient coronary occlusion in rats. J. Nucl. Med. 49(10), 1715–1722 (2008).
- Knuuti J, Kajander S, Maki M, Ukkonen H. Quantification of myocardial blood flow will reform the detection of CAD. J. Nucl. Cardiol. 16(4), 497–506 (2009). & Summarizes the potential benefits of absolute quantification of MBF in the diagnosis of coronary artery disease.
- Parkash R, deKemp RA, Ruddy TD et al. Potential utility of rubidium 82 PET quantification in patients with 3-vessel coronary artery disease. J. Nucl. Cardiol. 11(4), 440–449 (2004).
- Walsh MN, Geltman EM, Steele RL et al. Augmented myocardial perfusion reserve after coronary angioplasty quantified by positron emission tomography with H2 15O. J. Am. Coll. Cardiol. 15(1), 119–127 (1990).
- Cecchi F, Olivotto I, Gistri R, Lorenzoni R, Chiriatti G, Camici PG. Coronary microvascular dysfunction and prognosis in hypertrophic cardiomyopathy. N. Engl. J. Med. 349(11), 1027–1035 (2003).
- Uren NG, Melin JA, De BB, Wijns W, Baudhuin T, Camici PG. Relation between myocardial blood flow and the severity of coronary-artery stenosis. N. Engl. J. Med. 330(25), 1782–1788 (1994).
- Dayanikli F, Grambow D, Muzik O, Mosca L, Rubenfire M, Schwaiger M. Early detection of abnormal coronary flow reserve in asymptomatic men at high risk for coronary artery disease using positron emission tomography. Circulation 90(2), 808–817 (1994).
- Czernin J, Muller P, Chan S et al. Influence of age and hemodynamics on myocardial blood flow and flow reserve. Circulation 88(1), 62–69 (1993).
- Harms HJ, Knaapen P, de Haan S, Halbmeijer R, Lammertsma AA, Lubberink M. Automatic generation of absolute myocardial blood flow images using [(15)O]H (2)O and a clinical PET/CT scanner. Eur. J. Nucl. Med. Mol. Imaging 38(5), 930–939 (2011).
- Harms HJ, de HS, Knaapen P, Allaart CP, Lammertsma AA, Lubberink M. Parametric images of myocardial viability using a single 15O-H2O PET/CT scan. J. Nucl. Med. 52(5), 745–749 (2011). CO2nn Presents a method to simultaneously assess MBF and viability on the voxel level from a single [15O]H2O scan.
- Yoshida K, Mullani N, Gould KL. Coronary flow and flow reserve by PET simplified for clinical applications using rubidium-82 or nitrogen-13-ammonia. J. Nucl. Med. 37(10), 1701–1712 (1996).
- Nienaber CA, Ratib O, Gambhir SS et al. A quantitative index of regional blood flow in canine myocardium derived noninvasively with N-13 ammonia and dynamic positron emission tomography. J. Am. Coll. Cardiol. 17(1), 260–269 (1991).
- Lortie M, Beanlands RS, Yoshinaga K, Klein R, Dasilva JN, deKemp RA. Quantification of myocardial blood flow with 82Rb dynamic PET imaging. Eur. J. Nucl. Med. Mol. Imaging 34(11), 1765–1774 (2007).
- Bakker EDM, Harms HJ, Raijmakers PGHM et al. Motion-induced PET-CT misalignment does not affect absolute myocardial blood flow as measured with 15O-water. Eur. J. Nucl. Med. Mol. Imaging 37(Suppl. 2), S202 (2011).
- Schuster DM, Halkar RK, Esteves FP et al. Investigation of emission-transmission misalignment artifacts on rubidium-82 cardiac PET with adenosine pharmacologic stress. Mol. Imaging Biol. 10(4), 201–208 (2008).
- Slomka PJ, Le ML, Hayes SW et al. Comparison of myocardial perfusion 82Rb PET performed with CT- and transmission CT-based attenuation correction. J. Nucl. Med. 49(12), 1992–1998 (2008).
- Souvatzoglou M, Bengel F, Busch R et al. Attenuation correction in cardiac PET/CT with three different CT protocols: a comparison with conventional PET. Eur. J. Nucl. Med. Mol. Imaging 34(12), 1991–2000 (2007).
- Martinez-Moller A, Souvatzoglou M, Navab N, Schwaiger M, Nekolla SG. Artifacts from misaligned CT in cardiac perfusion PET/CT studies: frequency, effects, and potential solutions. J. Nucl. Med. 48(2), 188–193 (2007).
- Loghin C, Sdringola S, Gould KL. Common artifacts in PET myocardial perfusion images due to attenuation-emission misregistration: clinical significance, causes, and solutions. J. Nucl. Med. 45(6), 1029–1039 (2004).
- Andersson JL, Vagnhammar BE, Schneider H. Accurate attenuation correction despite movement during PET imaging. J. Nucl. Med. 36(4), 670–678 (1995).
- Alessio AM, Kohlmyer S, Branch K, Chen G, Caldwell J, Kinahan P. Cine CT for attenuation correction in cardiac PET/CT. J. Nucl. Med. 48(5), 794–801 (2007).
- McCord ME, Bacharach SL, Bonow RO, Dilsizian V, Cuocolo A, Freedman N. Misalignment between PET transmission and emission scans: its effect on myocardial imaging. J. Nucl. Med. 33(6), 1209–1214 (1992).
- Lubberink M, Harms HJ, Halbmeijer R, de Haan S, Knaapen P, Lammertsma AA. Low-dose quantitative myocardial blood flow imaging using 15O-water and PET without attenuation correction. J. Nucl. Med. 51(4), 575–580 (2010).
- Klein R, Adler A, Beanlands RS, deKemp RA. Precision-controlled elution of a 82Sr/82Rb generator for cardiac perfusion imaging with positron emission tomography. Phys. Med. Biol. 52(3), 659–673 (2007).
- Sanchez-Crespo A, Andreo P, Larsson SA. Positron flight in human tissues and its influence on PET image spatial resolution. Eur. J. Nucl. Med. Mol. Imaging 31(1), 44–51 (2004).
- Esteves FP, Nye JA, Khan A et al. Promptgamma compensation in Rb-82 myocardial perfusion 3D PET/CT. J. Nucl. Cardiol. 17(2), 247–253 (2010).
- Kety SS, Schmidt G. The determination of cerebral blood flow in man by the use of nitrous oxide in low concentrations. Am. J. Physiol. 143, 53–66 (1945).
- Kety SS, Schmidt CF. The nitrous oxide method for the quantitative determination of cerebral blood flow in man; theory, procedure and normal values. J. Clin. Invest. 27(4), 476–483 (1948).
- Kety SS. The theory and applications of the exchange of inert gas at the lungs and tissues. Pharmacol. Rev. 3(1), 1–41 (1951).
- Wisenberg G, Schelbert HR, Hoffman EJ et al. In vivo quantitation of regional myocardial blood flow by positron-emission computed tomography. Circulation 63(6), 1248–1258 (1981).
- Bergmann SR, Herrero P, Markham J, Weinheimer CJ, Walsh MN. Noninvasive quantitation of myocardial blood flow in human subjects with oxygen-15-labeled water and positron emission tomography. J. Am. Coll. Cardiol. 14(3), 639–652 (1989).
- Lammertsma AA, De SR, Araujo LI, Jones T. Measurement of regional myocardial blood flow using C15O2 and positron emission tomography: comparison of tracer models. Clin. Phys. Physiol. Meas. 13(1), 1–20 (1992).
- Huang SC, Schwaiger M, Carson RE et al. Quantitative measurement of myocardial blood flow with oxygen-15 water and positron computed tomography: an assessment of potential and problems. J. Nucl. Med. 26(6), 616–625 (1985).
- Hermansen F, Rosen SD, Fath-Ordoubadi F et al. Measurement of myocardial blood flow with oxygen-15 labelled water: comparison of different administration protocols. Eur. J. Nucl. Med. 25(7), 751–759 (1998).
- Iida H, Takahashi A, Tamura Y, Ono Y, Lammertsma AA. Myocardial blood flow: comparison of oxygen-15-water bolus injection, slow infusion and oxygen-15-carbon dioxide slow inhalation. J. Nucl. Med. 36(1), 78–85 (1995).
- Yamamoto Y, De SR, Rhodes CG et al. A new strategy for the assessment of viable myocardium and regional myocardial blood flow using 15O-water and dynamic positron emission tomography. Circulation 86(1), 167–178 (1992). & Paper presents a method to assess myocardial viability using [15O]H2O.
- De Silva R, Yamamoto Y, Rhodes CG et al. Preoperative prediction of the outcome of coronary revascularization using positron emission tomography. Circulation 86(6), 1738–1742 (1992).
- Itoh H, Namura M, Seki H et al. Perfusable tissue index obtained by positron emission tomography as a marker of myocardial viability in patients with ischemic ventricular dysfunction. Circ. J. 66(4), 341–344 (2002).
- Knaapen P, Boellaard R, Gotte MJ et al. The perfusable tissue index: a marker of myocardial viability. J. Nucl. Cardiol. 10(6), 684–691 (2003).
- Knaapen P, Boellaard R, Gotte MJ et al. Perfusable tissue index as a potential marker of fibrosis in patients with idiopathic dilated cardiomyopathy. J. Nucl. Med. 45(8), 1299–1304 (2004).
- Knaapen P, van Dockum WG, Bondarenko O et al. Delayed contrast enhancement and perfusable tissue index in hypertrophic cardiomyopathy: comparison between cardiac MRI and PET. J. Nucl. Med. 46(6), 923–929 (2005).
- Knaapen P, Bondarenko O, Beek AM et al. Impact of scar on water-perfusable tissue index in chronic ischemic heart disease: Evaluation with PET and contrast-enhanced MRI. Mol. Imaging Biol. 8(4), 245–251 (2006).
- Iida H, Tamura Y, Kitamura K, Bloomfield PM, Eberl S, Ono Y. Histochemical correlates of 15O-water-perfusable tissue fraction in experimental canine studies of old myocardial infarction. J. Nucl. Med. 41(10), 1737–1745 (2000).
- Herrero P, Staudenherz A, Walsh JF, Gropler RJ, Bergmann SR. Heterogeneity of myocardial perfusion provides the physiological basis of perfusable tissue index. J. Nucl. Med. 36(2), 320–327 (1995).
- Iida H, Rhodes CG, De SR et al. Use of the left ventricular time-activity curve as a noninvasive input function in dynamic oxygen-15-water positron emission tomography. J. Nucl. Med. 33(9), 1669–1677 (1992).
- Bailey DL, Miller MP, Spinks TJ et al. Experience with fully 3D PET and implications for future high-resolution 3D tomographs. Phys. Med. Biol. 43(4), 777–786 (1998).
- Ashburner J, Haslam J, Taylor C, Cunningham VJ, Jones T. A cluster analysis approach for the characterisation of dynamic PET data. In: Quantification of Brain Function Using PET. Academic Press, 301–306 (1996)
- Barber DC. The use of principal components in the quantitative analysis of gamma camera dynamic studies. Phys. Med. Biol. 25(2), 283–292 (1980).
- Bruyant PP, Sau J, Mallet JJ. Noise removal using factor analysis of dynamic structures: application to cardiac gated studies. J. Nucl. Med. 40(10), 1676–1682 (1999).
- Di Paola R, Bazin JP, Aubry F et al. Handling of dynamic sequences in nuclear medicine. IEEE Trans. Nucl. Imaging 29(4), 1310–1321 (1982).
- Hermansen F , Lammertsma AA. Linear dimension reduction of sequences of medical images: I. Optimal inner products. Phys. Med. Biol. 40(11), 1909–1920 (1995).
- Hermansen F, Bloomfield PM, Ashburner J, Camici PG, Lammertsma AA. Linear dimension reduction of sequences of medical images: II. Direct sum decomposition. Phys. Med. Biol. 40(11), 1921–1941 (1995).
- Hermansen F, Lammertsma AA. Linear dimension reduction of sequences of medical images: III. Factor analysis in signal space. Phys. Med. Biol. 41(8), 1469–1481 (1996).
- Ahn JY, Lee DS, Lee JS et al. Quantification of regional myocardial blood flow using dynamic H2 15O PET and factor analysis. J. Nucl. Med. 42(5), 782–787 (2001).
- Hermansen F, Ashburner J, Spinks TJ, Kooner JS, Camici PG, Lammertsma AA. Generation of myocardial factor images directly from the dynamic oxygen-15-water scan without use of an oxygen-15-carbon monoxide blood-pool scan. J. Nucl. Med. 39(10), 1696–1702 (1998).
- Lee JS, Lee DS, Ahn JY et al. Blind separation of cardiac components and extraction of input function from H2 15O dynamic myocardial PET using independent component analysis. J. Nucl. Med. 42(6), 938–943 (2001).
- Lee JS, Lee DS, Ahn JY et al. Generation of parametric image of regional myocardial blood flow using H2 15O dynamic PET and a linear least-squares method. J. Nucl. Med. 46(10), 1687–1695 (2005).
- Lee JS, Lee DS, Ahn JY et al. Parametric image of myocardial blood flow generated from dynamic H2 15O PET using factor analysis and cluster analysis. Med. Biol. Eng. Comput. 43(5), 678–685 (2005).
- Boellaard R, Knaapen P, Rijbroek A, Luurtsema GJ, Lammertsma AA. Evaluation of basis function and linear least squares methods for generating parametric blood flow images using 15O-water and positron emission tomography. Mol. Imaging Biol. 7(4), 273–285 (2005). & Study presenting the basis function method to calculate parametric images of blood flow using [15O]H2O.
- Gunn RN, Lammertsma AA, Hume SP, Cunningham VJ. Parametric imaging of ligand-receptor binding in PET using a simplified reference region model. Neuroimage 6(4), 279–287 (1997).
- Watabe H, Jino H, Kawachi N et al. Parametric imaging of myocardial blood flow with 15O-water and PET using the basis function method. J. Nucl. Med. 46(7), 1219–1224 (2005).
- Lodge MA, Carson RE, Carrasquillo JA, Whatley M, Libutti SK, Bacharach SL. Parametric images of blood flow in oncology PET studies using [15O]water. J. Nucl. Med. 41(11), 1784–1792 (2000).
- Van der Veldt A, Hendrikse NH, Harms HJ et al. Quantitative parametric perfusion images using 15O-labeled water and a clinical PET/CT scanner: test-retest variability in lung cancer. J. Nucl. Med. 51(11), 1684–1690 (2010).
- Yoshinaga K, Manabe O, Katoh C et al. Quantitative analysis of coronary endothelial function with generator-produced 82Rb PET: comparison with 15O-labelled water PET. Eur. J. Nucl. Med. Mol. Imaging 37(12), 2233–2241 (2010).
- Nitzsche EU, Choi Y, Czernin J, Hoh CK, Huang SC, Schelbert HR. Noninvasive quantification of myocardial blood flow in humans. A direct comparison of the [13N] ammonia and the [15O]water techniques. Circulation 93(11), 2000–2006 (1996).
- Gerber BL, Melin JA, Bol A et al. Nitrogen- 13-ammonia and oxygen-15-water estimates of absolute myocardial perfusion in left ventricular ischemic dysfunction. J. Nucl. Med. 39(10), 1655–1662 (1998).
- Surti S, Kuhn A, Werner ME, Perkins AE, Kolthammer J, Karp JS. Performance of Philips Gemini TF PET/CT scanner with special consideration for its time-of-flight imaging capabilities. J. Nucl. Med. 48(3), 471–480 (2007).
- Karp JS, Surti S, Daube-Witherspoon ME, Muehllehner G. Benefit of time-of-flight in PET: experimental and clinical results. J. Nucl. Med. 49(3), 462–470 (2008).
- Surti S, Karp JS, Popescu LM, ube- Witherspoon ME, Werner M. Investigation of time-of-flight benefit for fully 3-D PET. IEEE Trans. Med. Imaging 25(5), 529–538 (2006).
- Lois C, Jakoby BW, Long MJ et al. An assessment of the impact of incorporating time-of-flight information into clinical PET/ CT imaging. J. Nucl. Med. 51(2), 237–245 (2010).
- Conti M. Focus on time-of-flight PET: the benefits of improved time resolution. Eur. J. Nucl. Med. Mol. Imaging 38(6), 1147–1157 (2011).
- Cao N, Huesman RH, Moses WW, Qi J. Detection performance analysis for time-of-flight PET. Phys. Med. Biol. 55(22), 6931–6950 (2010).
- Kadrmas DJ, Casey ME, Conti M, Jakoby BW, Lois C, Townsend DW. Impact of time-of-flight on PET tumor detection. J. Nucl. Med. 50(8), 1315–1323 (2009).
- El Fakhri G, Surti S, Trott CM, Scheuermann J, Karp JS. Improvement in lesion detection with whole-body oncologic time-of-flight PET. J. Nucl. Med. 52(3), 347–353 (2011).
- Slomka PJ, Nishina H, Berman DS et al. “Motion-frozen” display and quantification of myocardial perfusion. J. Nucl. Med. 45(7), 1128–1134 (2004).
- Le ML, Slomka PJ, Dey D et al. Motion frozen (18)F-FDG cardiac PET. J. Nucl. Cardiol. 18(2), 259–266 (2010).
- Martinez-Moller A, Zikic D, Botnar RM et al. Dual cardiac-respiratory gated PET: implementation and results from a feasibility study. Eur. J. Nucl. Med. Mol. Imaging 34(9), 1447–1454 (2007).
- Teras M, Kokki T, Durand-Schaefer N et al. Dual-gated cardiac PET-clinical feasibility study. Eur. J. Nucl. Med. Mol. Imaging 37(3), 505–516 (2010).
- Kokki T, Sipila HT, Teras M et al. Dual gated PET/CT imaging of small targets of the heart: method description and testing with a dynamic heart phantom. J. Nucl. Cardiol. 17(1), 71–84 (2010).
- Clark JC, Crouzel C, Meyer GJ, Strijckmans K. Current methodology for oxygen-15 production for clinical use. Int. J. Rad. Appl. Instrum. A 38(8), 597–600 (1987). 102 Klein R, Beanlands RS, deKemp RA. Quantification of myocardial blood flow and flow reserve: technical aspects. J. Nucl. Cardiol. 17(4), 555-570 (2010).


