Review Article - Imaging in Medicine (2010) Volume 2, Issue 5
Imaging biomarkers for patient selection and treatment planning in emphysema
Matthew Brown†1, Fereidoun Abtin1, Hyun J Kim1, Michael McNitt-Gray1and Jonathan Goldin1
1 Department of Radiology, University of California, 924 Westwood Blvd Suite 650, Los Angeles, CA 90024, USA
- *Corresponding Author:
- Matthew Brown
Department of Radiology, University of California 924
Westwood Blvd Suite 650, Los Angeles CA 90024, USA
Tel: +1 310 481 7551
Fax:+1 310 794 8485
E-mail: mbrown@mednet.ucla.edu
Abstract
Emphysema is a disease that causes destruction of lung tissue and an overall reduction in lung compliance as air becomes trapped in the diseased regions. It affects an estimated 60 million people worldwide and up to 2 million Americans. As the disease progresses, the hyperinflated regions continue to expand, limiting the effective volume available for more viable lung tissue. New biomedical valves and stents are being developed that can be implanted in target airways to allow air to escape from the most diseased lung lobe, thereby reducing its volume and providing more space for the adjacent (healthier) lobe to expand. The challenge facing the clinician is to determine which patients are most likely to benefit from the treatment and which lobe/airway should be treated. This article describes imaging biomarkers and an automated computer-aided diagnosis system to perform patient selection and treatment targeting in emphysema.
Keywords
computer-aided diagnosis; computed tomography; emphysema; imaging biomarker; lung volume reduction
Emphysema is a disease that causes destruction of lung tissue and an overall reduction in lung compliance as air becomes trapped in the diseased regions, in turn reducing oxygen exchange [1]. Emphysema affects an estimated 60 million people worldwide and up to 2 million Americans and is considered a major cause of mortality and morbidity. As the disease progresses, the hyperinflated regions continue to expand, limiting the effective volume available for more viable lung tissue. As a result of these abnormalities in lung mechanics, patients exhibit a progressive increase in dyspnea, and reductions in exercise tolerance and quality of life.
Surgical treatments for emphysema include lung volume reduction surgery, where the most diseased and hyperinflated lung tissue is resected. It has been shown to benefit some patients with advanced emphysema, in particular patients with severe upper lobe-predominant emphysema and low baseline exercise capacity [2–6], but studies have shown a wide range of individual outcomes [2,7–11]. New biomedical valves and stents are being developed that can be implanted in target airways to allow air to escape from the most diseased lobe, thereby reducing its volume and providing more space for the adjacent (healthier) lobe or segment to expand [12–15]. Other interventions based on the same principals include airway sealants, and endobronchial spigots and plugs [16]. These minimally invasive techniques have the potential to improve the quality of life for emphysema patients. The challenge facing the clinician is to determine which patients are most likely to benefit from the treatment and which lobe/airway should be treated. The selection of the target lobe is critical because the treatments are based on a reduction of lobar volume, or redistribution of ventilation away from the treated lobe, and a suitable diseased lobe must be identified if they are to be effective.
Lung volume and density measurements from CT play a prominent role in the diagnosis of emphysema [17–21]. Traditionally, the forced expiratory volume in 1 s (FEV1) has been used to measure the progression of emphysema; however, destructive changes in lung parenchyma often precede the decline in FEV1 by several years [22]. Quantitative assessment of the lungs using CT provides important complementary information to pulmonary function tests (PFTs) because it allows assessment of single and lobar lung volumes [23,24]. This ability for regional measurement of volumes is important in volume reduction treatments for emphysema [25]. Lung volumes and densities measured from imaging are now playing a key role in clinical trials of emphysema therapies [6,26,27] and changes in lobar volumes post-treatment are now being used as a primary outcome variable [27]. While this article focuses on device treatment trials, changes in density measures are also being employed in drug treatment trials as a measure of efficacy [28,29].
This article describes the imaging biomarkers used in emphysema clinical trials, and the first use of an automated computer-aided diagnosis system to perform patient selection and device treatment targeting. We also describe surrogate outcome imaging biomarkers used to analyze trial data and gain insights into the mechanism behind functional improvements.
Quantitative image analysis
Advances in CT technology have resulted in the ability to obtain thin-section images with submillimeter resolution through the entire thorax in less than a single breath-hold (<10 s). This has resulted in exquisitely detailed descriptions of thoracic anatomy, including identification of areas of emphysema, as well as the ability to identify individual lobes and their fissures. The information obtained at pixel level is a measure of x‑ray attenuation (measured in Hounsfield Units [HU]), which is an approximate measure of density. These values can be used to quantify disease burden, which has been particularly useful in emphysema patients.
Lung segmentation
There are a number of different lung CT segmentation methods available, with varying degrees of automation requiring different amounts of editing [25,30–36]. Most semiautomated techniques are based around the underlying principle of attenuation thresholding. The main clinical trial application described in this paper used a model-based image analysis system [30,31]. The system uses a parametric model of thoracic anatomy to guide automated segmentation based on attenuation thresholding (<‑500 HU for the lungs), region-growing and mathematical morphology. The results were manually edited as necessary, for example, to remove large central airways from the segmentation. Other methods set the threshold by analyzing the histogram of the CT image [33,34].
For subdivision of the lungs into lobes, several automated methods have been developed for thin-section CT images. Most methods use the pulmonary airway and vascular trees to guide subdivision of the lungs into lobes [33,37,38]. Other methods use an atlas-based fissure identification for lobar segmentation [24]. The lobar segmentation shown in Figure 1B was performed using a semiautomated surface fitting approach [39].
Lung density analysis
To determine eligibility of a patient for treatment, the severity and interlobar heterogeneity of emphysema are important variables. Within a segmented lung or lobe the low attenuation relative area (RA) is a commonly accepted measure used to quantify the severity of emphysema on CT, based on the premise that regions of coalescent emphysema, as shown in Figure 1A, have lower density (HU values) than normal parenchyma. The RA is derived from the lung attenuation curve/histogram by computing the percentage of voxels below a particular HU threshold (‑910 HU for thick-section or ‑950 HU for thin-section imaging). These techniques were originally validated against pathology [17,40]. Following thresholding, the percentage of emphysema destruction in each lobe is computed (Figure 1C). Another low attenuation measure often used is the 15th percentile of the lung attenuation curve [28]. The percentile in HU is typically converted to a density in g/l.

Figure 1. CT image from emphysema patient with lobar segmentation and quantitation. (A) Lung CT image showing paraseptal emphysema destruction, predominantly in the lower lobes. (B) Sagittal view of lobar segmentation results. (C) Computer-calculated emphysema involvement percentages in each lobe. Reproduced with permission from [69].
Lobar lung volume changes
To evaluate treatment efficacy, changes in lobar lung volumes are an important variable. By taking the product of the number of image voxels within a segmented lobe with the volume of an individual voxel, the volume of the lobe can be estimated. With careful attention to breathing instructions at the time of scanning, lung volume measurements have been shown to be highly reproducible and correlate with PFTs. In one study, CT imaging and body plethysmography were performed at baseline and after a 9‑month interval in multicenter emphysema treatment trials [39]. Lung volumes were measured at total lung capacity (TLC) and residual volume (RV). Correlations between CT and PFT lung volumes for 486 subjects at baseline were 0.86 at TLC and 0.67 at RV. The CT volumes at TLC were systematically lower than the PFT volumes by 0.6 l, similar to other studies [41]. This has been attributed to measurement in the supine versus sitting position and differences in airspace included by the PFT measurement [39]. Reproducibility was assessed in terms of the intraclass correlation coefficient (ICC) for 126 subjects from the control group at TLC and 120 subjects at RV (Figure 2). At TLC, ICC was 0.943 for CT and 0.814 for PFT. At RV, ICC was 0.886 for CT and 0.683 for PFT. CT lobar volumes showed high reproducibility (ICC ≥0.845 for the five lobes).

Figure 2. Plots of lung volumes measured at follow-up versus baseline, with regression (solid) and identity (dashed) lines. Clockwise from top left are the correlations from CT at TLC, CT at RV, PFT at RV and PFT at TLC. PFT: Pulmonary function test; RV: Residual volume; TLC: Total lung capacity. Reproduced with permission from [39].
Application of imaging biomarkers in clinical trials
These biomarkers have been used for patient eligibility, treatment targeting and efficacy assessment in minimally invasive emphysema treatment device trials [25,26]. As an example, we will focus on the Endobronchial Valve for Emphysema Palliation Trial (VENT), the first computer-aided diagnosis (CAD)-targeted emphysema trial [25]. The trial used the Zephyr valve (Pulmonx, Inc.) and the treatment involves placing the oneway endobronchial valve (EBV) in the lobar or segmental airways of the most diseased lobe to prevent air from entering these portions of the lung, while still allowing air to exit.
Clinical trial data acquisition
When performing quantitative image analysis in multicenter clinical trials it is important that imaging protocols be standardized to ensure comparability and reproducibility of image analysis results. The major factors affecting lung density and volume measurements are patient breath-hold and CT acquisition parameters, such as slice thickness and reconstruction kernel [42].
In VENT, image acquisition protocols were tailored based on the specific CT scanner model used at each site, and were designed to maintain as consistent image quality performance (slice thickness, spatial resolution and image noise) as possible across all scanners. CT imaging of the lung was performed at TLC and RV, preand post-treatment (nominally at an interval of 9 months), with 5–10 mm slice thickness, 120 kVp, 140–300 mAs and a pitch ranging from 0.984 to 1.5. Subjects were carefully coached to reach TLC and RV static breathholds during scanning and validity checks confirmed excellent breath-hold reproducibility [39]. Methods have been developed that aim to correct RA measurements for differences in patient breath-hold in longitudinal studies. These methods are based on linear regression or mixed-effects models and correcting using images acquired at two different breath-holds [43].
Patient eligibility & treatment targeting
Eligibility for minimally invasive emphysema trials is typically based on heterogeneity of disease as assessed by RA [25,26]. In VENT, the RA percentage was converted to an emphysema score from 0–4 as shown in Figure 3. The eligibility and lobe to be treated were then determined by the CAD system and a report was automatically generated as shown in Figure 3. The CAD system uses rule-based algorithms to make these diagnostic decisions. The eligibility criteria (shown in Figure 3) require an emphysema score of greater than three in one lobe, and an emphysema score at least one point lower in the adjacent lobe (i.e., interlobar heterogeneity of emphysema). The CAD system selects the most severely diseased lobe for treatment (volume reduction) using the algorithm shown in Figure 4. The criteria used in the VENT study were determined by the study investigators [26], based on an emphysema scoring system developed by Goddard et al. [44].

Figure 3. Web-based report form showing computer-aided diagnosis output: emphysema scores based on density mask and lobe to be targeted for valve placement. LLL: Left lower lobe; LUL: Left upper lobe; RLL: Right left lobe; RUL: Right upper lobe. Reproduced with permission from [69].

Figure 4. Computer-calculated lobar treatment targeting algorithm. DS: Density score; ES: Emphysema score; HS: Heterogeneity score; LLL: Left lower lobe; LUL: Left upper lobe; RLL: Right lower lobe; RUL: Right upper lobe. Reproduced with permission from [26].
Imaging surrogate outcomes
Changes in RV and RV/TLC are associated with changes in lung function [45]. As airway obstruction moves from borderline (90% of predicted FEV1) to moderate (50% of predicted FEV1), the mean RV increases from 100 to 140% of its predicted value. Previous studies with the EBV found that overall there were post-treatment reductions in TLC and RV (measured by PFT), with RV having greater reduction [46]. The lessening of hyperinflation and associated improvements in chest wall mechanics and elastic properties of the lung may be partly responsible for symptomatic improvements [46,47].
A retrospective research study was conducted using RV changes as a surrogate outcome biomarker, which included subjects from VENT [48]. The cohort was comprised of 274 subjects treated with the EBV and 126 matched controls with available CT scans acquired at RV. Subjects were imaged pre- and 6‑months post-treatment. The treatment group target lobe volume change had a mean (and standard deviation) of -300 (460) ml, with the control group having a change of six (180). The treatment group had a statistically significant volume reduction (p < 0.0001) compared with the control cohort. In patients who achieved substantial target lobe volume reduction (>15%), there were significant overall (whole lung) RV reductions accompanied by some redistribution of volume to nontreated lobes. Figure 5 shows an example of a subject treated with the EBV preand post-treatment with lobar collapse in the right upper lobe and volume redistribution to right middle and lower lobes. This patient had a positive outcome in terms of the lobar volume decrease variable. Similar lobar volume reductions and redistributions have been found in other EBV studies [26,49].

Figure 5. 3D visualization of lung vasculature from CT pre- and post-treatment. (A) Lobar segmentation prevalve; right upper lobe is green, right middle lobe is red and lower lobe is purple. (B) Postvalve placement in the right upper lobe, showing upper (emphysematous) lobe collapse and lower lobe expansion reflecting partial redistribution to nontarget lobes. Reproduced with permission from [69].
Conclusion
Computer-aided diagnosis systems are being used to extract quantitative imaging biomarkers from CT to assess emphysema. In this article we described their use to determine patient eligibility and treatment targeting in therapeutic trials for emphysema. Quantitative imaging is expected to play a greater role as a predictive and surrogate outcome biomarker. These biomarkers have the potential to reduce the numbers of patients in clinical trials and provide insights into the mechanism behind functional improvements.
Future perspective
Previous studies have shown statistically significant overall reductions in RV using the targeting algorithms described in this article, but the reductions are modest from a clinical standpoint. However, responder analyses have identified a subgroup with clinically significant RV reductions of more than 0.5 l [48]. Research suggests that the new predictive imaging biomarkers described in this section can be used to identify these responders prospectively, thus increasing the overall treatment efficacy.
Fissure integrity as a biomarker for treatment efficacy
Recent research on data from completed trials has shown that there is a difference in imaging features between subgroups who benefited from treatment and those who did not. For example, a closed system in the target lobe is important to achieve desired volume loss [46,50,51], and studies have shown that patients with complete interlobar fissures assessed on CT (a marker of no collateral ventilation between lobes) benefit from treatment more than patients with incomplete fissures [52,53]. Therefore, a quantitative measure of fissure integrity may be an important biomarker for treatment planning.
Assessment of fissure integrity using high resolution CT imaging has previously been carried out by visual inspection and subjective grading into three categories: complete, incomplete and absent [53–55]. This is a tedious and difficult task requiring review of a large number of images under multiplanar reformats, which has motivated the development of an automated quantitative system to assess fissure integrity. An automated quantitative system could be of tremendous benefit in making assessment of fissure integrity more discriminative, reproducible and broadly applicable. A variety of methods have been introduced for fissure detection [38,56–61], and more recently classification techniques have been used to quantify fissure integrity [62].
The Hessian matrix of second-order partial derivatives (Equation 1) was used to characterize the variations in intensity around a point, and features were computed to detect the image gradient changes associated with a fissure. The computation has been described in greater detail by other authors [56,63]. These features were used to develop a voxel-wise fissure classification model by unsupervised k‑means clustering. The number of clusters was set to three based on the premise that three classes are expected: fissure, nonfissure and bronchovascular bundle (near the hilum). The CAD system was also applied to each case and automatically classified voxels along the fissural path into the same three categories. The fissure integrity was then assessed by calculating the percent completeness of the fissure:
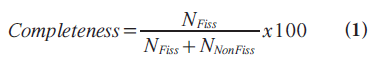
where NFiss is the number of voxels classified as fissure and NNonFiss is the number of voxels classified as nonfissure.
Based on previous studies involving visual assessment, a completeness percentage of 90% or more was considered as a complete fissure for potential treatment planning. The performance of the system was then evaluated using 84 randomly selected fissure images. The test cases were also independently contoured by two observers to form a reference standard for fissural completeness. Analysis of the results showed that there was no statistically significant difference between the CAD system and the human observers in calculating fissure percentage completeness (t‑test p > 0.05). Pairwise comparisons of CAD–reader and reader– reader assessment of fissure completeness showed comparable levels of agreement of 77% or more.
Chronic obstructive pulmonary disease characterization: airways disease versus emphysema
Patient selection may also be enhanced by better characterization of chronic obstructive pulmonary disease (COPD), by distinguishing between emphysema and airways disease, and further in terms of emphysema phenotype. Emphysema treatments may not be appropriate for COPD patients with a predominance of airways disease and vice versa. Also, some studies have shown that surgical lung volume reduction surgery treatments may be most effective in patients with upper lobe-predominant emphysema [64].
Airway morphometry is one avenue for improved COPD characterization. Studies are beginning to show an association between CT airway measurements of lumen area and wall thickness with clinical measures of airflow limitation [65]. Airway analysis steps typically include detection of the airway lumen, extraction of the centerline of the airway tree and segment labeling [66]. This is followed by morphometric measurement by reformatting the image data orthogonal to the airway centerline, detection of the inner and outer airway wall boundaries, and computation of lumen area and wall thickness for each segment [67]. There are a number of challenges that complicate this analysis, including the comparable size of airway walls and point spread function of the CT scanner, as well as partial voluming effects, all of which cause blurring and make detection of the airway wall edges difficult. These effects vary from scanner to scanner and with acquisition parameters in multicenter clinical trials. Current research aims to increase automation of airway segmentation and labeling, and increase measurement reproducibility.
Emphysema patterns are being characterized through CT image texture analysis and low attenuation cluster analysis. In texture analysis, features are extracted within the lung parenchyma and pattern classifiers are trained to recognize patterns such as centrilobular, panlobular and paraseptal emphysema [68]. In low attenuation cluster analysis, the severity of emphysema is characterized by constructing a histogram of the sizes of clusters of pixels that are contiguous in the 2D image plane. Mild disease is thought to have a larger number of small low attenuation clusters, while more advanced disease will have a smaller number of large low attenuation clusters, representing coalescent emphysema. It is expected that these research efforts will enable better characterization of emphysema and provide an opportunity to better target patients who are most likely to benefit from specific therapies.
Financial & competing interests disclosure
M Brown and J Goldin are stakeholders in MedQIA Imaging Core Laboratory. The authors have no other relevant affiliations or financial involvement with any organization or entity with a financial interest in or financial conflict with the subject matter or materials discussed in the manuscript apart from those disclosed.
No writing assistance was utilized in the production of this manuscript.
Papers of special note have been highlighted as:
* of interest
*of considerable interest
References
- Halbert RJ, Natoli JL, Gano A et al.: Global burden of COPD: systematic review and meta-analysis. Eur. Respir. J. 28(3), 523–532 (2006).
- Sciurba FC, Rogers RM, Keenan RJ et al.: Improvement in pulmonary function and elastic recoil after lung-reduction surgery for diffuse emphysema. N. Engl. J. Med. 334(17), 1095–1099 (1996).
- Martinez FJ, de Oca MM, Whyte RI et al.: Lung-volume reduction improves dyspnea, dynamic hyperinflation, and respiratory muscle function. Am. J. Respir. Crit. Care Med. 155(6), 1984–1990 (1997).
- Sabanathan A, Sabanathan S, Shah R, Richardson J: Lung volume reduction surgery for emphysema. A review. J. Cardiovasc. Surg. 39(2), 237–243 (1998).
- Geddes D, Davies M, Koyama H et al.: Effect of lung-column-reduction surgery in patients with severe emphysema. N. Engl. J. Med. 343(4), 239–245 (2000).
- Fishman A, Martinez F, Naunheim K et al.: A randomized trial comparing lung-volumereduction surgery with medical therapy for severe emphysema. N. Engl. J. Med. 348(21), 2059–2073 (2003).
- Brenner M, McKenna R, Gelb A et al.: Objective predictors of response for staple versus laser emphysematous lung reduction. Am. J. Respir. Crit. Care Med. 155, 1295–1301 (1997).
- Cooper JD, Patterson GA, Sundaresan RS et al.: Reduction procedures in patients with severe emphysema. J. Thorac. Cardiovasc. Surg. 112, 1319–1330 (1996).
- Ingenito EP, Evans RB, Loring SH et al.: Relation between preoperative inspiratory lung resistance and the outcome of lungvolume reduction surgery for emphysema. N. Engl. J. Med. 338, 1181–1185 (1998).
- McKenna R, Brenner M, Fischel RJ et al.: Patient selection criteria for lung volume reduction surgery. J. Thorac. Cardiovasc. Surg. 114, 957–967 (1997).
- Geddes D, Davies M, Koyoma H et al.: Effect of lung volume reduction surgery in patients with severe emphysema. N. Engl. J. Med. 343, 239–245 (2000).
- Hopkinson NS, Toma TP, Hansell DM et al.: Effect of bronchoscopic lung volume reduction on dynamic hyperinflation and exercise in emphysema. Am. J. Respir. Crit. Care Med. 171, 453–460 (2005).
- Reilly J, Washko G, Pinto-Plata et al.: Biological lung volume reduction: a new bronchoscopic therapy for advanced emphysema. Chest 131, 1108–1113 (2005).
- Wan IY, Toma TP, Geddes DM et al.: Bronchoscopic lung volume reduction for end-stage emphysema: report on the first 98 patients. Chest 129, 518–526 (2006).
- Wood DE, McKenna RJ, Yusen RD et al.: A multicenter trial of an intrabronchial valve for treatment of severe emphysema. J. Thorac. Cardiovasc. Surg. 133, 65–73 (2007).
- Brenner M, Hanna NM, Mina-Araghi R et al.: Innovative approaches for lung volume reduction surgery in emphysema. Chest 126(1), 238–248 (2004). & Describes minimally invasive emphysema treatment devices.
- Muller NL, Staples CA, Miller RR et al.: Density mask: an objective method to quantitative emphysema using computed tomography. Chest 94, 782–787 (1988).
- Uppaluri R, Mitsa T, Sonka M et al.: Quantification of pulmonary emphysema from lung computed tomography images. Am. J. Respir. Crit. Care Med. 156, 248–254 (1997).
- Kuwano K, Matsuba K, Ikeda T: The diagnosis of mild centrilobular emphysema: correlation of computed tomography and pathology scores. Am. Rev. Respir. Dis. 141, 169–178 (1990).
- Madani A, Keyzer C, Gevenois PA: Quantitative computed tomography assessment of lung structure and function in pulmonary emphysema. Eur. Respir. J. 18, 720–730 (2001).
- Litmanovich D, Boiselle PM, Bankier AA: CT of pulmonary emphysema – current status, challenges, and future directions. Eur. Radiol. 19, 537–551 (2009).
- Gurney JW, Jones KK, Robbins RA et al.: Regional distribution of emphysema: correlation of high-resolution CT with pulmonary function tests in unselected smokers. Radiology 183, 457–463 (1992).
- Brown MS, McNitt-Gray MF, Goldin JG et al.: Automated measurement of single and total lung volume from CT. J. Comput. Assist. Tomogr. 23, 632–640 (1999). & Describes the underlying lung image segmentation algorithm used for the analysis described in this article.
- Zhang L, Hoffman EA, Reinhardt JM: Atlas-driven lung lobe segmentation in volumetric x-ray CT images. IEEE Trans. Med. Imaging 25(1), 1–16 (2006).
- Bae KT, Slone RM, Gierada DS et al.: Patients with emphysema: quantitative CT analysis before and after lung volume reduction surgery. Radiology 203, 207–714 (1997).
- Strange C, Herth FJ, Kovitz KL et al.: Design of the endobronchial valve for emphysema palliation trial (VENT): a non-surgical method of lung volume reduction. BMC Pulm. Med. 7, 10 (2007). & Describes the clinical trial of an emphysema treatment device used as the primary example in this article.
- Coxson HO, Nasute Fauerbach PV, Storness-Bliss C et al.: Computed tomography assessment of lung volume changes after bronchial valve treatment. Eur. Respir. J. 32(6), 1443–1450 (2008). & Describes the use of lobar lung volume reduction measurements from CT as the primary outcome measure in an emphysema treatment trial.
- Dirksen A, Dijkman J, Madsen F et al.: A randomized clinical trial of a1-antitrypsin augmentation therapy. Am. J. Respir. Crit. Care Med. 160(5), 1468–1472 (1999).
- Fitzgerald MF, Fox JC: Emerging trends in the therapy of COPD: novel anti-inflammatory agents in clinical development. Drug Discov. Today 12(11–12), 479–486 (2007).
- Brown MS, McNitt-Gray MF, Mankovich NJ et al.: Method for segmenting chest CT image data using an anatomical model: preliminary results. IEEE Trans. Med. Imaging 16, 828–839 (1997).
- Brown MS, Goldin JG, McNitt-Gray MF et al.: Knowledge-based segmentation of thoracic CT images for assessment of split lung function. Med. Phys. 27, 592–598 (2000).
- Hu S, Hoffman EA, Reinhardt JM: Automatic lung segmentation for accurate quantitation of volumetric x-ray CT images. IEEE Trans. Med. Imaging 20, 490–498 (2001).
- Zhou X, Hayashi T, Hara T et al.: Automatic segmentation and recognition of anatomical lung structures from high-resolution chest CT images. Comput. Med. Imaging Graph 30, 299–313 (2006).
- Armato SG, Sensakovic WF: Automated lung segmentation for thoracic CT: impact on computer-aided diagnosis. Acad. Radiol. 11, 1011–1021 (2004).
- Heussel CP, Herth FJ, Kappe J et al.: Fully automatic quantitative assessment of emphysema in computed tomography: comparison with pulmonary function testing and normal values. Eur. Radiol. 19(10), 2391–2402 (2009).
- van Rikxoort EM, de Hoop B, Viergever MA, Prokop M, van Ginneken B: Automatic lung segmentation from thoracic computed tomography scans using a hybrid approach with error detection. Med. Phys. 36(7), 2934–2947 (2009).
- Palagyi K, Tschirren J, Hoffman E et al.: Quantitative analysis of pulmonary airway tree structures. Comput. Biol. Med. 36, 974–976 (2006).
- Tschirren J, Hoffman E, McLennan G et al.: Intrathoracic airway trees: segmentation and airway morphology analysis from low-dose CT scans. IEEE Trans. Med. Imaging 24, 1529–1539 (2005).
- Brown MS, Kim HJ, Abtin F et al.: Reproducibility of lung and lobar volume measurements using computed tomography. Acad. Radiol. 17(3), 316–322 (2010). & Describes the reproducibility of the lobar lung volume measurements used as a biomarker in emphysema treatment trials.
- Bankier AA, De Maertelaer V, Keyzer C et al.: Pulmonary emphysema: subjective visual grading versus objective quantification with macroscopic morphometry and thin-section CT densitometry. Radiology 211, 851–858 (1999). & Describes the low attenuation relative area imaging biomarker used in emphysema treatment trials.
- Kauczor HU, Heussel CP, Fisher B et al.: Assessment of lung volumes using helical CT at inspiration and expiration: comparison with pulmonary function tests. AJR Am. J. Roentgenol. 171, 1091–1095 (1998).
- Boedeker KL, McNitt-Gray MF, Rogers SR et al.: Emphysema: effect of reconstruction algorithm on CT imaging measures reconstruction algorithm effects on CT imaging measures in emphysema patients. Radiology 232, 295–301 (2004).
- Stoel B, Putter H, Els Bakker M et al.: Volume correction in computed tomography densitometry for follow-up studies on pulmonary emphysema. Proc. Am. Thorac. Soc. 5, 919–924 (2008).
- Goddard PR, Nicholson EM, Laszlo G, Watt I: Computed tomography in pulmonary emphysema. Clin. Radiol. 33(4), 379–387 (1982).
- Dykstra BJ, Scanlon PD, Kester MM et al.: Lung volumes in 4,744 patients with obstructive lung disease. Chest 115, 68–74 (1999).
- Hopkinson NS, Toma TP, Hansell DM et al.: Effect of bronchoscopic lung volume reduction on dynamic hyperinflation and exercise in emphysema. Am. J. Crit. Care Med. 171, 453–460 (2005).
- Woolcock AJ, Read J: Lung volumes in exacerbations of asthma. Am. J. Med. 41, 259–273 (1966).
- Brown M, Kim HJG, Abtin FG et al.: Minimally invasive emphysema lung volume reduction: effects of target lobe atelectasis on the ipsilateral and contralateral lobes. Presented at: The American Thoracic Society International Conference. New Orleans, LA, USA, 14–19 May 2010.
- Ninane V, Bezzi M, Geltner C et al.: Non-lobar atelectasis approach for the treatment of advanced emphysema with bronchial valves in a european multicenter, single blinded and randomized study. Am. J. Respir. Crit. Care Med. 181, A2847 (2010).
- Fessler HE: Collateral ventilation, the bane of bronchoscopic volume reduction. Am. J. Respir. Crit. Care Med. 171, 423–424 (2005).
- Cetti EJ, Moore AJ, Geddes DM: Collateral ventilation. Thorax 61, 371–373 (2006).
- Goldin JG, Strange C, Criner GJ et al.: Fissure integrity is a marker of collateral ventilation across lung lobes. Proc. Am. Thorac. Soc. 177, A17 (2008).
- Abtin, F, Goldin JG, Strange C et al.: The influence of fissural anatomy on the treatment outcome of patients with emphysema. Presented at: The American Thoracic Society International Conference. Toronto, Canada, 16–21 May 2008.
- Proto AV, Ball JB Jr: Computed tomography of the major and minor fissures. Am. J. Roentgenol. 140, 439–448 (1983).
- Ariyurek OM, Karabulut N, Yelgec NS et al.: Anatomy of the minor fissure: assessment with high-resolution CT and classification. Eur. Radiol. 12, 175–180 (2002).
- Sato Y, Nakajima S, Shiraga N et al.: Three-dimensional multi-scale line filter for segmentation and visualization of curvilinear structures in medical images. Med. Image Anal. 2(2), 143–168 (1998).
- Zhang L, Hoffman EA, Reinhardt JM: Lung lobe segmentation by graph search with 3-D shape constraints. Proc. SPIE 4321, 204–215 (2001).
- Wang J, Betke M, Ko JP: Shape-based curve growing model and adaptive regularization for pulmonary fissure segmentation in CT. Lecture Notes in Computer Science 3216, 541–548 (2003).
- Saita S, Yasutomo M, Kubo M et al.: An extraction algorithm of pulmonary fissures from multi-slice CT image. Proc SPIE 5370, 1590–1597 (2004).
- van Rikxoort EM, van Ginneken B, Klik M et al.: Supervised enhancement filters: application to fissure detection in chest CT scans. IEEE Trans. Med. Imaging 27(1), 1–10 (2008).
- Ochs R, Goldin J, Abtin F et al.: Automated classification of lung bronchovascular anatomy in CT using AdaBoost. Med. Image Anal. 11(3), 315–324 (2007).
- Brown MS, Ochs R, Abtin F et al.: Automated quantitative assessment of lung fissure integrity on CT. In: Proceedings of the First International Workshop on Pulmonary Image Analysis. Brown M, de Bruijne M, van Ginneken B (Eds). 93–102 (2008).
- Krissian K, Malandain G, Ayache N et al.: Model based detection of tubular structures in 3D images. Comput. Vis. Image Underst. 80, 130–171 (2000).
- Fishman A, Martinez F, Naunheim K; National Emphysema Treatment Trial Research Group: A randomized trial comparing lung-volume-reduction surgery with medical therapy for severe emphysema. N. Engl. J. Med. 348(21), 2059–2073 (2003).
- Matsouka S, Yasuyuki K, Kunihiro Y et al.: Airway bimensions at inspiratory and expiratory multisection CT in chronic obstructive pulmonary disease: correlation with airflow limitation. Radiology 248(3), 1042–1049 (2008).
- Estepar RSJ, Reilly JJ, Silberman EK et al.: Three-dimensional airway measurements and algorithms. Proc. Am. Thorac. Soc. 5, 905–909 (2008).
- Reinhardt JM, D’Souza ND, Hoffman EA: Accurate measurement of intra-thoracic airways. IEEE Trans. Med. Imaging 16, 820–827 (1997).
- Sorensen L, Shaker SB, de Bruijne M: Texture classification in lung CT using local binary patterns. Med. Image Comput. Comput. Assist. Interv. 5241, 934–941 (2008).
- Brown MS, McNitt-Gray MF, Pais R et al.: CAD in clinical trials: current role and architectural requirements. Comput. Med. Imaging Graph 31, 332–337 (2007). & Describes the information system used to perform image data management and analysis in emphysema treatment trials.


