Research Article - Journal of Medicinal and Organic Chemistry (2022) Volume 5, Issue 6
Identification of organic acids in wine: Analytical multi-technique Chemical Modelling
Karuna Kusalasai*
Department of Chemistry, Faculty of Science, Naresuan University, Phitsanulok, Thailand
Department of Chemistry, Faculty of Science, Naresuan University, Phitsanulok, Thailand
E-mail: kussalasaikaruna@edu.org
Received: 02-Dec -2022, Manuscript No. JMOC-22-83086; Editor assigned: 05- Dec-2022, PreQC No. JMOC-22- 83086 (PQ); Reviewed: 19-Dec-2022, QC No. JMOC-22-83086; Revised: 26-Dec-2022, Manuscript No. JMOC- 22-83086 (R); Published: 30-Dec-2022 DOI: 10.37532/jmoc.2022.5(6).98-105
Abstract
This work proposes the use of digital image-based method for determination of total acidity in red wines by means of acid-base titration without using an external indicator or any pre-treatment of the sample. Digital images present the colour of the emergent radiation which is complementary to the radiation absorbed by anthocyanines present in wines. Anthocyanines change colour depending on the pH of the medium, and from the variation of colour in the images obtained during titration, the end point can be localized with accuracy and precision. RGB-based values were employed to build titration curves, and end points were localized by second derivative curves. New protonation constants were refined with respect to our previous investigation on red wines. Attention was paid for mixed solvent, ionic strength, and temperature to ensure a thermodynamic level to the study. Validation of the chemical model optimized is achieved by way of conductometric measurements and using a synthetic “wine” especially adapted for testing.
Red wine ▪ White wine ▪ Ethanol organic acids ▪ Gastric acid secretion
Introduction
Low molecular weight organic acids are important natural constituents of wines. Some of them are originally present in the grape while others appear during subsequent fermentation processes as a consequence of biochemical reactions. For instance, tartaric, gluconic, malic and citric acids come directly from the grape while succinic, fumaric, lactic and acetic acids are mainly produced during the winemaking processes. Tartaric acid is the main acid of wine, accounting for ca. 30% of the total acids. Tartaric acid is resistant to decomposition by bacteria, so its transformation into lactic and acetic acid is quite residual. Malic acid is microbiologically labile, thus resulting in lactic acid in the course of malolactic fermentation. Citric acid is another subtract of lactic bacteria so its concentration typically decays in the course of winemaking processes. Succinic and acetic acids are other secondary fermentative products, the latter being related to unwanted vinegary spoilage [1]. Gluconic acid is a minor component typically associated to an excessive fruit ripening so its occurrence at high concentration is often a sign of poor grape quality. Organic acids strongly influence on some organoleptic features such as taste and equilibrium. In this way, acids give to wines a slightly tart flavor, but this can be modulated by alcohol, sugars, minerals and other components. Organic acids are also relevant chemical descriptors of interest for quality control purposes, providing information on origin, grape variety, microbiological growth and oenological practices. Levels of acids may affect the color, taste and aroma of the wine [2]. Also, they influence on the stability and microbiological quality of the wine, stopping or, at least, delaying the growth of harmful microorganisms that could cause wine spoilage. The evolution of the acidity during the several stages of wine and cava production is used by the winemakers to know about the quality of the final product.
Traditionally, the wineries used potentiometric and volumetric methods to assess the total and volatile acidity of wines. The quantification of individual compounds such as tartaric, malic, lactic, and acetic and gluconic acids has been carried out by enzymatic, spectroscopic and chromatographic methods. Enzymatic approaches are highly selective but may result in time-consuming and expensive analyses due to the need of specific reagents for each species. New devices based on gold and nanocomposite technologies have contributed to improve the detection. Flowinjection analysis has been used to facilitate the automation of the enzymatic processes combined with spectroscopic detection. Spectroscopic methods for multianalyte determination rely on Fourier Transform Infrared (FTIR) with further chemometric analysis by Partial Least Square (PLS) regression. Separation techniques result in one of the most convenient approaches for the simultaneous determination of a wide range of the organic acids in wine samples [3]. Among them, HPLC is the most common technique since the pioneering studies by Palmer et al. regarding the separation in HPLC, reversed-phase (RP) and ion exchange modes have been extensively used, combined with UV spectrophotometric, refractive index and electrochemical detection. Recently, new RP stationary phases with alkyl groups have been especially designed to retain a wide range of hydrophilic species using eluents with high percentages of water. These RP alkyl columns rely on silanol endcapping with trimethylsilyl groups to provide good stability and full compatibility with polar solvents like water. As a result, the use of this type of columns in current analytical laboratories has been consolidated and numerous studies have been published in this regard [4]. Anyway, despite the excellent performance of these columns, the separation of food components is difficult and various analytical issues remain still unresolved, such as the complex retention behavior of analytes as a function of the pH of the mobile phase, and the diversity of interfering species occurring in the sample. In this regard, sample pretreatments such as dialysis and electrodialysis coupled to HPLC can provide better results. Apart from HPLC, gas chromatography (GC) and capillary electrophoresis (CE) have also been used for the determination of organic acids in wines. In the case of GC, analytes must be derivatized to decrease their polarity and increase volatility using, for instance, silanization reactions. CE, in contrast, is envisaged as a natural separation mode for charged molecules such as organic acids so that several papers have been published on this topic [5].
Sample Storage
All wines were stored at room temperature in the dark and were subdivided into small glass bottles to avoid air contact and other contamination.
Reagents and Solutions
Standard solutions of carboxylic acids were prepared from analytical-reagent grade chemicals; standardization process was performed to achieve high-quality, by titrating each stock solution with standard carbonate-free KOH. Carboxylic acids: 2-ketoglutaric, shikimic, L-lactic, L-citramalic, and gallic acids were from Sigma; L-tartaric and succinic acids were from Carlo Erba; DL-malic, acetic, and citric acids were from Merck; pyruvic and fumaric acids were from Fluka. Amino acid: L-proline was from Sigma. Salts: KH2PO4 was from Sigma, (NH4)2SO4 was from Carlo Erba. Solvents: acetone was from Labochem, ethanol was from Merck. Mineral acids: phosphoric acid (85% w/v) was from Carlo Erba, sulfuric acid was from Fluka. Standard solutions of KOH were prepared by diluting concentrated Merck ampoules and were standardised against potassium hydrogen phthalate [6]. Amberlite, a cation exchange resin, was from Carlo Erba. Grade glassware and deionised and twice distilled water were used for all solutions.
Chromatographic Apparatus for Carboxylic Acids Analysis
Chromatographic analyses for carboxylic acids were carried out with an Agilent 1100 chromatograph equipped with an Agilent 1100 pump. The injector was a rheodyne valve with a 20 μL sampling loop, and the detector was an Agilent 1100 UV-vis photometer. As to HPLC-RP analyses, the chromatographic separations were performed on a Merck Superspher 100 RP-18 endcapped spherical phase column with a particle size of 4 μm. The HPLC-IEC analyses were carried out using a Supelcogel C-610H column, polystyrenedivinylbenzene-based strong acid cation exchange resin in the H+ form.
Chromatographic Conditions for Carboxylic Acids Analysis
As for HPLC-RP separation, the mobile phase was composed of 70 g/L potassium dihydrogen phosphate and 14 g/L (0.10 M) ammonium sulphate adjusted to pH 2.1 with phosphoric acid, in order to have the highest protonation degree of the acids under examination, according to the method of Tusseau and Benoit. The flow rate was 0.7 mL/ min at room temperature. The separation was carried out under isocratic conditions, and the detection was effected by measurement of the UV absorption at 210 nm. For HPLC-IEC separation, the mobile phase was composed of 10% acetone and 0.5 mM sulphuric acid. The flow rate was 0.4 mL/min. Column and precolumn were thermostated at 45◦C. The separation was carried out under isocratic conditions, and the detection was effected by measurement of the UV absorption at 210 nm. Each substance determined via HPLC was identified by its retention time in comparison with the response of standard solution of pure compounds [7]. Standard addition of some substance to the wine was performed in order to verify the attribution of the peaks.
Preliminary Treatments of Wine Samples for Carboxylic Acids Analysis
Both for HPLC-RP and HPLC-IEC the samples were treated by means of Chromabond C18 MACHEREY-NAGEL cartridges, which allow purifying the matrix of those molecular compounds which can interfere in the chromatographic measurements. This treatment does not alter the carboxylic acid composition of the samples, as verified by means of a check on synthetic mixtures. Each cartridge was conditioned with little volume of water and then with little volume of ethanol, before sample purification procedure. As for ion-exclusion chromatography, each sample was also purified from metal ions in order to prevent the saturation of the cation exchange resin surface of the column used for the separation [8]. 1 g of a cation exchange resin was added to 100 mL of each wine and stirred for twenty minutes by means of a magnetic stirrer. Finally, each sample was filtered through a 0.45 μm Millipore filter and diluted 1/10 (v/v) with twice distilled water before the chromatographic injection.
Results and Discussion
Analytical Determinations
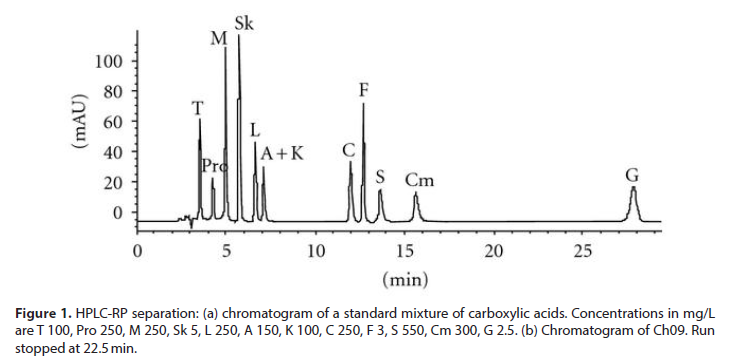
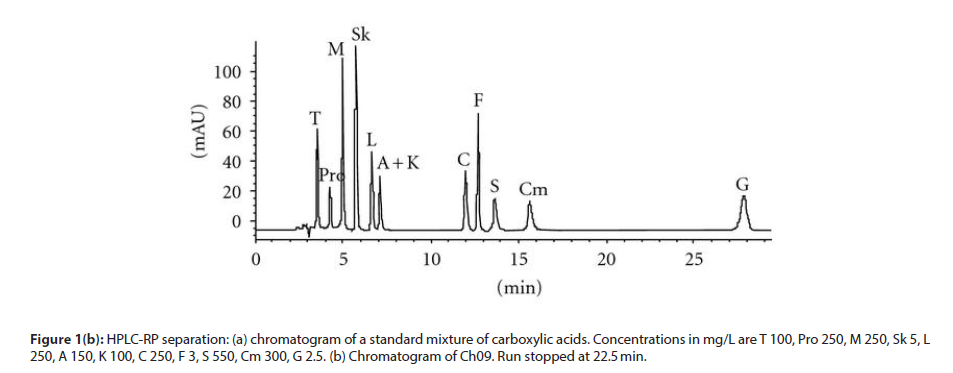
First, to quantify carboxylic acids in wine, we chose to adopt a method without derivatization based on a classical RP separation. The conditions adopted allowed us the separation of the following acids: tartaric, malic, shikimic, lactic, citric, fumaric, succinic, citramalic, and Gallic, together with the simultaneous determination of the proline, the most abundant amino acid present in wine. In (Figure 1(a)) a standard run is shown. Calibration graphs were built in order to characterize the acidic profile of wines under investigation, starting by a chromatographic run of a stock solution and its further dilutions. In (Figure 1(b)) the chromatographic separation on Ch09 is given as an example. Unfortunately, a coelution of acetic and 2-ketoglutaric acids is observed under the adopted experimental conditions at a tR of 7.2 minutes. Plot of the integrated peak area and/or height against concentration of each molecule was always linear in the concentration ranges investigated. With HPLC-IEC the conditions adopted allowed us the separation of 2-ketoglutaric, pyruvic, and acetic. The repeatability of peak heights or areas, obtained by repeated injections of the same concentration of standard, is in the range 0.6–4% for all the carboxylic acids studied. Intraday and infraday repeatability was of very similar extent. In (Table 1), the concentration of carboxylic acids utilized for the optimization of the chemical model is collected for each wine under investigation [9]. Comparing the results with those obtained on red wines analysed in the previous paper, in white wines a higher concentration of citric acid was measured while citramalic and gallic acids are found only in the red wines previously analysed.
| Substances | Identification Symbol | Wine | |||||
|---|---|---|---|---|---|---|---|
| E07 | E08 | C07 | C08 | Ch09 | R07 | ||
| Acetic acid | A | 395.3 | 349.1 | 710.1 | 528.1 | 366.5 | 240.3 |
| Citramalic acid | Cm | <d.l. | <d.l. | <d.l. | <d.l. | <d.l. | <d.l. |
| Citric acid | C | 718.5 | 257.4 | 499.5 | 426.5 | 480.3 | 326.6 |
| Fumaric acid | F | <d.l. | <d.l. | <d.l. | <d.l. | <d.l. | <d.l. |
| Gallic acid | G | <d.l. | <d.l. | <d.l. | <d.l. | <d.l. | <d.l. |
| 2-Ketoglutaric acid | K | 58.4 | 190.0 | 24.8 | 33.6 | 26.3 | 23.4 |
| Lactic acid | L | 614.5 | 653.8 | 1116.6 | 1000.4 | 758.5 | 374.4 |
| Malic acid | M | 2419 | 3038.5 | 449.2 | 682.5 | 1702.9 | 2373.4 |
| Proline | Pro | 300.4 | 308.5 | 545.6 | 527.2 | 4109.1 | 1922.2 |
| Pyruvic acid | Py | 201.5 | 236.7 | 214.7 | 196.2 | 44.9 | 13.2 |
| Shikimic acid | Sk | 34.8 | 33.1 | 20.9 | 13.9 | 34.8 | 52.3 |
| Succinic acid | S | 916.4 | 866.8 | 395.6 | 560.9 | 259.8 | 236.2 |
| Tartaric acid | T | 1805.6 | 2053.2 | 1900.1 | 1678 | 2926.8 | 4247.5 |
Table 1. Analytical concentrations (mg/L) of carboxylic acids and proline quantified in each wine under investigation by HPLC-RP and HPLC-IEC. The relative standard deviation, evaluated on three replicates on each sample, ranges between 0.6 and 10%.
Quantification of Inorganic Anions and Cations
Results for inorganic anions and cations are collected in (Tables 2 and 3) respectively. The inorganic anions were determined with HPLC-IC, and the conditions adopted allowed us the separation of phosphate, nitrate, sulphate, and chloride. The results reported in (Table 2) show that sulphates are predominant, while nitrates were found in low concentration only in Ch09 and chlorides resulted under the detection limit. As to cations, the results reported in (Table 3), obtained by ICP/AES; show that potassium is the predominant one in all wines.
Equilibrium Determinations
In our previous paper three carboxylic acidsacetic, L-tartaric, and citric acid-chosen as model substances, were titrated in or to refine the overall protonation constant values for mono-, di-, and triprotic acids in ethanol water media. We assumed that the differences experimentally observed for each of our three model molecules in water and ethanol-water media are the same under the same conditions of electrical charges involved in any single step protonation reaction. Now, we added L-lactic and succinic acids to improve the model by verifying previous assumptions with common substances present in wine but lightly different from those previously considered. Conditions: KCl at two ionic strength values, I = 0.05 and I = 0.1 M, was used as background electrolyte in 12% ethanol-water mixture. Since K+ ion is the most representative metal ion in wines, we believe the choice of KCl as background salt to obtain a suitable set of protonation constant values to model the acid-base chemistry of wines is correct.
| Inorganic anion | Wine | |||||
|---|---|---|---|---|---|---|
| C07 | C08 | E07 | E08 | Ch09 | R07 | |
| Phosphate | 3.77 | 3.95 | 4.18 | 4.47 | 5.22 | 3.28 |
| Nitrate | <d.l. | <d.l. | <d.l. | <d.l. | 0.26 | <d.l. |
| Sulphate | 14.04 | 12.48 | 17.49 | 17.88 | 4.83 | 3.46 |
| Chloride | <d.l. | <d.l. | <d.l. | <d.l. | <d.l. | <d.l. |
Table 2. Concentration (mM) of inorganic anions in each wine. The uncertainty (three replicates) ranges between 2 and 10% (±𝑠).
| Metal ion | Wine | |||||
| C07 | C08 | E07 | E08 | Ch09 | R07 | |
| Ca | 2.2 | 2.2 | 2.5 | 2.5 | 1.64 | 2.7 |
| Fe | 0.04 | 0.03 | 0.09 | 0.05 | 0.04 | 0.04 |
| K | 13.2 | 11.5 | 22.8 | 16.9 | 12.93 | 17.96 |
| Mg | 3.1 | 2.9 | 3.4 | 3.6 | 4.27 | 3.05 |
| Na | 1.3 | 1.3 | 0.7 | 0.5 | 1.33 | 0.75 |
Table 3. Concentration (mM) of the metal ions in each wine (ICP/AES). The uncertainty (three replicates) ranges between 2 and 8% (±𝑠).
These experimental values of log βH in 12% ethanol water mixture were reported in (Table 4) and were compared with those obtained with the calculation previous described. The comparison is satisfactory. The log βH in aqueous medium were also collected in (Table 4). The values at I = 0.1 M are from, whereas the values at I = 0.05 M are calculated by way of a Debye-Huckel-type equation. Any chemical model developed in this paper is based on the set of protonation constants presented in with the integration currently obtained for L-lactic and succinic acids.
| Substance | 𝑖 | log𝛽𝐻𝑖(KCl 0.05 M) | log𝛽𝐻𝑖(KCl 0.1 M) | ||||
| EtOH 0% | EtOH 12% | EtOH 0% | EtOH 12% | ||||
| L-Lactate | 1 | 3.70(a) | 3.870 (3) | 3.81(b) | 3.66(c) | 3.830 (3) | 3.77(b) |
| Succinate | 1 | 5.319(a) | 5.49 (2) | 5.467(b) | 5.24(c) | 5.39 (2) | 5.38(b) |
| 2 | 9.347(a) | 9.68 (5) | 9.651(b) | 9.23(c) | 9.59 (3) | 9.53(b) | |
Table 4. Overall protonation constant values, as log𝛽𝐻𝑖, at two ionic strength values (0.05 and 0.1 M), 0% and 12% of ethanol, K+Cl−as background salt,𝑇=25°C. The uncertainty is reported in parentheses as standard deviation in the last significant digit.
Alkalimetric Titration of Wines
Table 5 reports pH, alcoholic grade and total acidity for each wine. CO2 was preliminarily removed by means of brief stirring under vacuum. The pH was measured on undiluted wines, at T = 25◦C, and expressed as –log [H+]. Wine was diluted 1: 20 (v/v) for total acidity measurement. During the alkalimetric titration of each wine, we found via potentiometric detection the first inflection point at about pH 7.5, as expected (Figure 2). The strong base used up to this flex allows the calculation of the total acidity parameter CH, fundamental in the chemical modelling step of this work. Conductometric data were also recorded, during the alkalimetric titrations of each wine. As in potentiometry, the derivative graph can be used to estimate the end point in the conductivity versus titrant volume curve. The estimations of the CH obtained by potentiometry and conductometry are in excellent agreement (Table 5).
| Wine | % vol. | pH | Total acidity as𝐶𝐻(mM) | Total acidity | |
| Potentiometric detection | Conductometric detection | as g/L Tartaric acid | |||
| C07 | 11.7 | 3.13 | 66.6 | 66 | 4.95 |
| C08 | 11.8 | 3.12 | 65.2 | 65.2 | 4.89 |
| E07 | 12.3 | 3.24 | 92.2 | 92.2 | 6.92 |
| E08 | 12.3 | 3.05 | 96 | 96 | 7.2 |
| Ch09 | 13.3 | 3.21 | 78.7 | 79.06 | 5.9 |
| R07 | 12.3 | 3.16 | 86.4 | 86.8 | 6.48 |
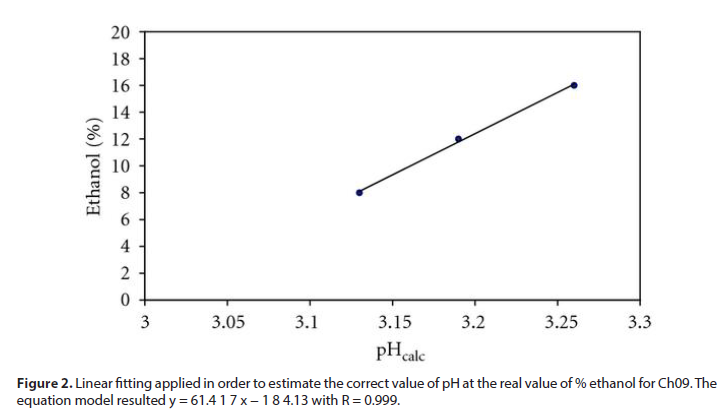
Figure 2: Linear fitting applied in order to estimate the correct value of pH at the real value of % ethanol for Ch09. The equation model resulted y = 61.4 1 7 x − 1 8 4.13 with R = 0.999.
Chemical Modelling
For each wine a chemical model can be built taking into account the analytical concentrations of any acid-base active substance analysed and the refined values of the protonation constants in the suitable chemical medium. As to current wines, a greater amount of SO2 is found with respect to red wines previously investigated.
Validation of the Chemical Model
The output based on the chemistry simulated by Model 3 also contains the ionic strength calculated for each wine. As shown in (Table 6), the mean value of the ionic strength is around 0.05 M, as that estimated for the red wines previously studied. The trend of the ionic strength with varying the pH in the range 3–6 follows that of the conductivity, indicating the consistency of our assumptions and the applicability of the chemical model optimized. Conductometric and pHmetric outputs show fruitful convergence experimentally proved by the measurement of the total acidity and comparable sensitivity with respect to our purposes of overall reliability and accuracy [10].
| Wine | % vol. | pH(expa) | pHcalc | |||
| Model 1 | Model 2 | Model 3 | Model 4 | |||
| EtOH 0%, KCl 0.05 M | EtOH 0%, KCl 0.1 M | EtOH 12%, KCl 0.05 M | EtOH 12%, KCl 0.1 M | |||
| C07 | 11.7 | 3.13 | 2.85 | 2.85 | 2.99 | 2.99 |
| C08 | 11.8 | 3.12 | 2.86 | 2.86 | 2.99 | 2.99 |
| E07 | 12.3 | 3.24 | 2.98 | 2.98 | 3.13 | 3.13 |
| E08 | 12.3 | 3.05 | 2.86 | 2.86 | 3 | 3 |
| Ch09 | 13.3 | 3.21 | 3.06 | 3.06 | 3.19/3.21 | 3.2 |
| R07 | 12.3 | 3.16 | 3.07 | 3.07 | 3.22 | 3.22 |
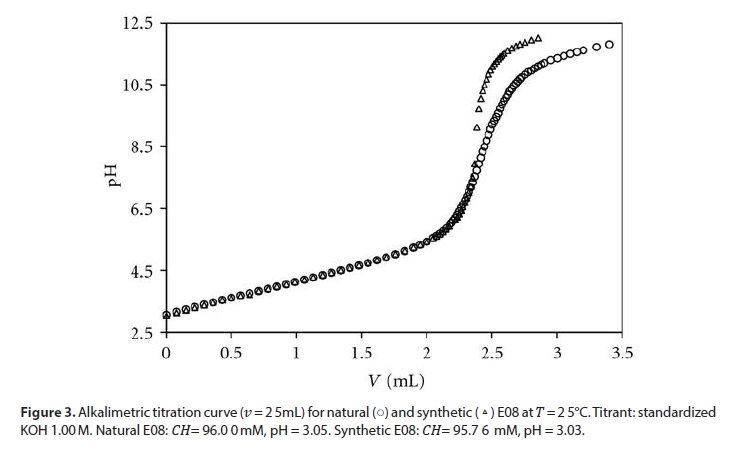
To reach an experimental confirmation of our model, a synthetic solution reproducing the composition of a wine, with respect to the acid-base reactivity, was prepared. A mixture of carboxylic acids, proline, inorganic anions and cations, ethanol, and water was achieved for E08, thus faithfully reproducing the content of bases and the values of CH, ionic strength, percentage of ethanol. The synthetic mixture was alkali metrically titrated, as the wines. Figure 3 shows the overlap of the titration curves for natural and synthetic E08 showing an excellent agreement up to pH 7. 4.
Conclusions
The use of multitechnique analytical and equilibrium measurements combined with a chemical modelling step allowed us to develop a thermodynamic approach to the acid-base chemistry of white wine. Since the chemical modelling is mainly based on the chemistry of carboxylic acids, particular attention was paid to quantify these substances. With respect to the past, we added HPLC-IEC to HPLC-RP to improve the characterization of the carboxylic fraction. We can observe that HPLC-RP and HPLC-IEC are complementary techniques: joining the separation ability reached with these two methods we are now able to quantify up to 12 carboxylic acids in wine. Conductometric results, together with the information obtained by the synthetic “wines”, contribute to validate our approach and assumptions. Switching from the analytical to the equilibrium composition allows the prediction of the effect on wines of oenological treatments or natural transformations. Many characteristics of wine, especially those related to the ageing process, are always dependent from acidbase conditions. Moreover, this investigation at molecular and thermodynamic level contributes to the basic knowledge, and the science presented in this paper can also be used as an input for model speciation building of other natural fluids.
References
- Adhikari HS, Yadav PN Anticancer activity of chitosan, chitosan derivatives,and their mechanism of action. Int J Biomater. 123,132-139 (2018).
- Ahmadi F, Oveisi Z, Samani SM et al. Chitosan based hydrogels: characteristics and pharmaceutical applications. Res Pharm Sci. 10, 1–16 (2015).
- Cadoni G, Giraldi L, Petrelli L et al. Prognostic factors in head and neck cancer: a 10-year retrospective analysis in a single-institution in Italy. Acta Otorhinolaryngol Ital. 37, 458-469 (2017).
- Cameron RE, Kamvari-Moghaddam A. Synthetic Bioresorbable Polymers. Physiol Behav. 43–66 (2008).
- Dourado MR, Korvala J, Cervigne NK et al. Extracellular vesicles derived from cancer-associated fibroblasts. (2019).
- Ayad EHE. Starter culture development for improving safety and quality of Domiati cheese. Food Microbiol. 26, 533–5419 (2015).
- Brown LM, Han AF. Traits of the metabolic syndrome alter corpulent obesity in LAN, SHR and DSS rats: Behavioral and metabolic interactions with adrenalectomy. Physiol Behav. 103, 98–103 (2011).
- Chobanian AV, Cushman L, Green E et al. The seventh report of the Joint National Committee on Prevention, Detection, Evaluation, and Treatment of High Blood Pressure. JAMA 289, 2560–2572 (2011).
- Civantos B, Aleixandre A. Blood pressure and α-vascular reactivity in hypertensive rats treated with amlodipine and dietary Ca Eur J Pharmacol. 489,101–110 (2004).
- Doggrell SA, Brown L. Rat models of hypertension, cardiac hypertrophy and failure. Cardiovasc Res. 39, 89–105 (1998).
Indexed at, Google Scholar, Crossref
Indexed at, Google Scholar, Crossref
Indexed at, Google Scholar, Crossref
Indexed at, Google Scholar, Crossref
Indexed at, Google Scholar, Crossref
Indexed at, Google Scholar, Crossref
Indexed at, Google Scholar, Crossref
Indexed at, Google Scholar, Crossref
