Research Article - Imaging in Medicine (2018) Volume 10, Issue 4
Efficacy Of ultrasonography and computed tomography in differentiating transudate from exudate in patients with pleural effusion
Ramya Chandra Bandaru* & N Rachegowda
Department of Radiodiagnosis, Sri Devraj Urs Medical College, Kolar, Karnataka, India
- *Corresponding Author:
- Ramya Chandra Bandaru
Department of Radiodiagnosis
Sri Devraj Urs Medical College
Kolar, Karnataka, India
E-mail: drramyachandra@gmail.com
Abstract
Purpose: To evaluate USG and CT imaging findings in differentiating transudative and exudative pleural effusion.
Materials and methods: A prospective observational study was performed over a period of eighteen months between January 2016 and June 2017. Eighty patients with pleural effusion were included and were evaluated with USG and CT along with diagnostic thoracocentesis. USG appearances and CT attenuation values along with additional findings like presence of pleural thickening, pleural nodules and loculation were evaluated.
Results: 24 (30%) were transudates and 56 (70%) were exudates. Transudative were always anechoic. Exudates were complex septated (62.5%), echogenic (25%) or complex non-septated (8.9%) on USG with very few being anechoic (3.5%). Loculations were better appreciated on ultrasound while pleural thickening and nodules were better seen on CT. Mean attenuation values were significantly higher in exudates (14.65 ± 6.07; mean ± SD, range: 4.5 to 34) than transudates (4.66 ± 2.29; mean ± SD, range: 1.3 to 8.2) with a P value <0.01. Effusions can be considered as transudative if the CT attenuation value is <8, with a sensitivity of 91.6% and specificity of 82.7% with a significant P value <0.01. Pleural thickening, nodules and loculations were seen commonly in exudates than transudates with a high specificity (91.6 %, 95.8% and 100% respectively).
Conclusion: USG is a helpful non-invasive and bedside tool in determining the nature of pleural effusion. CT attenuation values play a useful role in differentiating the nature of pleural effusion. Transudative effusions can be considered when HU values are <8.
Keywords
Pleural effusion ▪ Transudates ▪ Exudates
Introduction
Pleural effusion is a common clinical problem and can arise from many diseases [1-4]. The first step in assessing pleural effusion is to decide whether the pleural fluid is a transudate or an exudates. Transudate is caused by imbalances in hydrostatic and oncotic forces. It results from diseases such as heart failure, kidney failure, and cirrhosis. However, an exudate occurs when local factors influencing the accumulation of pleural fluid are altered. Exudates can be caused by clinical conditions such as pneumonia, malignancy, chylothorax and pulmonary embolism (PE) [1,4,5].
Several imaging methods such as conventional radiography, ultrasonography (USG), computerized tomography (CT) scan and magnetic resonance imaging (MRI) are being used to diagnose and assess the etiology of pleural effusion [6]. Ultrasonography is the most commonly used modality with higher accuracy in detecting pleural effusion in comparison with chest X-rays (93% vs. 47%) [7,8]. It has a much higher sensitivity than conventional radiology in the diagnosis of small amounts of effusion, nature of effusion [9] and differentiation of the loculated pleural fluid and the thickened pleura [5,7,10,11]. CT is frequently used to assess patients with pleural abnormalities associated with neoplasm, pneumonia, and empyema. It has better spatial resolution in detection of pleural nodules and pleural thickening, which help in discrimination of transudates and exudates [4].
Although clinical and radiological findings may provide significant evidence about the cause of pleural effusion, diagnostic thoracocentesis may still be necessary to evaluate some cases to differentiate the nature of pleural effusion using Lights criteria [12]. However, diagnostic thoracentesis is associated with certain complications like pain, hematoma, pneumothorax and splenic laceration and also has some relative contradictions such as coagulation disorders, inability of patient to cooperate and skin disease at the puncture site [1,3,13]. Although Light’s criteria are almost 100% sensitive for exudates, patients with heart failure on diuretics have also met Light’s criteria for an exudate resulting in poor specificity [12].
As there is paucity of literature regarding the use of USG, CT attenuations values and associated findings as an aid in characterizing pleural effusion in Indian subcontinent, evaluating such a non-invasive tool would be beneficial for patients with contraindications to invasive diagnostic methods and helps in further management. We evaluated the role of ultrasound and CT scan in differentiating transudative and exudative pleural effusion.
Materials and Methods
Individuals with clinically or radiographically suspected pleural effusion who were referred for ultrasonography and CT thorax to Department of Radiology at our centre were screened for the study. This prospective study included patients who underwent USG, CT thorax and thoracentesis between January 2016 and June 2017. Patients more than 18 years of age with pleural effusion and patients who have were willing to undergo USG and CT evaluation with diagnostic thoracocentesis were included in the study. Pregnant women, those with minimal pleural effusion and those with history of acute trauma were excluded. An informed consent was taken from individuals for their willingness to participate in the study.
USG and CT were performed in patients with pleural effusion. USG was performed using SIEMENS® ACUSON X300 in supine and sitting posture by both direct intercostal and abdominal approaches. Both curvilinear (2.2 – 5.0 MHz) and linear (4.7 – 8.0 MHz) transducers were used. CT was performed using SIEMENS® SOMATOM EMOTION 16 taken from the level of thoracic inlet to adrenal glands.
CT parameters used were axial sections of 5 mm thickness, kilovolt peak of 130 Kvp and milli ampere second was automatically adjusted according to the patient’s body habitus. Post study reconstructions were done at 1.5 mm in sagittal and coronal planes. Intra venous contrast material was not administered when renal function tests were abnormal, in patients with high risk for contrast nephropathy (dehydration, diabetes mellitus, etc.), in patients with an allergy to contrast material, or when the indication for CT did not necessitate the use of contrast material. IV contrast material was administered in 58 patients. In 54 patients, standard chest examination was performed after a standard injection protocol (100 mL of iopromide 300) and in 4 patients, an angiographic examination was performed with 120 mL of IV contrast material (iopromide 300). The image data were assessed on our Myrian® 64 1.18.1 software.
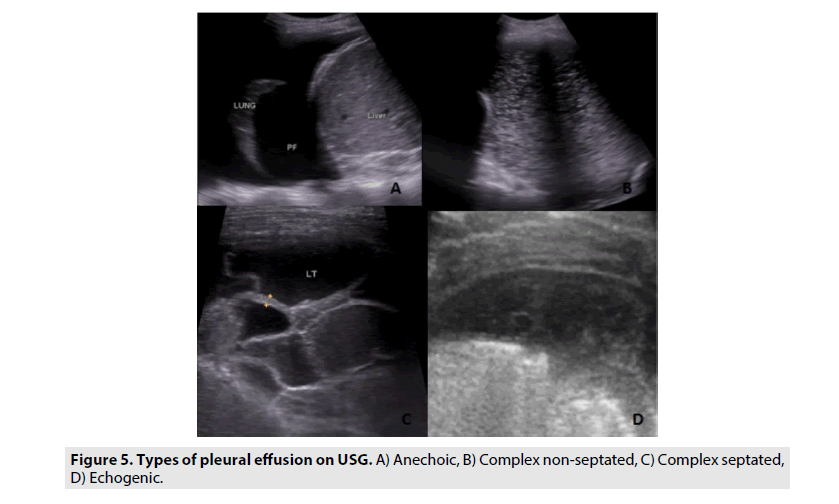
Imaging findings were correlated with biochemical and cytological analysis using Lights criteria which was considered the gold standard. Ultrasonography was performed by two experienced radiologists. They also reviewed the CT images. The radiologists were blinded to results of diagnostic thoracocentesis and they assessed the studies independently. The radiologists were however aware of the clinical history and probable diagnosis in all the patients. Each study was evaluated by both the radiologists in random order. The radiologists evaluated the studies with regard to location, extent, presence of loculations, pleural nodules, thickening and nature of pleural effusion on both USG and CT. On USG, pleural effusion are characterized into anechoic, complex non-septated, complex septated and echogenic effusions. The parietal pleura was measured and arbitrarily defined as thickened if the pleural thickness was 3 mm or greater. The pleural nodules were hypoechoic nodular lesions with defined margins located in the parietal or visceral pleura, while focal pleural thickenings were echogenic areas of increased thickness in the parietal pleura that had poorly defined margins.
On CT, an effusion was considered loculated when it showed septations, was compartmentalized or in nondependent portion of the pleura, or when it showed a convex shape. Otherwise, a concave shaped effusion in the dependent portion of the pleural space was classified as free pleural fluid. The presence of pleural nodules in the parietal or visceral pleura was also evaluated. CT scans were also evaluated for the presence of pleural thickening. Parietal pleural thickening was diagnosed only if a pleural line was visible internal in relation to the ribs. Visceral pleural thickening was diagnosed only if a pleural line was visible on the surface of the lung adjacent to the fluid and could be reliably differentiated from the compressed lung [1,14].
The mean value in Hounsfield units of an effusion was determined using a region of interest (area – 1 cm2) at the greatest quantity of fluid on CT images. The radiologist took care not to include adjacent ribs, lung parenchyma, or areas of pleural thickening. Probable etiology was recorded.
■ Statistical analysis
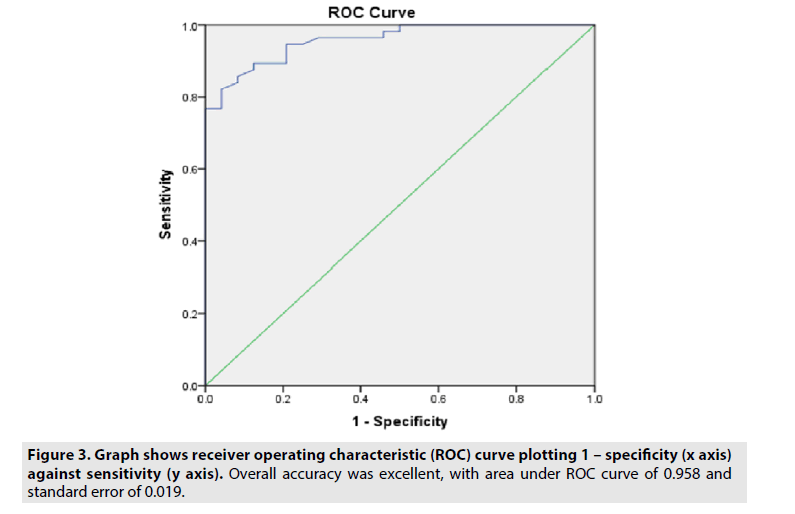
Data was recorded into Microsoft Excel and was analyzed using SPSS® software. The Pearson chi-square test was used to compare categorical variables between groups. Continuous data are described as mean value ± SD using independent t test. The difference between the mean attenuation values of transudates and exudates was evaluated using a Mann-Whitney test. A receiver operating characteristic (ROC) curve was constructed to determine the accuracy of attenuation values in the identification of exudates using the area under the ROC curve. The ROC curve was also used to determine the optimal threshold value to classify transudates and exudates on the basis of mean Hounsfield units.
The usefulness of each feature for identifying exudates and transudates was also evaluated by calculating the sensitivity, specificity, positive predictive value (PPV), and negative predictive value (NPV). A p value <0.05 was considered significant.
Results
A total of 112 patients were screened for the study between January 2016 and June 2017. Of which, 13 patients did not undergo computed tomography, 7 patients did not undergo diagnostic thoracocentesis, 5 had insufficient laboratory data to characterize their effusion according to Lights criteria and 7 patients had history of trauma and were excluded from the study. Finally, the study population constituted of 80 patients who underwent ultrasonography, CT and diagnostic thoracocentesis within 72 hours.
The study population constituted 52 males and 28 females (age range, 18–98 years; mean age, 53.2 years). According to Lights criteria, 24 of the 80 pleural effusions were transudates (30%) and 56 were exudates (70%). Transudative effusions were more often bilateral (87.5%) in comparison to exudative effusions which were unilateral (89.2%) with a significant p value of <0.01. Most of the pleural effusions were unilateral (66.7%) and more common on right side (75.4 %).
Pleural effusion arises from various etiologies (TABLE 1). They included malignant (18, 22%), infective (36,45%), congestive cardiac failure (9, 11%), chronic kidney disease (5,6%), acute pulmonary embolism (4,5%), cirrhosis (2,20%) and other causes (6,8%) e.g. anaemia, dengue fever.
| Parameter | Patients with Transudates (n=24) | Patients with exudates (n=56) |
|---|---|---|
| Age | 49.5 (22 -77) | 58 (18 -98) |
| Gender (M/F) | 14/10 | 38/18 |
| Anechoic | 24 (100%) | 2 (3.5%) |
| Complex non-septated | 0 | 5 (8.92%) |
| complex septated | 0 | 34 (62.5%) |
| Echogenic | 0 | 14 (25%) |
| Effusion size | large (1) moderate (10) small (13) |
large (16) moderate (31) small (9) |
| Loculations | 0 | 34 |
| Pleural thickening | 0 | 22 |
| Pleural nodules | 0 | 8 |
| Etiology | Congestive cardiac failure 9 Chronic kidney disease 5 Acute pulmonary embolism 2 Cirrhosis 2 Others 6 |
Malignant 18 Infective 36 Acute pulmonary embolism 2 |
Table 1. Demographic and USG findings in exudative and transudative effusions.
Of the infective effusion (n=36), 20 were parapneumonic effusions (56%), 12 complicated parapneumonic/empyema (33%), 2 hydropneumothorax (5.5%) and 2 pyopneumothorax (5.5%). About 12 patients had tuberculosis as infective agent and in the remaining 24 patients it was non-tubercular in origin. Of the 18 malignant effusions, 10 patients had carcinoma lung, 2 had gastric cancer, 1 had esophageal cancer, 1 malignant transformation of phylloides tumor, 1 carcinoma thyroid, 1 carcinoma ovary and 2 cases of mesothelioma. Out of 4 patients with pulmonary embolism, 2 patients had transudative effusion and 2 of them had an exudative effusion in our study. Pleural effusion arising from pulmonary embolism can give rise to exudate or transudate effusion as quoted in earlier study and was also seen in our study [12].
Most of the exudative effusions were complex septated (n=34, 62.5%), echogenic (n=14, 25%) or complex non-septated (n=5, 8.92%) on ultrasound with very few being anechoic (n=2, 3.5%). Transudative effusions were always anechoic (n=24, 100%) (TABLE 1). Transudative effusions were commonly smaller (n=13, 54.1%) to moderate (n=10, 41.6%) in size in comparison to exudates which were moderate (n=31,59.6%) to larger (n=16, 28%) in size both on USG and CT. Pleural thickening, pleural nodules and loculations were seen only in exudative effusions (n=34, 60.7%; n=22, 39.2%; n=8, 14.2%) and were not seen in any of the transudative effusions on USG (TABLES 1 and 2).
| Parameter | Patients with Transudates (n=24) |
Patients with exudates (n=56) |
P value |
|---|---|---|---|
| CT attenuation (HU) | 4.6 (1.3 – 8.2) | 14.6 (4.5 - 34) | <0.01 |
| Effusion size (mm) | 37.1 (17.6 - 106) | 75.9 (18.8 - 181) | - |
| Loculations | 0 | 21 | <0.01 |
| Pleural thickening | 2 | 35 | <0.01 |
| Pleural nodules | 1 | 11 | 0.03 |
Table 2. CT findings of patients with exudative and transudative effusions.
Loculations were better appreciated on ultrasound than CT. Pleural thickening and pleural nodules were better seen on CT compared to USG.
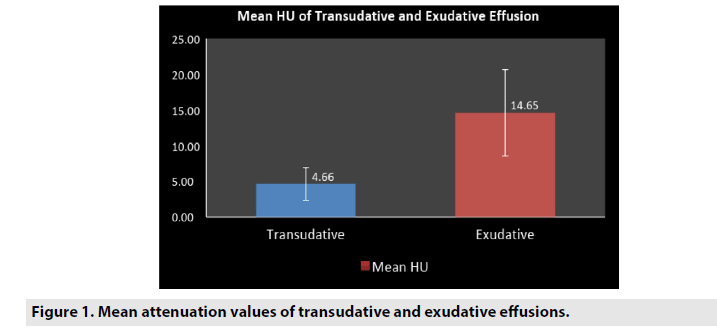
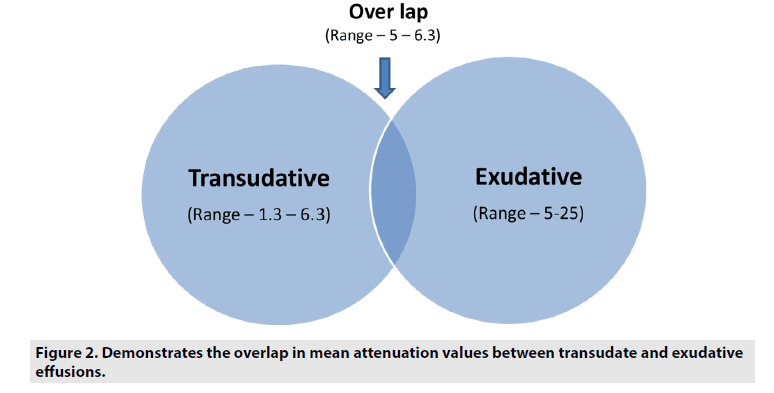
Pleural thickening were seen commonly in exudates than transudates with a sensitivity (62.5%), specificity (91.6%), PPV (94.5%), NPV (51.1%) with a P value <0.01. Pleural nodules were also more commonly seen in exudates than transudates with a sensitivity (19.6%), specificity (95.8%), PPV (91.6%), NPV (33.8%) with a P value 0.03. Loculations were seen only in exudates and were not seen any of the transudative effusions accounting for a sensitivity (35.5%), specificity (100%), PPV (100%), NPV (40.6%) with a P value <0.01. These findings yielded low sensitivity but were more specific (TABLES 2 and 3). Mean attenuation values were significantly higher in exudative (14.65 ± 6.07; mean ± SD, range: 4.5 to 34) effusions than transudates (4.66 ± 2.29; mean ± SD, range: 1.3 to 8.2) with a P value <.001. There is an overlap in the range of 4.5 to 8.2 (FIGURES 1 and 2).
| CT parameters | CT attenuation values <8 as cut off | Loculations | Pleural thickening | Pleural nodules |
|---|---|---|---|---|
| Sensitivity | 91.6 | 37.5 | 62.5 | 19.6 |
| Specificity | 82.7 | 100 | 91.6 | 95.8 |
| PPV | 73.3 | 100 | 94.5 | 91.6 |
| NPV | 96 | 40.6 | 51.5 | 33.8 |
| P value | <0.01 | <0.01 | <0.01 | 0.03 |
Table 3. Performance of CT parameters in differentiating exudates from transudates.
ROC curve was used to evaluate the accuracy of attenuation values in the identification of exudates with available attenuation values (FIGURE 3). Area under curve was 0.958 with 95% confidence interval 0.920-0.996 and standard error of 0.019. ROC curve showed a significant accuracy in differentiating exudates from transudates (p<0.01). Considering a cutoff point of 8 HU according to the ROC curve, we observed a sensitivity of 91.6%, specificity of 82.7%, PPV of 73.3% and NPV of 96%.
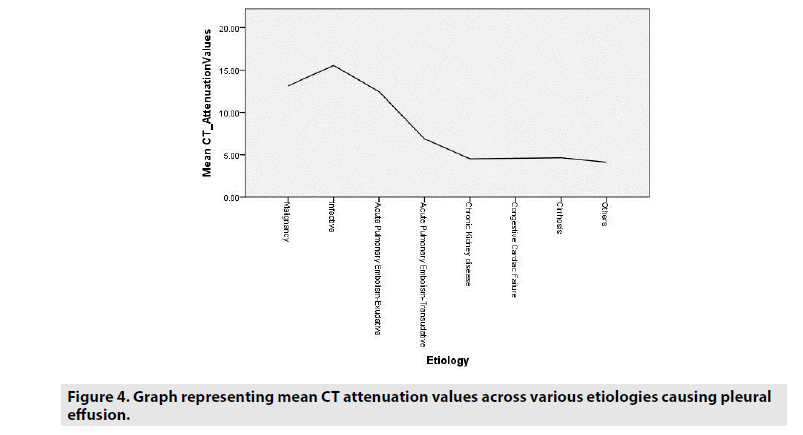
Mean attenuation values were also correlated with the etiologies of effusions and the attenuation values of the effusions of exudative origin were definitely higher in comparison to the etiologies of transudative effusions (FIGURE 4).
Although CT attenuation values show good sensitivity and specificity in differentiating pleural effusion, presence of loculations, pleural nodules, and thickening are more specific (TABLE 3).
On comparing the echopattern versus CT attenuation values, anechoic effusions showed much lower attenuation values than the other echo-patterns of effusion supporting the lower attenuation values observed in transudative effusion (TABLE 4).
| USG echopattern | CT mean attenuation values ± st. dev |
|---|---|
| Anechoic | 5.1 ± 3.05 |
| Complex non-septated | 11.9 ± 6.79 |
| Complex septated | 15.0 ± 4.77 |
| Echogenic | 14.9 ± 4.38 |
Table 4. Comparison between echo-pattern and Mean CT attenuation values of effusions.
Discussion
A distinction between transudative and exudative pleural effusion is crucial for establishing diagnosis and in management [2]. Both USG and CT have been indispensable tools in the diagnosis of pleural effusion.
■ Ultrasonography
The value of sonography for the detection of pleural lesions is well known [9,15]. Sonography is useful in localizing loculated or minimal effusion before thoracentesis [9,15,16]. As reported earlier, sonography is also helpful in determining the nature of pleural effusions [9,17]. Pleural effusion patterns can be subclassified as anechoic, complex non-septated, complex septated and homogeneously echogenic (FIGURE 5). Transudates are usually anechoic, whereas an anechoic effusion could be either a transudate or an exudate. Pleural effusions with complex septated, complex non-septated, or homogeneously echogenic patterns are always exudates (p<0.01). Not only can the internal echogenicity of a pleural effusion be visualized in more detail but the associated pleural thickening, nodules and parenchymal changes can be clearly depicted [5,9]. We found similar results in our study, with 100% of transudates being anechoic while this finding being observed in only 3.5% of exudative effusion.
In our series, the homogeneously echogenic effusions are seen in empyema, few malignant effusions and acute pulmonary embolism, similar to previous study by yang et al. [9]. The echogenic nature is probably due to the presence of a high content of tissue debris or blood in the pleural cavity [9,15].
As quoted earlier by yang et al. [9], thickened pleura and lung parenchymal changes are also indicative of exudates. The pleural nodules were seen mostly in malignant effusions with only one case seen in a patient with cirrhosis which was a benign nodule in their study. Fibrin strands and septa within a hypoechoic space are useful signs serving to distinguish pleural fluid from a solid mass. The fibrin strands tend to occur in effusions that are rich in protein, sometimes the septa were so profuse that they had a honeycomb appearance [9,15].
In our study, fibrin strands and septa were also seen commonly in all kinds of exudates, including empyema, PPF/CPE, and malignant pleural effusions [9]. Adding to it, pleural nodules and thickening were observed only in exudative effusions similar to previous study.
In addition to the useful diagnostic information provided by the sonograms, chest USG also can be used to guide a percutaneous transthoracic needle aspiration/ biopsy of the associated pleural and lung parenchymal lesions with high diagnostic yield [9,18]. Hence, USG is a useful diagnostic tool for determining the nature of pleural effusions which can further aid in the management.
■ Computed tomography
CT scan is not only a sensitive and specific tool for detecting pleural effusions, but it is also a useful tool for determining causes of effusions as well [2]. Several studies have attempted to evaluate the efficacy various computed tomographic parameters in differentiating transudative from exudative effusions which included mean attenuation values, presence of loculations, pleural thickening, and nodules. There was discrepancy in the results regarding the use of attenuation values between various studies [1,2,4,6,13,14,19].
■ Attenuation values
Previous studies revealed significantly higher mean CT attenuation value of exudates (8.1 - 17.1 HU), compared to transudates (3.5 - 12.5 HU) and the authors determined that they were moderately helpful in differentiating transudates from exudates [2,4,6,13,20]. This fact is in accordance with the mechanism of formation of transudates, which reflects an imbalance in the hydrostatic and osmotic pressures leading to an excess of pleural fluid, without the associated pleural disease that is present in exudative effusions [14]. Study by Abramowitz et al. found that the mean attenuation values of exudates (7.2 ± 9.4 HU) were lower than those of transudates (10.1 ± 6.9 HU; p=0.24), however the results were not statistically significant [1].
Our results were similar to the prior studies [2,4,6,13,20] which showed significantly higher mean attenuation values of exudates (14.65 ± 6.07), compared with the transudates (4.66 ± 2.29), P value <0.01. When the cut-off value for exudative effusions was accepted as >8, with a sensitivity of 91.6%, specificity of 82.7%, PPV of 73.3% and NPV of 96% with a significant P value <0.01.
Although the mean attenuation values of exudates were significantly higher than those of transudates, there is an overlap in the values. Hence, it is essential to interpret them in addition to other CT findings to characterize pleural effusions.
■ Additional CT findings
Previous studies reported that presence of pleural thickening, pleural nodules and loculations were highly specific for exudates [2,4,14,19] with one study stating that they were seen only in exudates [14]. Cullu et al. reported that, compared to transudates, exudates had a significantly higher frequency of loculations and pleural thickening [4]. However, Abramowitz et al. found pleural thickening and loculated pleural effusion in more than one-third of patients with transudates, which is not in line previous studies and they stated that presence of pleural thickening, pleural nodules and loculations were not reliable findings for characterizing pleural effusions [1].
In our study, pleural thickening, pleural nodules and loculations were commonly seen in patients with exudative effusion with a high specificity (91.6%, 95.8% and 100% respectively) keeping in line with the earlier studies.
■ Pleural thickening
Aquino et al. reported that pleural thickening was seen commonly in exudative effusions with a high a high specificity of 96% [19]. They found pleural thickening in only one case of transudative effusion, concluding that parietal pleural thickening at contrast-enhanced CT almost always indicates the presence of a pleural exudate. Similar results were reported by Waite et al. [21].
In our study, pleural thickening was seen commonly in exudates with a specificity of 91.6% (P value <0.01), and only in 2 cases of transudates similar to earlier studies [4,14,19,21].
■ Pleural nodules
Earlier studies also stated that pleural nodules were seen commonly in exudates with high specificity [2,4,13]. The presence of pleural nodules or nodular pleural thickening were the most sensitive and specific findings for the diagnosis of malignant pleural effusions [14].
In our study, pleural nodules were found commonly in exudative group with only one patient with transudative effusion showing a benign nodule. We found that this finding is associated with high specificity of 95.8% (P value <0.01), similar to earlier studies [2,14].
■ Loculations
Compared with transudative effusions, exudative effusions had significantly higher loculation [4,19]. Few studies found that loculations were seen only in exudates [14]. Other studies stated that this finding was associated with both exudates and transudates with equal distribution or with lower sensitivity and specificity [1,13].
We found 100% specificity with respect to presence of loculations in exudative effusions, similar to an earlier study [19]. Patients with transudative effusions had no septations and none of them demonstrated septations on USG as well, supporting earlier studies [9,14]
Our study had few limitations. First, the radiologists were aware of the clinical history and probable diagnosis. Second, this study contained small sample size of transudate effusions. Third, not all patients underwent contrast study which could have affected the evaluation of additional CT findings.
Conclusion
We conclude that ultrasonographic appearance of pleural effusion is very much helpful in distinguishing transudate from exudate, with transudative effusion being always anechoic (100%) contrary to exudates, which is seen only in minimal number of cases (3.5%). Other appearances, complex non-septated, complex septated and echogenic effusions are seen in only exudates. Mean attenuation values play a useful role in differentiating the nature of pleural effusions. According to our study, transudative effusions can be considered when HU values are less than 8 with sensitivity is with a sensitivity of 91.6%, specificity of 82.7%, PPV of 73.3% and NPV of 96%. Hence, diagnostic thoracocentesis which is associated with potential complications could be avoided in patients with pleural effusion with CT attenuation value <8.
Since there is overlap in HU values, correlation with additional CT findings like pleural thickening, pleural nodules and loculations which are more specific and show higher prevalence among exudative effusions is necessary.
References
- Abramowitz Y, Simanovsky N, Goldstein MS et al. Pleural effusion: characterization with CT attenuation values and CT appearance. Am. J. Roentgenol. 192, 618–623, (2009).
- Thiravi P, Juengsomrasong P, Thiravit S. Computed Tomography in Differential Diagnosis of Exudative and Transudative Pleural Effusions. Siriraj. Med. J. 69, 51–56, (2017).
- Bartter T, Santarelli R, Akers SM et al. The evaluation of pleural effusion. Chest. 106, 1209–1214, (1994).
- Çullu N, Kalemci S, Karakaş O et al. Efficacy of CT in diagnosis of transudates and exudates in patients with pleural effusion. Diag. Interv. Radiol. 20, 116–120 (2014).
- Ferreira AC, Mauadfilho F, Braga F et al. The role of ultrasound in the assessment of pleural effusion. Radiol. Bras. 39, 22–25, (2006).
- Rashid RJ, Jalili J, Arhami SS et al. The accuracy of chest computed tomography findings in differentiation of exudative from transudative pleural effusion. J. Clin. Anal. Med. 3, 341-344, (2015).
- Prina E, Torres A, Carvalho CRR. Lung ultrasound in the evaluation of pleural effusion. J. Bras. Pneumol. 40, 1-5, (2014).
- Lichtenstein D, Goldstein I, Mourgeon E et al. Comparative diagnostic performances of auscultation, chest radiography, and lung ultrasonography in acute respiratory distress syndrome. Anesthesiology. 100, 9-15, (2004).
- Yang PC, Luh KT, Chang DB et al. Value of sonography in determining the nature of pleural effusion: analysis of 320 cases. AJR. 159, 29-33 (1992).
- Eibenberger KL, Dock WI, Ammann ME et al. Quantification of pleural effusions: sonography versus radiography. Radiology. 191, 681–684, (1994).
- Gryminski J, Krakowa P, Lypacewicz G. The diagnosis of pleural effusion by ultrasonic and radiologic techniques. Chest. 70, 33–37, (1976).
- Porcel JM, Light RW. Diagnostic approach to pleural effusion in adults. Am. Fam. Physician.73, 1211-1220 (2006).
- Şafak KY, Tanju NU, Ayyıldız M et al. Efficacy of computed tomography (CT) attenuation values and CT Findings in the differentiation of pleural effusion. Pol. J. Radiol. 82, 100-105, (2017).
- Arenas JJ, Alonso CS, Sanchez PJ et al. Evaluation of CT findings for diagnosis of pleural effusions. Eur. Radiol. 10, 681–690, (2000).
- McLoud TC, Flower CDR. Imaging the pleura: sonography, CT, and MR imaging. AJR. 156, 1145-1153, (1991).
- Muller NL. Imaging of the pleura. Radiology. 186, 297-309, (1993).
- Hirsch JH, Rogers JV, Mack LA. Real-time sonography of pleural opacities. AJR. Am. J. Roentgenol. 136, 297–301, (1981).
- Chang DB, Yang PC, Luh KT et al. Ultrasound-guided pleural blopsy with tru-cut needle. Chest. 100, 328-333, (1991).
- Aquino SL, Webb WR, Gushiken BJ. Pleural exudates and transudates: diagnosis with contrast enhanced CT. Radiology. 192, 803–808, (1994).
- Nandalur KR, Hardie AH, Bollampally SR et al. Accuracy of computed tomography attenuation values in the characterization of pleural fluid: an ROC study. Acad. Radiol. 12, 987-991, (2015).
- Waite RJ, Carbonneau RJ, Balikian JP et al. Parietal pleural changes in empyema: appearances at CT. Radiology. 175, 145-150, (1990).
