Review Article - Imaging in Medicine (2011) Volume 3, Issue 6
Diffusion-tensor MRI-based skeletal muscle fiber tracking
Bruce M Damon*1,2,3,4,5, Amanda K W Buck1,2 & Zhaohua Ding1,2,3,5,61Institute of Imaging Science, Vanderbilt University, Nashville, TN, USA
2Department of Radiology & Radiological Sciences, Vanderbilt University, Nashville, TN, USA
3Department of Biomedical Engineering, Vanderbilt University, Nashville, TN, USA
4Department of Molecular Physiology & Biophysics, Vanderbilt University, Nashville, TN, USA
5Program in Chemical & Physical Biology, Vanderbilt University, Nashville, TN, USA
6Department of Electrical Engineering & Computer Science, Vanderbilt University, Nashville, TN, USA
- Corresponding Author:
- Bruce M Damon
Institute of Imaging Science
Vanderbilt University, Nashville, TN, USA
Tel: +1 615 322 8355
Fax: +1 615 322 0734
E-mail: bruce.damon@vanderbilt.edu
Abstract
A skeletal muscle’s function is strongly influenced by the internal organization and geometric properties of its fibers, a property known as muscle architecture. Diffusion-tensor MRI-based fiber tracking provides a powerful tool for noninvasive muscle architecture studies, has 3D sensitivity and uses a fixed frame of reference. Significant advances have been made in muscle fiber tracking technology, including defining seed points for fiber tracking, quantitatively characterizing muscle architecture, implementing denoising procedures, and testing validity and repeatability. Some examples exist of how these data can be integrated with those from other advanced MRI and computational methods to provide novel insights into muscle function. Perspectives are offered regarding future directions in muscle diffusion-tensor imaging, including needs to develop an improved understanding for the microstructural basis for reduced and anisotropic diffusion, establish the best practices for data acquisition and analysis, and integrate fiber tracking with other physiological data.
Keywords
DTI ▪ DT-MRI ▪ microstructure ▪ muscle mechanics ▪ muscle physiology ▪ pennation ▪ striated muscle ▪ tractography
Background
The principal mechanical functions of muscle are generating force and actuating movement. A muscle’s ability to perform and sustain these functions is influenced by structural properties spanning spatial scales ranging more than eight orders of magnitude. The aim of this article is to describe an MRI-based approach for studying skeletal muscle structure at intermediate spatial scales based on measurements of water diffusion (diffusion-tensor [DT] MRI muscle fiber tracking). In the remainder of the first section, we discuss the importance of muscle structure to muscle function. In the sections titled ‘DT-MRI’, ‘DT-MRI of skeletal muscle’ and ‘Future perspective’, we discuss the structural influences on water self-diffusion in muscle; describe DT-MRI and its application to muscle; and show examples of how these data can be related to muscle function.
■ Skeletal muscle structure & its importance to function
For this review, we will consider three levels of biological organization: molecular–cellular, tissue– organ and in vivo. The in vivo scale is the top level of the muscle structural hierarchy and is characterized by a muscle’s placement within the body. A muscle extends from a point or region of origin to a point of insertion; in most cases, either the muscle or its tendon crosses a joint. The origin and insertion define the muscle force’s line of action. Muscles that cross joints will generate a torque about that joint and cause a rotation of body segments; the nature of this rotation (flexion, extension, etc.) depends on the anatomical relationship between the origin, insertion and skeleton.
At the other extreme of the hierarchy lies the molecular–cellular level of organization. It is structural properties at this scale that allow inferences about cell geometry to be made from measurements of water diffusion. Human skeletal muscle fibers range from approximately 4 to 40 cm long [1] and are oblate polygons in cross-section [2], ranging from approximately 20 to 90 μm across (mean: 55 μm [3]). They are bounded by a plasma membrane; notably, the membrane has a finite permeability to water (estimated at 13 × 10-4 cm/s in [4]). Around the fibers is the extracellular matrix.
Most of a fiber’s volume is occupied by the contractile protein filaments (myofibrils) and the water internal to and around them. Myofibrils consist of serially arranged microscopic structures termed sarcomeres, which are the smallest functional units of muscle contraction. The myofibrils are aligned parallel to the long axis of the fiber and are surrounded by an organelle termed the sarcoplasmic reticulum (SR). Each sarcomere is 2–3 μm long and consists of interdigitating protein filaments, referred to as the thick and thin filaments. In cross-section, the protein filaments are spaced tens of nm apart. A molecular interaction between actin on the thin filament and myosin of the thick filament – triggered by the release of Ca2+ from the SR – results in force production. Protein connections between the myofibrils and the extracellular matrix provide structural integrity and a mechanism for force transmission.
Between the individual fibers and the whole muscle, intermediate levels of structural organization exist. Groups of 100–200 fibers are contained with connective tissue structures termed fascicles. In some muscles, fascicles often have a somewhat oblate profile [5]. Like the fibers and the whole muscle, fascicles are surrounded by a connective tissue matrix.
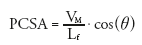
Muscle architecture is the term used to describe the internal arrangement and geometric properties of a muscle’s fibers. Muscle architecture varies among muscles and has been reviewed elsewhere [6,7]; only some highlights are provided here. A basic distinction in muscle architecture is between fusiform and pennate muscles. In a fusiform muscle, the fibers’ longitudinal axes are generally parallel to the muscle’s line of action; per unit volume, this architecture results in more sarcomeres in series. When sarcomeres in series contract, their displacements add; thus, fusiform architectures favor high length excursions [8] and shortening velocities [9]. In pennate muscles, the fibers run obliquely to the muscle’s line of action; this places more sarcomeres in parallel. When sarcomeres in parallel contract, their forces add; so pennate architectures favor high force production. The effect of muscle architecture on force production is quantified using the physiological cross-sectional area (PCSA):
 (1)
(1)
where VM is the muscle volume, Lf is the fiber length, and q (the pennation angle) is the angle formed by the local tangents to the muscle fiber’s longitudinal axis and the tendon of insertion. The PCSA is better correlated with peak isometric force production than anatomical cross- sectional area [10].
Muscle volume, fiber length and pennation thus influence a muscle’s ability to generate force and actuate movement. In addition, properties such as muscle fiber curvature, architectural heterogeneity and connective tissue distribution influence other aspects of muscle contraction. For example, several theoretical works have illustrated the potential for fiber curvature to generate fluid pressure gradients between the concave and convex surfaces of the fiber and for these gradients to summate across muscle layers [11–13]. Since intramuscular fluid pressures during isometric contractions can be quite high [14,15], these gradients may affect intramuscular perfusion patterns. Miura et al. have provided empirical evidence consistent with this prediction [16]. Also, many studies have observed intramuscular heterogeneity in strain development during contraction [17–21] due, perhaps, to intramuscular heterogeneity in architectural patterns [22,23] and connective tissue distribution and/or material properties [24–26].
■ Traditional approaches to studying skeletal muscle architecture
We first consider two traditional approaches to studying muscle architecture. The first, cadaver dissection, allows VM, muscle mass, q, and fiber and/or fascicle length to be measured. This approach allows for the development of comprehensive databases [1,27] and allows parameters, such as fascicle length, to be related to structural parameters, such as sarcomere length [1], which is a critical determinant of the force potential of a muscle [28]. To measure muscle architectural parameters in vivo and observe dynamic changes in these parameters during contractions, imaging approaches are used. Brightness-mode (B-mode) ultrasound (US) imaging has been used for approximately 20 years for this purpose [29]. There have been hundreds of implementations of US imaging for muscle architecture measurements; most have used 2D imaging methods, with just a few studies of which we are aware that have used 3D imaging [30–32]. US has been used to make fascicle length, curvature and pennation measurements in the resting and contracting states (e.g., [33–36]), and to measure aponeurosis tendon, and muscle fiber strains during contraction (e.g., [37,38]); it is well suited for high temporal resolution measurements of muscle–tendon dynamics. The MRI methods that we describe below require more time to implement than US, but they also offer several advantages over US. These include the use of a fixed frame of reference, 3D sensitivity and the ability to integrate the architectural data with a wide range of other physiological measurements. A limitation of all noninvasive in vivo imaging methods is their inability to measure sarcomere length.
DT-MRI
■ Diffusion-weighted & DT-MRI
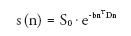
Diffusion-weighted (DW) MRI and DT-MRI are important methods for studying tissue structure, and have been reviewed extensively elsewhere [39–41]. This section of the review highlights the most fundamental issues and their relationship to skeletal muscle. DW-MRI was envisioned in Lauterbur’s paper introducing MRI [42] and first implemented in 1985 [43,44]. It detects the Brownian motion of water molecules. Most implementations of DW-MRI use the Stejskal-Tanner pulsed-gradient spin-echo sequence [45], which uses a pair of magnetic field gradients to encode diffusion as a reduction in spin-echo amplitude. The first gradient creates phase dispersion among the protons’ magnetic moments, and the second gradient restores phase coherence. Ignoring relaxation processes, the restoration of phase is complete for stationary water molecules and incomplete for diffusing water molecules. The latter effect causes the MRI signal, S, to decay exponentially with a scalar diffusion coefficient D and characteristic parameters of diffusion gradient pulses that include timing, amplitude and geometry (collectively expressed as the b-factor):
 (2)
(2)
where S0 is the baseline MR signal measured without diffusion-sensitizing gradients.
Water diffusion in tissues such as brain white matter and striated muscles exhibits directional dependence, also known as diffusion anisotropy, because of greater hindrances to water diffusion perpendicular to the fiber axis than along it. Diffusion anisotropy can be detected by DT-MRI , proposed around the mid-1990s by Basser et al. [46]. With DT-MRI, MR signals are measured by applying diffusion-sensitizing gradients along at least six noncollinear directions,
 (3)
(3)
where D is a diffusion tensor, n is the direction of a diffusion-sensitizing gradient, and T denotes matrix transposition. A measurement of S0 is also obtained, and D is solved using ordinary least squares regression, weighted least squares regression or curve-fitting methods.
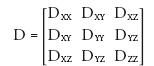
Mathematically, D is a 3 × 3, positive-definite symmetric matrix containing diffusion coefficients in the X, Y, Z and off-diagonal directions:
 (4)
(4)
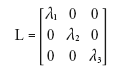
Diagonalization of D yields a 3 × 3 diagonal matrix, L:
 (5)
(5)
where λ is an eigenvalue and the subscripts specify the eigenvalues in order of descending magnitude. The eigenvalues are the diffusion coefficients along the fiber (largest eigenvalue) and perpendicular to the fiber (second and third eigenvalues). Diagonalization of D also yields a 3 × 3 matrix, V:
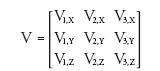 (6)
(6)
where v is an eigenvector, the subscripted numbers indicate correspondence to an eigenvalue in L, and the subscripted letters indicate the X, Y and Z components of the (unit length) eigenvector. The first eigenvector indicates the direction of greatest diffusion (i.e., it corresponds to the largest eigenvalue); likewise, the second and third eigenvectors specify the directions associated with the second and third eigenvalues, respectively. Together, the eigenvalue and eigenvector matrices characterize the profile of water diffusion that includes the dominant direction and diffusion anisotropy. As the diffusion profile is intimately coupled with local tissue structure, DT-MRI can be used to probe tissue microstructure and architecture noninvasively in vivo [40].
■ DT-MRI -based fiber tracking
The unique capability of DT-MRI to characterize tissue microstructure and architecture has allowed it to gain rapid and widespread applications in basic science and clinical research [47]. One of the most interesting and important applications of DT-MRI is the connectivity mapping of fibrous tissue, often referred to as DT-MRI-based fiber tractography [48]. In the simplest form, this technique tracks fibers by integrating v1 at each voxel location, leading to 3D descriptions of the fiber trajectories [49,50]. Typically, fiber tracking is launched from preselected seed points, and proceeds sequentially along the direction of v1 until certain termination criteria, such as maximum curvature or minimum diffusion anisotropy, are met. Since these provocative works, a variety of novel fiber tracking techniques have been advocated, with the primary aim to ameliorate the confounding effects of imaging artifacts, especially imaging noise [51–53] and partial volume averaging [54]. These techniques can be categorized into deterministic [41,55–57] and probabilistic [58–62] approaches. While deterministic fiber tractography provides a binary answer to the problem of whether or not two points in tissue are connected, probabilistic tractography defines the probability of connections by computing connection density maps. More recently, several tractography techniques based on the notion of global optimization have been proposed [63–67]. These techniques essentially find fiber pathways between two points in tissue that are smooth in trajectory and consistent with the tensor data acquired.
Although these tractography developments were made for white matter applications, noise and partial volume averaging are problems in skeletal muscle tractography as well. Thus, these algorithms may have some applicability in skeletal muscle, and indeed, a few preliminary results comparing tracking algorithms have been presented that suggest improvements can be made over simple integrations of v1 [68,69]. A systematic investigation of the benefits and drawbacks of these algorithms, with validation based on a quantitative comparison of DT-MRI fiber tract and actual muscle fascicle positions, is a necessary step in skeletal muscle tractography methods development.
DT-MRI of skeletal muscle
■ Reduced & anisotropic diffusion in skeletal muscle
For at least 40 years, it has been known that the self-diffusion coefficient of water in skeletal muscle fibers is lower than the value for free water [70]. The hypotheses proposed for this reduction have included an action of the myofibrils and other intracellular solid phase proteins as physical barriers to water translation; the finite permeability of the cell membrane to water; and the binding of water to solid-phase macromolecules, dissolved macromolecules and ions with smaller diffusion coefficients than that for free water [70–73]. As noted, the typical sarcomere longitudinal dimension (2–3 μm) is much greater than the interfilament spacing in the transverse direction (~30 nm), and the overall cell geometry is also highly elongated. Therefore, if membranous and intracellular protein structures present significant barriers to water diffusion, then their greater spatial frequency in the transverse direction than in the longitudinal direction should cause the diffusion of water to be anisotropic [71,72].
Although the study by Finch et al. did not find evidence for substantially anisotropic diffusion [70], a later study by Cleveland et al. reported that the diffusion coefficient parallel to a skeletal muscle fiber’s long axis is approximately 40% greater than the diffusion coefficient perpendicular to the fiber’s long axis (D⊥) [74]. Anisotropic water diffusion in skeletal muscle was subsequently confirmed using the tensor model [46]. Importantly, in a model of muscle inflammation, Fan and Does [75] observed greater diffusion anisotropy in a more slowly diffusing, short transverse relaxation time (T2) water component (the presumptive intracellular component) than in a more rapidly diffusing, long T2 water component (the presumptive interstitial water compartment).
When extending the Cleveland et al. result to the tensor model, one would predict that the direction indicated by v1 should coincide with the long axis of the fiber. Van Donkelaar et al. and Napadow et al. observed correspondences between v1 and the histology-determined fiber direction in skeletal muscle [76,77]. In cardiac muscle, which has myofibrils similar in structure to those of skeletal muscle, Hsu et al. and Scollan et al. each observed a quantitative correspondence between v1 and the histology-observed fiber orientation [78,79]. Collectively, the above points support the conclusion that the self-diffusion of intramyocellular water is anisotropic and its tensor’s first eigenvector is coincident with the long axis of the muscle fiber. It is these properties that allow DT-MRI fiber tracking to be used to represent skeletal muscle architecture.
Analyzing transverse water diffusivity reveals additional insight into the causes of reduced and anisotropic diffusion in skeletal muscle and may have applications in studies of muscle injury, disease, microstructure and mechanics. Tanner [80] measured apparent D⊥ values as a function of diffusion times (td) ranging from 0.3 ms to 2.4 s and found that D⊥ decreased monotonically from approximately 1.6 × 10⁻⁵ cm2/s to an asymptote of approximately 1 × 10⁻⁵ cm2/s. In calf tongue, Kim et al. observed a similar dispersion in λ2 and λ3 across td values ranging from 32 to 800 ms [81]. It is likely that the initial reduction in λ2 and λ3 at short td values results from interactions of water with the myofibrillar proteins, with additional reductions at longer td values caused by an increasing number of interactions between water and the plasma membrane.
There are data to suggest that λ2, λ3 and their eigenvectors have distinct microstructural bases in skeletal muscle: some [82,83] (although not all [84]) studies have observed differential behavior of λ2 and λ3 with muscle elongation, and Heemskerk et al. observed different time courses for λ2 and λ3 changes following femoral artery ligation injury to murine muscle [85]. Also, several studies have reported an ordered distribution of v2 and v3 within individual muscles [86–88]. However, a definitive structural basis for λ2/v2 and λ3/v3 has yet to be concluded. Possible explanations include an oblate fiber cross-section producing different intracellular diffusion coefficients [85,89], intermediate scale structural features, such as oblate fascicle cross-sections [5], and intra- versus extra- cellular diffusion coefficients, the latter occurring in a sheet-wise direction [90,91]. Resolving questions about the extent and nature of transverse diffusion anisotropy is important because transverse diffusivities are altered in response to muscle damage [85,92,93], because of the relationships among transverse diffusivities and cell size [81,94], and because of the correspondence between certain mechanical properties of muscle contraction and v2 of the diffusion tensor [87], as discussed further below.
■ Technical challenges & special considerations in muscle DT-MRI
Fiber tracking in skeletal muscle suffers many of the difficulties associated with fiber tracking in other organs, and is also subject to unique challenges. Addressing the challenges that arise in each step of the process from acquisition to fiber tract analysis increases the likelihood of generating useful, unbiased data. In the following sections, we discuss these challenges and some strategies for optimizing fiber tract quality, focusing on problems that are particularly relevant to muscle fiber tractography; however, general DT-MRI is fraught with difficulties, and for an overview of these, we recommend the informative article by Jones and Cercignani [95].
Data acquisition
Motion artifacts are potentially a source of error in DT-MRI, and pulse sequence selection, good subject positioning and restricting subject motion mitigate these effects. Rapid imaging sequences, such as single-shot echoplanar imaging (EPI), are typically used, as the images are essentially bulk motion-insensitive. To minimize scan time further, parallel imaging methods, such as sensitivity encoding [96], allow faster acquisitions. When imaging the lower leg, we use an MRI-compatible foot restraint/ force measurement system to provide consistent, motion-limited positioning and control plantarflexion/dorsiflexion angle [97]. To achieve a similar result, Sinha et al. and Froeling et al. have described scaffold systems for the leg and forearm, respectively [86,98].
Diffusion is encoded as a reduction in signal magnitude, and the amount of this signal attenuation depends in part on the b-value. Consequently, the signal-to-noise ratio (SNR) and b-value have interactive effects on the estimation of D. Low SNR values result in particularly erroneous estimation of λ1, λ3, fractional anisotropy and v1 [51–53]. In muscle, the SNR requirements for accurate tensor estimation (enumerated below) are lowest in the range of b = 435–725 s/mm2. Outside this range, for a given SNR level, tensor estimation becomes less accurate and less precise [53]. The b-values were optimized experimentally for human subjects at 1.5 T [99] with results generally consistent with these simulation predictions. Although obtaining sufficient SNR is a challenge in all DT-MRI, the short T2 of muscle exacerbates these problems. Using larger voxels will increase SNR; however, in areas of partial volume artifact, this becomes problematic in fiber tracking. Another approach to increasing SNR is to increase the number of diffusion-encoding directions or excitations for signal averaging purposes, but subject motion and/or discomfort may make this less feasible when imaging large muscles or when studying patient populations. Additionally, Levin et al. [100] and Sinha et al. [101] have reported favorable results using denoising approaches for muscle DT-MRI. It is important to note, however, that Damon’s simulations [53] demonstrated that for fiber-tracking purposes, obtaining SNR greater than 60 for b = 435 s/mm2 or greater than 80 for other values of b = 290–1015 s/mm2 does not significantly reduce error in estimating v1, and the higher SNR can be exploited for other purposes (e.g., reducing voxel dimensions or reducing gradient strength requirements; the former reducing partial volume averaging and the latter reducing eddy current-induced distortions in the images).
Another key image quality parameter is the homogeneity of the static magnetic field, B0. One consequence of B0 inhomogeneity is spatial distortions in single-shot EPI data. In addition, adipose tissue results in severe chemical shift artifacts in single-shot EPI data, primarily from the methyl and olefinic resonances. Several methods (saturation and adiabatic inversion recovery radio frequency pulses, water-selective radio frequency pulses, and slice-selection gradient reversal [102]) are available to reduce the artifact from the methyl resonance, and Hernando et al. presented an echo-shifted approach for reducing the olefinic fat signal [103]. The efficacy of any fat suppression method is negatively affected by B0 inhomogeneity. As a general approach to optimizing B0 homogeneity, we typically acquire several ‘packets’ of 10–12 slices, allowing each packet to be shimmed separately using second order shim terms; this is helpful because the musculoskeletal system often presents with irregular geometries that are difficult to shim. In addition, Froeling et al. have recently implemented B0 inhomogeneity-induced distortions correction based on field mapping [104].
Postprocessing & fiber tracking approaches
Owing to the subject motion between scans and eddy current- and B0 inhomogeneity-induced distortions in the EPI data, registration is necessary within the data set. Typically, DW images are registered to the b = 0 image of the diffusion data set using an affine transformation or other nonrigid registration method, and the diffusion data are registered to the anatomical images. When transforming the diffusion data, it is crucial that the underlying b-value matrix also be transformed; otherwise, fiber orientation and quantitative diffusion parameter estimates are affected [105].
Since DT-MRI data generally have course spatial resolution, anatomical images are acquired as part of the scan protocol and used to define boundary conditions for fiber tracking. A problem that we [Damon et al. Unpublished Observations] and others [106] have noted is that when using planar regions of interest to define seed points, it may not be possible to track all of a muscle’s fibers (because not all the fibers pass through that plane). However, the aponeurosis (the muscle’s internal tendon and the structure into which the fibers insert and through which most of their force is transmitted) of the muscle can be digitized, meshed and used to define the fiber tracking seed points (Figure 1) [97]. As noted, most currently published muscle fiber tracking studies have used v1 integration to determine fiber tract direction. Tract propagation then proceeds until the muscle boundaries are reached or some property of the data (such as excessive curvature or very low or high diffusion anisotropy) suggests that the indicated directions cannot be trusted. This process continues for every point in the mesh; a typical result is shown in Figure 2. Heemskerk et al. presented a framework for evaluating stop criteria in fiber tracking and for quantifying fiber tract outcomes [107].

Figure 1: Sample reconstruction of the aponeurosis mesh, showed at reduced sampling density for illustrative purposes. The reconstruction is based on manual digitization of the aponeurosis’ position in high-resolution structural images. Points of intersection along the mesh are used as the seed points for fiber tracts. Reproduced with permission from [97].
Figure 2: Sample fiber tracking result. The blue structure represents the aponeurosis, now reconstructed at high resolution; the green lines are fiber tracts of the superficial muscle compartment; and the gold lines are fiber tracts in the deep muscle compartment. Reproduced with permission from [109].
The tracts and the aponeurosis mesh are each described at high spatial resolution. Consequently, these data can be used to determine muscle architectural information. Fiber tract length (Lft) measurements, analogous to fascicle length measurements in US imaging, are made by summing the distances between tract points over the entire tract [107]. Pennation angle can be measured by extending the methods used in 2D US imaging to the 3D space in MRI [97]; the plane tangent to the seed point and its normal unit vector are calculated. (To calculate the plane tangent to the seed point, tangent lines to the seed point are first defined in the row and column directions of the mesh. Two lines that intersect at a point define a plane. The Cartesian equations for the lines can thus be used to define the Cartesian equation for the plane, and from this the normal unit vector.) Then, position vectors are drawn between the seed point and points along the fiber tract. Pennation angle is defined as the complement to the angle formed by the normal unit vector and each position vector. To reduce errors due to image noise, the values from the first five fiber tract points are averaged [107]. Damon et al. demonstrated the validity of DT-MRI-based θ measurements by comparing them with the values obtained by direct anatomical inspection [108]. Heemskerk et al. analyzed the repeatability of Lft and q measurements and the underlying diffusion data [109]. They observed generally high reliability coefficients for architectural measurements in regions of the muscle with relatively large axial cross-sections (and thus few partial volume artifacts); also, there were no intersession significant differences in the mean values of the diffusivities, Lft, and θ. From these data, they concluded that the data are sufficiently repeatable for measuring practically significant alterations in muscle architecture [109]. Other groups have presented the repeatability of their imaging/analysis protocols [98,110]. Froeling et al. [98] reported generally higher intraclass correlation coefficient’s for the diffusion data than Heemskerk et al. did [109], most likely because Froeling et al. pooled the data from two muscles that evidently have different diffusion characteristics. Recently, Damon et al. described methods for measuring fiber tract curvature accurately, after fitting fiber tract positions to quadratic functions [111].
■ Applications of DT-MRI to studies of skeletal muscle structure & function
Since the initial demonstration of the feasibility of using DT-MRI fiber tracking as a basis for the noninvasive, in vivo measurement of muscle architecture [108], the applications of this method have expanded. The approach has been used to describe the structure of a variety of muscles and to investigate muscle mechanics in the active state.
Diffusion MRI-based fiber tracking has been used to assess muscle structure in animal muscles, including the rat gastrocnemius [108], the mouse hindlimb [106], and the bovine tongue [112]. In their study of the mouse hindlimb, Heemskerk et al. also calculated the PCSA as the dot product of a measured anatomical cross-sectional area and the fiber direction [106] (it should be noted that, like other in vivo imaging-based assessments, this calculation did not normalize fiber lengths based on sarcomere length). DT-MRI-based fiber tracking has also been performed in a variety of human muscles, including the plantarflexor [86,101,110,113], tibialis anterior [97,107,109], forearm [100], thigh [114–116] and female pelvic floor [117] muscles. Fiber tracking has been used to study structural alterations to the genioglossus muscle due to an oral appliance [118] and to investigate the effects of chronic lateral patella dislocation, the latter study demonstrating larger lateral force vectors in patients than in controls [115]. Each of these locations within the body presents unique challenges with regard to shimming, subject positioning, radiofrequency coil type and placement.
Our studies of the tibialis anterior muscle provide one example of the potential for DT-MRI to produce new insights into muscle structure. Lansdown et al. observed a heterogeneous spatial distribution of θ, with larger values in the superior part of the muscle than in the inferior part [97]. This finding had not been previously reported in the 2D US literature [36,119], although a 3D US study had observed such heterogeneity [30]. Analyzing muscle and aponeurosis orientations within the laboratory’s frame of reference revealed the source of the heterogeneity: while the entire muscle’s fibers were consistently oriented, the aponeurosis’s orientation within the axial plane changed [97]. An important point is that by using imaging methods with 3D sensitivity and a fixed frame of reference, pennation heterogeneity was observed and explained [97]. These observations concerning q have been repeated and extended to demonstrate also the existence of heterogeneity in Lft [109,120]. In preliminary reports, Heemskerk et al. also observed q and curvature to decrease and Lft to increase upon muscle elongation [120,121]. Schwenzer et al. [84] and Sinha et al. [101] have reported changes in v1 orientations in the laboratory frame of reference due to muscle lengthening that were consistent with changes in θ. Together, these data support the conclusions that DT-MRI and DT-MRI-based fiber tracking can detect predictable changes in muscle architecture and can provide new insights into muscle architecture not obtainable via 2D imaging methods or via methods that do not use a fixed frame of reference.
While the studies so far have focused heavily on methods development and basic studies of skeletal muscle structure, there have been a few instances of using DT-MRI-based fiber tracking in concert with other methods to predict and investigate muscle mechanics in the active state. Muscle deforms as it contracts and this deformation can be characterized by a strain tensor. Felton et al. used DT-MRI to assess the lingual architecture and phase contrast MRI (PC-MRI) to measure strain rates within the tongue during swallowing, allowing them to correlate the architecture of the intrinsic and extrinsic lingual muscles with the tongue’s deformation during swallowing [122]. Also, Englund et al. used spatial tagging images to form a 3D strain tensor associated with isometric contraction of the tibialis anterior muscle [87]. Diagonalizing the strain tensor resulted in one negative strain (denoted εN) and one positive strain (εP). The direction corresponding to εN was closely associated with, but differed from, the fiber direction (as represented by v1). Interestingly, the direction corresponding to εP was associated with, but differed from, v2; this finding makes it important to identify the structural bases of λ2/v2 and λ3/v3 in skeletal muscle. Finally, Levin et al. presented a method for building musculoskeletal models from DT-MRI data based on the generation of a fixed number of fiber tracts per muscle [123]. These initial efforts illustrate the potential for obtaining new insights into muscle function by combining functional MRI or other computational methods and the muscle architectural information obtainable via DT-MRI.
Future perspective
In the next 10 years, we expect that progress will have been made in: resolving issues concerning the conduct and interpretation of diffusion measurements in muscle, and answering important questions in muscle biology by integrating DT-MRI and other methods.
■ Remaining issues in skeletal muscle diffusion MRI
We anticipate significant advances with regard to understanding the structural basis of reduced and anisotropic water diffusion in skeletal muscle. Some specific questions to be answered concern the quantitative contributions of the myofibrils, SR, plasma membrane and other structures the tensor’s eigenvalues, and how these contributions depend on diffusion time, gradient strength, echo time and other pulse sequence parameters. We expect that clear microstructural bases for λ2 and λ3 will have been established. One approach that may be fruitful in resolving these issues is structurebased, Monte Carlo-type simulation of water diffusion in muscle, similar to those previously performed for phosphocreatine [124] and Ca2+ [125] diffusion, in order to make predictions and conduct sensitivity analyses. In addition, the use of genetic models or other experimental procedures to manipulate putative diffusion- restricting structures will be important methods for model testing. The importance of resolving these questions is evident in the alteration to transverse diffusivities that result from muscle damage [85,92,93] and in the correspondence between εP and v2 of the diffusion tensor [87].
Also, we anticipate that a full understanding of the best practices with regard to data acquisition and analysis will have been developed. Some of the specific issues to be resolved include optimal acquisition protocols across a variety of muscles, ideal denoising protocols, fiber tracking algorithms (including histologybased validation), and practices for analyzing data from voxels in which there is more than one principal axis of diffusion. This last point is pertinent when voxels cross muscle boundaries or in voxels occupied by both muscle and fat. In this case, more robust methods based on high-angular resolution diffusion imaging [126,127] reconstructions may need to be used. Recently, Parker et al. have implemented highangular resolution diffusion imaging in skeletal muscle and have shown that it can serve as the basis of automated fiber tracking in the facial muscles [128], illustrating both the feasibility and promise of this approach.
■ Future applications to muscle biology
The successful resolution of these issues, along with continued advances in integrating DT-MRI fiber tracking data with the information available from other MR methods (such as arterial spin labeling, blood-oxygenation leveldependent contrast, mechanical strain analysis and MR spectroscopy), will permit new questions to be asked and answered in skeletal muscle physiology. Muscle structural, physiological and mechanical alterations have been demonstrated in a variety of human conditions, such as aging [129–133]. The integrative approach afforded by combining muscle architectural, physiological, mechanical and metabolic information from a variety of MR modalities will be very informative in addressing multifactorial problems such as this. Challenges will exist in controlling for the many structural and physiological properties that influence muscle function, in acquiring data with sufficient precision so as to prevent excessive error propagation, and in analyzing the large datasets that will result from combining the data from several imaging modalities. However, we predict that the comprehensive and integrative approach will yield important new insights into the physiology and mechanics of skeletal muscle.
Acknowledgements
The authors thank their collaborators and colleagues for helpful discussions and scientific contributions to their previous work: Adam Anderson, PhD, Mark Does, PhD, Andrea Freyer, MD, Daniel Gochberg, PhD, John Gore, PhD, Anneriet Heemskerk, PhD, Herman Kan, MD, Drew Lansdown, MD, Jane Park, PhD, Tuhin Sinha, PhD and Kevin Wilson, MS.
Financial & competing interests disclosure
This work was supported by grants from the National Institute of Arthritis and Musculoskeletal and Skin Diseases, NIH: F32 AR F32 AR08614 (inactive), R01 AR050101 (active), and R01 AR050791 (active). The authors have no other relevant affiliations or financial involvement with any organization or entity with a financial interest in or financial conflict with the subject matter or materials discussed in the manuscript apart from those disclosed.
No writing assistance was utilized in the production of this manuscript.
References
- Ward SR, Eng CM, Smallwood LH, Lieber RL. Are current measurements of lower extremity muscle architecture accurate? Clin. Orthop. Relat. Res. 467(4), 1074–1082 (2009).
- Aquin L, Lechner AJ, Sillau AH, Banchero N. Analysis of the shape changes of muscle fiber cross sections in guinea pigs raised at 22 degrees C and 5 degrees C. Pflugers Arch. 385(3), 223–228 (1980).
- Polgar J, Johnson MA, Weightman D, Appleton D. Data on fibre size in thirty-six human muscles: an autopsy study. J. Neurol. Sci. 19(3), 307–318 (1973).
- Landis CS, Li X, Telang FW et al. Equilibrium transcytolemmal water-exchange kinetics in skeletal muscle in vivo. Magn. Reson. Med. 42(3), 467–478 (1999).
- Sharafi B, Blemker SS. A micromechanical model of skeletal muscle to explore the effects of fiber and fascicle geometry. J. Biomech. 43(16), 3207–3213 (2010).
- Lieber RL, Friden J. Functional and clinical significance of skeletal muscle architecture. Muscle Nerve 23(11), 1647–1666 (2000).
- Lieber RL, Friden J. Clinical significance of skeletal muscle architecture. Clin. Orthop. Relat. Res. (383), 140–151 (2001).
- Winters TM, Takahashi M, Lieber RL, Ward SR. Whole muscle length-tension relationships are accurately modeled as scaled sarcomeres in rabbit hindlimb muscles. J. Biomech. 44(1), 109–115 (2011).
- Bodine SC, Roy RR, Meadows DA et al. Architectural, histochemical, and contractile characteristics of a unique biarticular muscle: the cat semitendinosus. J. Neurophysiol. 48(1), 192–201 (1982).
- Powell PL, Roy RR, Kanim P, Bello MA, Edgerton VR. Predictability of skeletal muscle tension from architectural determinations in guinea pig hindlimbs. J. Appl. Physiol. 57(6), 1715–1721 (1984).
- Otten E. Concepts and models of functional architecture in skeletal muscle. Exerc. Sport Sci. Rev. 16, 89–137 (1988).
- Van Leeuwen JL, Spoor CW. Modelling mechanically stable muscle architectures. Philos. Trans. R. Soc. Lond. B Biol. Sci. 336(1277), 275–292 (1992).
- Van Leeuwen JL, Spoor CW. Modelling the pressure and force equilibrium in unipennate muscles with in-line tendons. Philos. Trans. R. Soc. Lond. B Biol. Sci. 342(1302), 321–333 (1993).
- Hill AV. The pressure developed in muscle during contraction. J. Physiol. 107(4), 518–526 (1948).
- Sejersted OM, Hargens AR, Kardel KR, Blom P, Jensen O, Hermansen L. Intramuscular fluid pressure during isometric contraction of human skeletal muscle. J. Appl. Physiol. 56(2), 287–295 (1984).
- Miura H, Mccully K, Nioka S, Chance B. Relationship between muscle architectural features and oxygenation status determined by near infrared device. Eur. J. Appl. Physiol. 91(2–3), 273–278 (2004).
- Pappas GP, Asakawa DS, Delp SL, Zajac FE, Drace JE. Nonuniform shortening in the biceps brachii during elbow flexion. J. Appl. Physiol. 92(6), 2381–2389 (2002).
- Finni T, Hodgson JA, Lai AM, Edgerton VR, Sinha S. Nonuniform strain of human soleus aponeurosis-tendon complex during submaximal voluntary contractions in vivo. J. Appl. Physiol. 95(2), 829–837 (2003).
- Finni T, Hodgson JA, Lai AM, Edgerton VR, Sinha S. Mapping of movement in the isometrically contracting human soleus muscle reveals details of its structural and functional complexity. J. Appl. Physiol. 95(5), 2128–2133 (2003).
- Lee HD, Finni T, Hodgson JA, Lai AM, Edgerton VR, Sinha S. Soleus aponeurosis strain distribution following chronic unloading in humans: an in vivo MR phase-contrast study. J. Appl. Physiol. 100(6), 2004–2011 (2006).
- Shin DD, Hodgson JA, Edgerton VR, Sinha S. In vivo intramuscular fascicleaponeuroses dynamics of the human medial gastrocnemius during plantarflexion and dorsiflexion of the foot. J. Appl. Physiol. 107(4), 1276–1284 (2009).
- Blemker SS, Pinsky PM, Delp SL. A 3D model of muscle reveals the causes of nonuniform strains in the biceps brachii. J. Biomech. 38(4), 657–665 (2005).
- Chi S-W, Hodgson J, Chen J-S et al. Finite element modeling reveals complex strain mechanics in the aponeuroses of contracting skeletal muscle. J. Biomech. 43(7), 1243–1250
- Maas H, Baan GC, Huijing PA, Yucesoy CA, Koopman BH, Grootenboer HJ. The relative position of EDL muscle affects the length of sarcomeres within muscle fibers: experimental results and finite-element modeling. J. Biomech. Eng. 125(5), 745–753 (2003).
- Yucesoy CA, Koopman BH, Baan GC, Grootenboer HJ, Huijing PA. Effects of interand extramuscular myofascial force transmission on adjacent synergistic muscles: assessment by experiments and finite-element modeling. J. Biomech. 36(12), 1797–1811 (2003).
- Yucesoy CA, Koopman BH, Huijing PA, Grootenboer HJ. Three-dimensional finite element modeling of skeletal muscle using a two-domain approach: linked fiber-matrix mesh model. J. Biomech. 35(9), 1253–1262 (2002).
- Wickiewicz TL, Roy RR, Powell PL, Edgerton VR. Muscle architecture of the human lower limb. Clin. Orthop. Relat. Res. (179), 275–283 (1983).
- Gordon AM, Huxley AF, Julian FJ. The variation in isometric tension with sarcomere length in vertebrate muscle fibres. J. Physiol. 184(1), 170–192 (1966).
- Rutherford OM, Jones DA. Measurement of fibre pennation using ultrasound in the human quadriceps in vivo. Eur. J. Appl. Physiol. Occup. Physiol. 65(5), 433–437 (1992).
- Hiblar T, Bolson E, Hubka M, Sheehan F, Kushmerick M. Three dimensional ultrasound analysis of fascicle orientation in human tibialis anterior muscle enables analysis of macroscopic torque at the cellular level. In: Molecular and Cellular Aspects of Muscle Contraction. Sugi H (Ed.) Springer, New York, NY, USA, 635–645 (2003).
- Weinstein MM, Jung S-A, Pretorius DH, Nager CW, Den Boer DJ, Mittal RK. The reliability of puborectalis muscle measurements with 3-dimensional ultrasound imaging. Am. J. Obstet. Gynecol. 197(1), 68.e1–e6 (2007).
- Kurihara T, Oda T, Chino K, Kanehisa H, Fukunaga T. Use of three-dimensional ultrasonography for the analysis of the fascicle length of human gastrocnemius muscle during contractions. Int. J. Sport Health Sci. 3, 226–234 (2005).
- Fukunaga T, Ichinose Y, Ito M, Kawakami Y, Fukashiro S. Determination of fascicle length and pennation in a contracting human muscle in vivo. J. Appl. Physiol. 82(1), 354–358 (1997).
- Ito M, Kawakami Y, Ichinose Y, Fukashiro S, Fukunaga T. Nonisometric behavior of fascicles during isometric contractions of a human muscle. J. Appl. Physiol. 85(4), 1230–1235 (1998).
- Muramatsu T, Muraoka T, Kawakami Y, Shibayama A, Fukunaga T. In vivo determination of fascicle curvature in contracting human skeletal muscles. J. Appl. Physiol. 92(1), 129–134 (2002).
- Maganaris CN, Baltzopoulos V. Predictability of in vivo changes in pennation angle of human tibialis anterior muscle from rest to maximum isometric dorsiflexion. Eur. J. Appl. Physiol. Occup. Physiol. 79(3), 294–297 (1999).
- Maganaris CN, Paul JP. Load-elongation characteristics of in vivo human tendon and aponeurosis. J. Exp. Biol. 203(Pt 4), 751–756 (2000).
- Lopata RGP, Van Dijk JP, Pillen S et al. Dynamic imaging of skeletal muscle contraction in three orthogonal directions. J. Appl. Physiol. 109(3), 906–915
- Le Bihan D. Molecular diffusion nuclear magnetic resonance imaging. Magn. Reson. Q. 7(1), 1–30 (1991).
- Le Bihan D, Mangin JF, Poupon C et al. Diffusion tensor imaging: concepts and applications. J. Magn. Reson. Imaging 13(4), 534–546 (2001).
- Lazar M, Weinstein DM, Tsuruda JS et al. White matter tractography using diffusion tensor deflection. Hum. Brain Mapp. 18(4), 306–321 (2003).
- Lauterbur PC. Image formation by induced local interactions. Examples employing nuclear magnetic resonance. Nature (242), 190–191 (1973).
- Merboldt KD, Hanicke W, Frahm J. Diffusion imaging using stimulated echoes. Magn. Reson. Med. 19(2), 233–239 (1991).
- Taylor DG, Bushell MC. The spatial mapping of translational diffusion coefficients by the NMR imaging technique. Phys. Med. Biol. 30(4), 345–349 (1985).
- Stejskal E, Tanner J. Spin diffusion measurements: spin echoes in the presence of a time-dependent field gradient. J. Chem. Phys. 42, 288–292 (1965).
- Basser PJ, Mattiello J, Lebihan D. MR diffusion tensor spectroscopy and imaging. Biophys. J. 66(1), 259–267 (1994).
- Lazar M. Mapping brain anatomical connectivity using white matter tractography. NMR Biomed. 23(7), 821–835 (2010).
- Mori S, Van Zijl PC. Fiber tracking: principles and strategies – a technical review. NMR Biomed. 15(7–8), 468–480 (2002).
- Mori S, Crain BJ, Chacko VP, Van Zijl PC. Three-dimensional tracking of axonal projections in the brain by magnetic resonance imaging. Ann. Neurol. 45(2), 265–269 (1999).
- Basser PJ, Pajevic S, Pierpaoli C, Duda J, Aldroubi A. In vivo fiber tractography using DT-MRI data. Magn. Reson. Med. 44(4), 625–632 (2000).
- Basser PJ, Pajevic S. Statistical artifacts in diffusion tensor MRI (DT-MRI) caused by background noise. Magn. Reson. Med. 44(1), 41–50 (2000).
- Anderson AW. Theoretical analysis of the effects of noise on diffusion tensor imaging. Magn. Reson. Med. 46(6), 1174–1188 (2001).
- Damon BM. Effects of image noise in muscle diffusion tensor (DT)-MRI assessed using numerical simulations. Magn. Reson. Med. 60(4), 934–944 (2008).
- Alexander AL, Hasan KM, Lazar M, Tsuruda JS, Parker DL. Analysis of partial volume effects in diffusion-tensor MRI. Magn. Reson. Med. 45(5), 770–780 (2001).
- Poupon C, Clark CA, Frouin V et al. Regularization of diffusion-based direction maps for the tracking of brain white matter fascicles. Neuroimage 12(2), 184–195 (2000).
- Parker GJ, Wheeler-Kingshott CA, Barker GJ. Estimating distributed anatomical connectivity using fast marching methods and diffusion tensor imaging. IEEE Trans. Med. Imaging 21(5), 505–512 (2002).
- Lu Y, Aldroubi A, Gore JC, Anderson AW, Ding Z. Improved fiber tractography with Bayesian tensor regularization. Neuroimage 31(3), 1061–1074 (2006).
- Hagmann P, Thiran JP, Jonasson L et al. DTI mapping of human brain connectivity: statistical fibre tracking and virtual dissection. Neuroimage 19(3), 545–554 (2003).
- Lazar M, Alexander AL. Bootstrap white matter tractography (BOOT-TRAC). Neuroimage 24(2), 524–532 (2005).
- Friman O, Farneback G, Westin CF. A Bayesian approach for stochastic white matter tractography. IEEE Trans. Med. Imaging 25(8), 965–978 (2006).
- Behrens TE, Berg HJ, Jbabdi S, Rushworth MF, Woolrich MW. Probabilistic diffusion tractography with multiple fibre orientations: what can we gain? Neuroimage 34(1), 144–155 (2007).
- Mishra A, Anderson AW, Wu X, Gore JC, Ding Z. An improved Bayesian tensor regularization and sampling algorithm to track neuronal fiber pathways in the language circuit. Med. Phys. 37(8), 4274–4287 (2010).
- Jbabdi S, Woolrich MW, Andersson JL, Behrens TE. A Bayesian framework for global tractography. Neuroimage 37(1), 116–129 (2007).
- Iturria-Medina Y, Canales-Rodríguez EJ, Melie-García L et al. Characterizing brain anatomical connections using diffusion weighted MRI and graph theory. Neuroimage 36(3), 645–660 (2007).
- Kreher BW, Mader I, Kiselev VG. Gibbs tracking: a novel approach for the reconstruction of neuronal pathways. Magn. Reson. Med. 60(4), 953–963 (2008).
- Zalesky A. DT-MRI fiber tracking: a shortest paths approach. IEEE Trans. Med. Imaging 27(10), 1458–1471 (2008).
- Wu X, Xu Q, Xu L, Zhou J, Anderson AW, Ding Z. Genetic white matter fiber tractography with global optimization. J. Neurosci. Methods 184(2), 375–379 (2009).
- Damon BM, Ding Z, Anderson AW. Development of DT-MRI muscle fiber tracking algorithms. In: The International Society for Magnetic Resonance in Medicine 16th Annual Meeting. Toronto, ON, Canada, 3–9 May 2008.
- Gharibans AA, Johnson CL, Chen DD, Georgiadis JG. The effect of diffusion tensor imaging SNR on skeletal muscle tractography. In: The International Society for Magnetic Resonance in Medicine 19th Annual Meeting. Montreal, QC, Canada, 2011.
- Finch ED, Harmon JF, Muller BH. Pulsed NMR measurements of the diffusion constant of water in muscle. Arch. Biochem. Biophysic. 147(1), 299–310 (1971).
- Rorschach HE, Chang DC, Hazlewood CF, Nichols BL. The diffusion of water in striated muscle. Ann. NY Acad. Sci. 204, 445–452 (1973).
- Chang DC, Rorschach HE, Nichols BL, Hazlewood CF. Implications of diffusion coefficient measurements for the structure of cellular water. Ann. NY Acad. Sci. 204, 434–443 (1973).
- Clark ME, Burnell EE, Chapman NR, Hinke JA. Water in barnacle muscle. IV. Factors contributing to reduced selfdiffusion. Biophys. J. 39(3), 289–299 (1982).
- Cleveland GG, Chang DC, Hazlewood CF, Rorschach HE. Nuclear magnetic resonance measurement of skeletal muscle: anisotropy of the diffusion coefficient of the intracellular water. Biophys. J. 16(9), 1043–1053 (1976).
- Fan R, Does M. Compartmental relaxation and diffusion tensor imaging measurements in vivo in l-carrageenan-induced edema in rat skeletal muscle. NMR Biomed. 21(6), 566–573 (2007).
- Van Donkelaar CC, Kretzers LJ, Bovendeerd PH et al. Diffusion tensor imaging in biomechanical studies of skeletal muscle function. J. Anat. 194 ( Pt 1), 79–88 (1999).
- Napadow VJ, Chen Q, Mai V, So PT, Gilbert RJ. Quantitative analysis of threedimensional- resolved fiber architecture in heterogeneous skeletal muscle tissue using NMR and optical imaging methods. Biophys. J. 80(6), 2968–2975 (2001).
- Hsu EW, Muzikant AL, Matulevicius SA, Penland RC, Henriquez CS. Magnetic resonance myocardial fiber-orientation mapping with direct histological correlation. Am. J. Physiol. 274(5 Pt 2), H1627–H1634 (1998).
- Scollan DF, Holmes A, Winslow R, Forder J. Histological validation of myocardial microstructure obtained from diffusion tensor magnetic resonance imaging. Am. J. Physiol. 275(6 Pt 2), H2308–H2318 (1998).
- Tanner JE. Self diffusion of water in frog muscle. Biophys. J. 28(1), 107–116 (1979).
- Kim S, Chi-Fishman G, Barnett AS, Pierpaoli C. Dependence on diffusion time of apparent diffusion tensor of ex vivo calf tongue and heart. Magn. Reson. Med. 54(6), 1387–1396 (2005).
- Hatakenaka M, Matsuo Y, Setoguchi T et al. Alteration of proton diffusivity associated with passive muscle extension and contraction. J. Magn. Reson. Imaging 27(4), 932–937 (2008).
- Heemskerk AM, Sinha TK, Wilson KJ, Damon BM. Change in water diffusion properties with altered muscle architecture. In: Proceedings of the International Society for Magnetic Resonance in Medicine 19th Annual Meeting. Toronto, ON, Canada (2008) (Abstract 1787).
- Schwenzer NF, Steidle G, Martirosian P et al. Diffusion tensor imaging of the human calf muscle: distinct changes in fractional anisotropy and mean diffusion due to passive muscle shortening and stretching. NMR Biomed. 22(10), 1047–1053 (2009).
- Heemskerk AM, Strijkers G, Drost M, Van Bochove G, Nicolay K. Skeletal muscle degeneration and regeneration following femoral artery ligation in the mouse: diffusion tensor imaging monitoring. Radiology 243(2), 413–421 (2007).
- Sinha S, Sinha U, Edgerton VR. In vivo diffusion tensor imaging of the human calf muscle. J. Magn. Reson. Imaging 24(1), 182–190 (2006).
- Englund EK, Elder CP, Xu Q, Ding Z, Damon BM. Combined diffusion and strain tensor MRI reveals a heterogeneous, planar pattern of strain development during isometric muscle contraction. Am. J. Physiol. Regul. Integr. Comp. Physiol. 300(5), R1079–R1090 (2011).
- Chen D, Georgiadis J, Gharibans A, Johnson CS. Reconstruction of 3-D fabric structure and fiber nets in skeletal muscle via in vivo DTI. In: Int. Soc. Magn. Reson. Med. 19th Annual Meeting. Montreal, QC, Canada, 2011.
- Karampinos D, King K, Sutton B, Georgiadis J. Myofiber ellipticity as an explanation for transverse asymmetry of skeletal muscle diffusion MRI in vivo signal. Ann. Biomed. Eng. 37(12), 2532–2546 (2009).
- Galban CJ, Maderwald S, Uffmann K, Ladd ME. A diffusion tensor imaging analysis of gender differences in water diffusivity within human skeletal muscle. NMR Biomed. 18(8), 489–498 (2005).
- Galban CJ, Maderwald S, Uffmann K, De Greiff A, Ladd ME. Diffusive sensitivity to muscle architecture: a magnetic resonance diffusion tensor imaging study of the human calf. Eur. J. Appl. Physiol. 93(3), 253–262 (2004).
- Heemskerk AM, Drost MR, Van Bochove GS, Van Oosterhout MF, Nicolay K, Strijkers GJ. DTI-based assessment of ischemia-reperfusion in mouse skeletal muscle. Magn. Reson. Med. 56(2), 272–281 (2006).
- Zaraiskaya T, Kumbhare D, Noseworthy MD. Diffusion tensor imaging in evaluation of human skeletal muscle injury. J. Magn. Reson. Imaging 24(2), 402–408 (2006).
- Saotome T, Sekino M, Eto F, Ueno S. Evaluation of diffusional anisotropy and microscopic structure in skeletal muscles using magnetic resonance. Magn. Reson. Imaging 24(1), 19–25 (2006).
- Jones DK, Cercignani M. Twenty-five pitfalls in the analysis of diffusion MRI data. NMR Biomed. 23(7), 803–820 (2010).
- Pruessmann KP, Weiger M, Scheidegger MB, Boesiger P. SENSE: sensitivity encoding for fast MRI. Magn. Reson. Med. 42(5), 952–962 (1999).
- Lansdown DA, Ding Z, Wadington M, Hornberger JL, Damon BM. Quantitative diffusion tensor MRI-based fiber tracking of human skeletal muscle. J. Appl. Physiol. 103(2), 673–681 (2007).
- Froeling M, Oudeman J, Van Den Berg S et al. Reproducibility of diffusion tensor imaging in human forearm muscles at 3.0 T in a clinical setting. Magn. Reson. Med. 64(4), 1182–1190 (2010).
- Saupe N, White LM, Stainsby J, Tomlinson G, Sussman MS. Diffusion tensor imaging and fiber tractography of skeletal muscle: optimization of B value for imaging at 1.5 T. Am. J. Roentgenol. 192(6), W282– W290 (2009).
- Levin DI, Gilles B, Madler B, Pai DK. Extracting skeletal muscle fiber fields from noisy diffusion tensor data. Med. Image Anal. 15(3), 340–353 (2011).
- Sinha U, Sinha S, Hodgson JA, Edgerton VR. Human soleus muscle architecture at different ankle joint angles from magnetic resonance diffusion tensor imaging. J. Appl. Physiol. 110(3), 807–819 (2011).
- Nagy Z, Weiskopf N. Efficient fat suppression by slice-selection gradient reversal in twice-refocused diffusion encoding. Magn. Reson. Med. 60(5), 1256–1260 (2008).
- Hernando D, Karampinos DC, King KF et al. Removal of olefinic fat chemical shift artifact in diffusion MRI. Magn. Reson. Med. 65(3), 692–701 (2011).
- Froeling M, Nederveen AJ, Drost MR, Nicolay K, Strijkers GJ. Towards a general approach for skeletal muscle DTI acquisition and post-processing. In: International Society for Magnetic Resonance in Medicine 19th Annual Meeting. Montreal QC, Canada, 2011.
- Leemans A, Jones DK. The B-matrix must be rotated when correcting for subject motion in DTI data. Magn. Reson. Med. 61, 1336–1349 (2009).
- Heemskerk AM, Strijkers GJ, Vilanova A, Drost MR, Nicolay K. Determination of mouse skeletal muscle architecture using three-dimensional diffusion tensor imaging. Magn. Reson. Med. 53(6), 1333–1340 (2005).
- Heemskerk AM, Sinha TK, Wilson KJ, Ding Z, Damon BM. Quantitative assessment of DTI-based muscle fiber tracking and optimal tracking parameters. Magn. Reson. Med. 61(2), 467–472 (2009).
- Damon BM, Ding Z, Anderson AW, Freyer AS, Gore JC. Validation of diffusion tensor MRI-based muscle fiber tracking. Magn. Reson. Med. 48(1), 97–104 (2002).
- Heemskerk AM, Sinha TK, Wilson KJ, Ding Z, Damon BM. Repeatability of DTI-based skeletal muscle fiber tracking. NMR Biomed. 23(3), 294–303 (2010).
- Sinha S, Sinha U. Reproducibility analysis of diffusion tensor indices and fiber architecture of human calf muscles in vivo at 1.5 Tesla in neutral and plantarflexed ankle positions at rest. J. Magn. Reson. Imaging 34(1), 107–119 (2011).
- Damon BM. Muscle architecture measurements from DT-MRI fiber tracking: tract smoothing and voxel size considerations. In: International Society for Magnetic Resonance in Medicine 19th Annual Meeting. Montreal, QC, Canada, 2011.
- Gilbert RJ, Wedeen VJ, Magnusson LH et al. Three-dimensional myoarchitecture of the bovine tongue demonstrated by diffusion spectrum magnetic resonance imaging with tractography. Anat. Rec. A Discov. Mol. Cell Evol. Biol. 288(11), 1173–1182 (2006).
- Okamoto Y, Kunimatsu A, Kono T, Kujiraoka Y, Sonobe J, Minami M. Gender differences in MR muscle tractography. Magn. Reson. Med. Sci 9(3), 111–118 (2010).
- Budzik JF, Le Thuc V, Demondion X, Morel M, Chechin D, Cotten A. In vivo MR tractography of thigh muscles using diffusion imaging: initial results. Eur. Radiol. 17(12), 3079–3085 (2007).
- Kan JH, Heemskerk AM, Ding Z et al. DTI-based muscle fiber tracking of the quadriceps mechanism in lateral patellar dislocation. J. Magn. Reson. Imaging 29(3), 663–670 (2009).
- Kermarrec E, Budzik JF, Khalil C, Le Thuc V, Hancart-Destee C, Cotten A. In vivo diffusion tensor imaging and tractography of human thigh muscles in healthy subjects. Am. J. Roentgenol. 195(5), W352–W356 (2010).
- Zijta F, Froeling M, Van Der Paardt M et al. Feasibility of diffusion tensor imaging (DTI) with fibre tractography of the normal female pelvic floor. Eur. Radiol. 21(6), 1243–1249 (2011).
- Shinagawa H, Murano EZ, Zhuo J et al. Effect of oral appliances on genioglossus muscle tonicity seen with diffusion tensor imaging: a pilot study. Oral Surg. Oral Med. Oral Pathol. Oral Radiol. Endod. 107(3), e57–e63 (2009).
- Maganaris CN, Baltzopoulos V, Ball D, Sargeant AJ. In vivo specific tension of human skeletal muscle. J. Appl. Physiol. 90(3), 865–872 (2001).
- Heemskerk AM, Damon BM. DTI-based fiber tracking reveals a multifaceted alteration of pennation angle and fiber tract length upon muscle lengthening. In: International Society for Magnetic Resonance in Medicine 17th Annual Meeting. Honolulu, HI, USA, 2009.
- Heemskerk AM, Ding Z, Sinha TK, Wilson KJ, Damon BM. In vivo muscle fiber curvature measurements using DT-MRI. In: Int. Soc. Magn. Reson. Med. 19th Annual Meeting. Montreal, QC, Canada, 2011.
- Felton SM, Gaige TA, Benner T et al. Associating the mesoscale fiber organization of the tongue with local strain rate during swallowing. J. Biomech. 41(8), 1782–1789 (2008).
- Levin DIW, Gilles B, Mädler B, Pai DK. A fiber tracking method for building patient specific dynamic musculoskeletal models from diffusion tensor data. MICCAI Workshop on Computational Diffusion MRI 62–71 (2008).
- Aliev MK, Tikhonov AN. Random walk analysis of restricted metabolite diffusion in skeletal myofibril systems. Mol. Cell Biochem. 256–257(1–2), 257–266 (2004).
- Shorten PR, Sneyd J. A mathematical analysis of obstructed diffusion within skeletal muscle. Biophys. J. 96(12), 4764–4778 (2009).
- Pichon E, Westin CF, Tannenbaum AR. A Hamilton-Jacobi-Bellman approach to high angular resolution diffusion tractography. Med. Image Comput. Comput. Assist. Interv. 8(Pt 1), 180–187 (2005).
- Aganj I, Lenglet C, Jahanshad N et al. A Hough transform global probabilistic approach to multiple-subject diffusion MRI tractography. Med. Image Anal. 15(4), 414–425 (2011).
- Parker GD, Drage N, Rosin PL et al. Towards automated modelling of maxillofacial musculature. In: International Society for Magnetic Resonance in Medicine 19th Annual Meeting. Montreal, QC, Canada, 2011.
- Narici M, Maganaris C. Adaptability of elderly human muscles and tendons to increased loading. J. Anat. 208, 433–443 (2004).
- Narici MV, Maganaris CN, Reeves ND, Capodaglio P. Effect of aging on human muscle architecture. J. Appl. Physiol. 95(6), 2229–2234 (2003).
- Lanza IR, Befroy DE, Kent-Braun JA. Age-related changes in ATP-producing pathways in human skeletal muscle in vivo. J. Appl. Physiol. 99(5), 1736–1744 (2005).
- Lanza IR, Russ DW, Kent-Braun JA. Age-related enhancement of fatigue resistance is evident in men during both isometric and dynamic tasks. J. Appl. Physiol. 97(3), 967–975 (2004).
- Russ DW, Kent-Braun JA. Is skeletal muscle oxidative capacity decreased in old age? Sports Med. 34(4), 221–229 (2004).


