Research Article - Imaging in Medicine (2021) Volume 13, Issue 7
Determination of hemodynamic and rheological properties in carotid artery diseases
- Corresponding Author:
- Halil Ibrahim Ozdemir
Department of Radiology
Ege University
Bornova
Turkey
E-mail: halil.ibrahim.ozdemir@ege.edu.tr
Abstract
Aim: The cause of all carotid artery diseases is directly related to the morphological structure and hemodynamic properties of the carotid artery and its branches. Our aim of research is to find answers to the following two questions. 1-Compared to normal patients, how can hemodynamic and rheological changes occur in the carotid arteries and its branches of the patients with stenotic, aneursymatic and dissection? 2-And how do these changes differ according to diseases?
Materials and methods: In our research, Computed Tomography Angiography images of carotid artery were analyzed using Sectra and AW Server 2 3D volume rendering and vessel analysis programs.
Results: Patients with extra cranial and intra cranial aneurysms were found to have lower shear stresses, slower blood flow rates, but on the contrary, having higher blood pressure and higher Reynolds numbers that affect the artery walls. On the other hand, higher shear stresses, higher blood flow velocities, lower Reynolds numbers and lower wall tension values were found in patients with dissection.
Conclusion: It has been concluded that the presence of aneurysm and dissection may play an important role in vascular shaping, or vice versa.
Keywords
carotid artery diseases ▪ computed tomography angiography ▪ arterial stenosis ▪ extra and intracranial aneurysm ▪ arterial dissection
Introduction
The flow pattern of the blood flowing in the artery is very important for identifying the diseases occurring in vascular branches [1,2]. The most common carotid diseases known to cause cerebral stroke and stroke are; stenosis, aneurysm and dissections. The first of these is carotid stenosis. Geometry of carotid artery is also a risk factor for development of atherosclerosis [3,4]. Others are extracerebral or intracerebral aneurysms. Again, branching morphology in the carotid bifurcation regions may affect the flow dynamics, leading to development of aneurysm in the carotid artery bifurcation region, and then in the brain. Research on this issue has shown hemodynamic stress as a critical factor leading to the remodeling of the arterial wall [5,6]. The third is carotid dissections. While carotid artery dissections account for 2% of all ischemic strokes, this rate rises to 20% in young adults fewer than 50 years of age [7-9]. The main mechanism in the development of carotid artery dissection is the rupture of the carotid artery in the intima layer, and the blood in this region advances through the artery and forms an embolic or aneurysmatic pseudo-lumen in the subintimal or subadventional layers. Finally, this causes blood flow dynamics to deteriorate [10-12].
The cause of all these carotid artery diseases is directly related to the morphological structure and hemodynamic properties of the carotid artery and its branches. These hemodynamic properties can be listed as flow rates, flow patterns, arterial diameters, branching angles, Reynolds numbers, vascular wall’s blood pressure, shear stresses and blood viscosity of the carotid arteries. These listed morphological, hemodynamic and rheological properties can be determined by laws and formulas such as Murray's laws, Haok's laws, Reynolds numbers, minimum cost function, vascular wall tension and vascular shear stress. Computed Tomography Angiography (CTA) is the most practical and more accurate method used in the diagnosis of the carotid diseases mentioned above. With CTA, the true three-dimensional geometry of the arteries can be determined with significant accuracy [13- 15]. In this study, it was aimed to determine the hemodynamic and rheological properties of patients with carotid stenosis, aneurysm and carotid dissection for any purpose through craniocervical CT angio data. Our aim, in our research was to find answers to the following two questions. 1-Compared to normal patients, how can hemodynamic and rheological changes occur in the carotid artery and its branches of the patients with stenotic, aneursymatic and dissection? 2-And how do these changes differ according to diseases? An important difference in our study is that hemodynamic and rheological properties of carotid arteries had been determined only from imaging data such as carotid artery diameters, angles, and rates.
Materials and Methods
The cranio-cervical CTA images of the patients who referred to our clinic for the proof of the hypothesis and who were diagnosed with carotid stenosis, carotid dissection and extra or intra cranial aneurysm were scanned retrospectively. Our institute’s Local Ethics committee has approved us to use hospital’s archive data in this study (19-9.1T/6, 18/09/2019). As a result of archive review, CTA image data of a total of 136 patients (33 were normal, 37 were stenotic, 30 were aneurysmatic and 36 were dissection) were selected. Images of patients that had only one reported disease (stenosis, aneurysm or dissection) were considered diseased. As a result of screening, patients having pathology other than these diseases were excluded from the study. The data of the patients who applied to the hospital with a different complaint and who underwent CTA examination but were evaluated as normal were considered normal for comparison purposes.
Cranio-cervical CTA examination of the patients were performed on a Siemens brand Computed Tomography (CT) device (Somatom Definition, care dose CT with 128 slices, Siemens Healthcare, Erlangen-Germany). Scanning parameters used for cranio-cervical CTA are; kVp: 120, mA: dose modulating, rotation time: 0.3 seconds, slice thickness: 0.6 mm, pitch value: 0.8, coverage: 76.8 mm, kernel filter: 326f medium smooth, matrix: 512 × 512 and FOV: 230 mm. Nonionic iodine contrast agent in an amount of 1cc/ kg was given to each patient via the intravenous route and with the help of an automatic injector.
Images were analyzed using Sectra (Sectra Workstation IDS7 for Windows Version, Sectra AB, Sweden) and AW Server 2 (GE Healtcare, USA) 3D volume rendering and vessel analysis programs (FIGURES 1 and 2). Calculated normal values were compared with those having carotid diseases. And then, artery flow rates, wall tensions, shear streesses and Reynold's numbers were determined from the carotid diameter and angle values obtained (Equation 1-4). In addition, we used carotis flow rate values (Q) obtained from healthy patients by Zarrinkoob et al. [16].

Figure 1: Shows the diameter measurement technique step with the vessel analysis program on Sectra Workstation.

Figure 2: In the mediolateral position, the 3D images of the carotid arteries are created from the data of patients who were closest to the mean normal values and of those having disease (with the help of the AW-server2 program). Significant changes depending on carotid diseases are also observed on 3D carotid artery images. The red lines indicate where the diameter measurements are made [22].

Figure 3: Distribution of the blood flow velocities of CCA and ICA (velocity of CCA (a) and ICA (b) (cm/sec) is seen on the top row and distribution of the wall tension values is also seen ın the bottom row (wall tension of CCA (c) and ICA (d)). It is seen apparent that the blood flow velocities of CCA and ICA are higher in dissection patients, but wall tensions are lower, and vice versa is valid in aneurysm patients (0=normal, 1=stenosis, 2=aneurysm, 3=dissection).

Figure 4: On the top row the distribution of the shear stress of CCA and ICA (shear stress of CCA (a) and ICA (b) (dyn/cm2) and on the bottom row the distribution of the Reynold’s numbers are can be seen (Reynold’s numbers of CCA (c) and ICA (d)). It is obvious that the shear stress of CCA and ICA are higher in dissection patients, whereas Reynold’s numbers are lower, and vice versa is valid in aneurysm patients (0=normal, 1=stenosis, 2=aneurysm, 3=dissection).
These data obtained from images of normal individuals and the patients with carotid disease were compared and evaluated using SPSS descriptive statistics, Independent Samples T-Test, and graphic programs. In calculations, the known equations listed below were used.
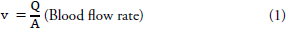
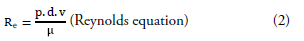
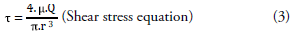

Q=blood flow rate, v=velocity, A=vessel crossectional area, μ=fluid viscosity, Re=number pf Reynold s, τ= shear stress, T= wall tension, ΔP= change in pressure, r=vessel radius [1mmHg=1334 dyn/, QCCA=367 ml/min, QICA=257 ml/min, QECA=110 ml/min].
Results
As a result of the analysis, hemodynamic and rheological data calculated through biophysical formulas and methods measured on normal and diseased carotid images are seen in Table. No statistically significant difference was found between normal cases and patients with carotid stenosis. It is obvious from these results that the changes in hemodynamics of patients with stenosis are localized only in the area of stenosis, whereas these local changes do not disturb the form of entire carotid and hemodynamics.
When the data of patients with carotid aneurysm are compared with normal data, significant differences were found. According to this, ICA shear stress (p=0.004), ICA wall tension (p=0.0001), ICA blood flow rate (p=0.001), Reynolds number CCA (p=0.000), Reynolds number ECA (p=0.001), total Raynolds numbers (p=0.001), total wall tensions (p=0.019) and total blood flow rates (p=0.066) were different. In other words, patients with extra or intra cranial aneurysms were found to have lower shear stresses, slower blood flow rates, but on the contrary, having higher blood pressure and higher Reynolds numbers that affect the artery walls. Therefore, the fact that the pressure on the arterial walls of the patients with aneurysms is high and the blood flow is also turbulent, so, this explains the reason for aneurysm. It is understood from these results that the morphological hemodynamics in the carotid arteries of patients with aneurysm had impaired.
Again, significant differences were found in the comparison of normal and dissected patients. CCA (p=0.000), ICA (p=0.006), ECA (p=0.009) and total shear stresses (p=0.000) were found significant. In addition, significant differences were found in CCA (p=0.009), ICA (p=0.003) and total Reynolds numbers (p=0.002). Similarly, wall tension CCA (p=0.001), ICA (p=0.009), ECA (p=0.003) and total wall tension (p=0.000) values were found significant. Comparison of blood flow velocity of CCA (p=0.000), ICA (p=0.006), ECA (p=0.007) and total (p=0.000) were also found significant. In other words, in patients with dissection, the higher shear stress and higher blood flow velocity values, low Reynolds numbers and wall tension values explain the reason for carotid dissection in patients. These meaningful changes can be easily seen (FIGURES 3 and 4).
the branching geometry that forms the vascular structure, the shaping of this geometry, and the flow of blood within this structure with the lowest energy cost. Despite the limitations of growth and different living environments, these laws are considered to work globally. There were also researchers who suggested the structure-function principle regarding the branching geometries of vascular structures. For example, Schreiner [17] on the optimal design principles of arteries, and Kamiya and Togawa [18] on the minimum blood volume principle are among those who recommend. Murray was the first to define the minimum cost function in vascular bifurcation [19-21]. This definition is actually based on the Hagen-Poiseuille law, which states that the most important factor regulating fluid flow in the pipe is the radius of the vessel. In addition, the total cost function of the circulatory system is based on the logic equal to the sum of the individual cost functions of all units that make up it. In the publication, which is a preliminary study of this study, the same author found that aneurysm patients had high ICA diameters, bifurcation angles, and minimum cost functions [22] (TABLE 1).
| Normal | Stenosis | Aneurisym | Dissection | |
|---|---|---|---|---|
| N | 31 | 33 | 30 | 33 |
| Age | 53.5 | 63 | 53.1 | 44.6 |
| Sex (F/M) | (17/16) | (14/23) | (13/17) | (21/15) |
| CCA.dia.R(mm) | 7.2 | 7.5 | 7.4 | 6.2 |
| CCA.dia.L(mm) | 7.1 | 7.3 | 7.2 | 6.7 |
| CCA.dia.Æ©(mm) | 7.1 | 7.5 | 7.3 | 6.4 |
| ICA.dia.R(mm) | 5.6 | 5.6 | 6.7 | 4,9 |
| ICA.dia.L(mm) | 5.6 | 5.7 | 6.7 | 4.3 |
| ICA.dia.Æ©(mm) | 5.7 | 5.6 | 6.7 | 5.2 |
| ECA.dia.R(mm) | 4.4 | 4.3 | 4.6 | 3.8 |
| ECA.dia.L(mm) | 4.3 | 4.3 | 4.3 | 3.8 |
| ECA.dia.Æ©(mm) | 4.3 | 4.3 | 4.6 | 3.8 |
| Car.Angle.Rغ | 22.7 | 18.5 | 28.8 | 23 |
| Car.Angle.Lغ | 23.4 | 24.5 | 31.2 | 29.9 |
| Car.Angle.Ʃغ | 23.1 | 21.5 | 30 | 26.4 |
| Car.Angle.Rৠ| 23.1 | 24 | 25.2 | 24.9 |
| Car.Angle.Lৠ| 26.5 | 17.9 | 21 | 21.1 |
| Car.Angle.Æ©αº | 24.8 | 21 | 23.2 | 23 |
| Car.Angle.R(Ø+α)º | 45.9 | 42.5 | 54 | 47.9 |
| Car.Angle.L(Ø+α)ºï»¿ | 50 | 42.4 | 52.3 | 51 |
| Car.Angle.Æ©(Ø+α)ºï»¿ | 47.9 | 42.5 | 53.2 | 49.4 |
TABLE 1: In our study demographic data showing the diameter and angle values measured on normal and diseased carotid images are seen [22].
David and et al. found the average Reynold's number to be 300. In the continuation of the same study, they found that the wall shear stress values were higher on the inner surfaces of the vessels. Accordingly, CCA average 8 dynes/cm2; ICA found an average of 26 dynes/cm2 and ECA found an average of 14 dynes/cm2 [23]. When the average shear stress values of our normal patients are analyzed, the CCA average is similar to 7.4 dynes/ cm2, while it differs for ICA (10.5 dynes/cm2) and ECA (10.9 dynes/cm2) (TABLE 2).
| Normal | Stenosis | Aneurisym | Dissection | |
|---|---|---|---|---|
| Velocity CCA(cm/s) | 16 | 15.4 | 15.7 | 19.7 |
| Velocity ICA(cm/s) | 17.8 | 19.2 | 13.6 | 21.8 |
| Velocity ECA(cm/s) | 13.5 | 13.5 | 12.4 | 17.5 |
| Velocity Æ© (cm/s) | 15.7 | 16,0 | 13.9 | 19.6 |
| Wall Tansion CCA (dyn/cm) | 42.9 | 44.8 | 43.9 | 38.5 |
| Wall Tansion ICA (dyn/cm) | 34 | 33.7 | 40.1 | 31 |
| Wall Tansion ECA (dyn/cm) | 26 | 26.1 | 27.5 | 23 |
| Wall Tansion Æ© (dyn/cm) | 34.3 | 34.8 | 37.1 | 30.8 |
| Shear Stress CCA (dyn/cm²) | 7.4 | 7.2 | 7.4 | 10.2 |
| Shear Stress ICA (dyn/cm²) | 10.5 | 12.1 | 7.3 | 14.4 |
| Shear Stress ECA (dyn/cm²) | 10.9 | 10.9 | 9.6 | 16.1 |
| Shear Stress Æ© (dyn/cm²) | 9.6 | 10.1 | 8.1 | 13.6 |
| Reynold Number CCA | 284.4 | 297.1 | 291.2 | 255.1 |
| Reynold Number ICA | 245 | 242.8 | 289 | 223.8 |
| Reynold Number ECA | 141 | 141.4 | 149 | 124.4 |
| Reynold Number Æ© | 223,4 | 227.1 | 243 | 201.1 |
TABLE 2: Hemodynamic and rheological data calculated through biophysical formulas and methods measured on normal and diseased carotid images are seen.
Glagov et al. reported that shear stress has played a critical role in determining where vascular pathologies originate from [24]. They also emphasized that shear stress plays a significant role in the development of phenotypic changes in which endothelial and metabolic balance associated with the onset and development of atherosclerosis impair [25,26]. Again, it has been reported that high shear stress promotes dilatation or structural remodeling of the arterial wall and even causes early emergence of cardiovascular diseases [27]. In fact, another researcher reports that carotid artery bifurcation is asymmetric in nature and this causes flow split in connection with the branching angle [28]. Therefore, it is observed that the blood flow rate in the bifurcation regions is generally curved. For this reason, it is observed that the maximum velocity point is not located in the center as in the straight artery segments and slips towards the inner walls of the ICA and ECA [29,30]. Impaired flow patterns are also often found on the outer wall of the sinus, where they create low and oscillating wall shear stress levels. Already atherosclerosis develops mostly in the outer regions where the wall shear stress in the artery is the least. Stenosis mostly locates in the outer regions of arterial bifurcation sinuses. On the contrary, the apex of the bifurcation and the ECA inner wall are high wall shear stress zones known as protective against atherogenesis [31]. It has also been reported that wall shear stresses create a dynamic flow environment in the stenotic and poststenotic regions of the arteries [32]. In our study, since the stenosis degrees of patients with stenosis are different, shear stresses of stenosis regions were not calculated. There was no significance in shear stress values outside the stenosis region.
On the other hand, aneurysms most often develop in vascular bifurcations, where blood flow is turbulent and shear stress forces are strong [33]. It has even been reported that the apex of arterial bifurcations are the most common sites for aneurysm formation, and these areas have high levels of shear stress and wall tension [34]. Again, compared to normal patients, carotid arteries of patients with extra and intra cranial aneurysm; shear stresses were low (p=0.004), blood flow rates were slow (p=0.001), but on the contrary, wall tensions (p=0.019) and Reynolds numbers (p=0.001) affecting the artery walls were found to be high. From these results, it is understood that the morfological hemodynamics in the carotid of patients with aneurysms are negatively impaired. It is obvious that this structural change in the carotid arteries of patients with aneurysms complicates the flow or increases the amount of energy required for blood flow. Therefore, development of aneurysm is thought to be effective in vascular shaping or, conversely, in increase of vessel diameters and bifurcation angles during development of dissection.
On the other hand, some carotid bifurcation studies also report that the curvature and configuration of the vessel can create varying levels of wall shear stresses in different regions (1 dyne/cm² to 600 dyne/cm²) within the same vessel [35]. Some researchers also found comman carotid artery mean shear stress values as 9.5 [36], 7.0 [37], 12.1 [38] and 15.3 dynes/cm² [39]. The comman carotid artery average shear stress values we found were 7.2 in normal people, 7.4 in stenotic patients, 7.2 in aneurysmatic patients, and 10.2 dynes/cm² in patients with dissection.
Returning to our work again, when normal and dissected patients were compared significant differences were found. According to our findings; CCA (p=0.000), ICA (p=0.006), ECA (p=0.009) and total shear stresses (p=0.000) were also found significant. In addition, significant differences were found in CCA (p=0.009), ICA (p=0.003) and total Reynolds numbers (p=0.002). Similarly, wall tension CCA (p=0.001), ICA (p=0.009), ECA (p=0.003) and total wall tension (p=0.000) values were also found significant. Comparisons made on blood flow velocity of CCA (p=0.000), ICA (p=0.006), ECA (p=0.007) and total (p=0.000) were also found significant. In other words, in patients with dissection the high shear stress and high blood flow velocity values, low Reynolds numbers and wall tensions values explain the reason for carotid dissection in patients. Therefore, it is thought that carotid artery dissections are effective in the structural formation of the vessels, or on the contrary, the reduction in vessel diameters and bifurcation angles is effective in development of dissection.
The lack of measurement and evaluation for the stenosis region before and after the patients with stenosis is deficient.
Conclusion
Aneurysms most often develop in vascular bifurcations, where blood flow is turbulent and shear stress forces are strong. The apex of arterial bifurcations is the most common sites for aneurysm formation, and these areas have high levels of shear stress and wall tension. It has been concluded that the presence of aneurysm and dissection may play an important role in vascular shaping, or vice versa.
References
- Friedman MH, Hutchins GM, Bargeron CB, Deters OJ, Mark FF. Correlation between intimal thickness and fluid shear in human arteries. Atherosclerosis. 39(3), 425-436 (1981).
- Ku DN. Blood flows in arteries. Annu Rev Fluid Mech. 29, 399-434 (1997).
- Friedman MH, Deters OJ, Mark FF, Bargeron CB, Hutchins GM. Arterial geometry affects hemodynamics. A potential risk factor for atherosclerosis. Atherosclerosis. 46(2), 225-231 (1983).
- Ku DN, Giddens DP, Zarins CK, Glagov S. Pulsatile flow and atherosclerosis in the human carotid bifurcation. Positive correlation between plaque location and low oscillating shear stress. Arteriosclerosis. 5(3), 293-302 (1985).
- Aoki T, Kataoka H, Moriwaki T, Nozaki K, Hashimoto N. Role of TIMP-1 and TIMP-2 in the progression of cerebral aneurysms. Stroke. 38(8), 2337-2345 (2007).
- Aoki T, Kataoka H, Shimamura M et al. NF-kappaB is a key mediator of cerebral aneurysm formation. Circulation. 116(24), 2830-2840 (2007).
- Vergouwen MD. Intravenous thrombolysis in ischaemic stroke secondary to cervical artery dissection: safe but not effective? Eur J Neurol. 19(9), 1155-1156 (2012).
- Putaala J, Metso AJ, Metso TM et al. Analysis of 1008 consecutive patients aged 15 to 49 with first-ever ischemic stroke: the Helsinki young stroke registry. Stroke. 40(4), 1195-1203 (2009).
- Schievink WI. Spontaneous dissection of the carotid and vertebral arteries. N Engl J Med. 344(12), 898-906 (2001).
- Poppe AY, Minuk J, Glikstein R, Leventhal M. Fibromuscular dysplasia with carotid artery dissection presenting as an isolated hemianopsia. J Stroke Cerebrovasc Dis. 16(3), 130-134 (2007).
- Macdonald DJ, McKillop EC. Carotid artery dissection after treadmill running. Br J Sports Med. 40(4), e10 (2006).
- Caplan LR. Dissections of brain-supplying arteries. Nat Clin Pract Neurol. 4(1), 34-42 (2008).
- O'Flynn PM, O'Sullivan G, Pandit AS. Methods for three-dimensional geometric characterization of the arterial vasculature. Ann Biomed Eng. 35(8), 1368-1381 (2007).
- Milner JS, Moore JA, Rutt BK. Steinman DA. Hemodynamics of human carotid artery bifurcations: computational studies with models reconstructed from magnetic resonance imaging of normal subjects. J Vasc Surg. 28(1), 143-156 (1998).
- Taylor C, Humphrey J. Open problems in computational vascular biomechanics: Hemodynamics and arterial wall mechanics. Comput Methods Appl Mech Eng. 198(45-46), 3514-3523 (2009).
- Zarrinkoob L, Ambarki K, Wahlin A et al. Blood flow distribution in cerebral arteries. J Cereb Blood Flow Metab. 2015(35), 648-654 (2015).
- Schreiner W, Buxbaum PF. Computer-optimization of vascular trees.IEEE Trans Biomed Eng. 40(5), 482-491 (1993).
- Kamiya A, Togawa T. Optimal branching structure of the vascular tree. Bull Math Biophys. 34(4), 431-438 (1972).
- Murray CD. The physiological principle of minimum work: I. The vascular system and the cost of blood volume. Proc Natl Acad Sci U S A. 12(3), 207-214 (1926).
- Murray CD. The physiological principle of minimum work applied to the angle of branching of arteries. J Gen Physiol . 9(6), 835-841 (1926).
- Murray CD. A relationship between circumference and weight in trees and its bearing on branching angles. J Gen Physiol. 10(5), 725-729 (1927).
- Ozdemir HI. The structural properties of carotid arteries in carotid artery diseases – a retrospective computed tomography angiography study. Pol J Radiol. 85, e82–e89 (2020).
- Ku DN, Giddens DP, Zarins CK, Glagov S. Pulsatile flow and atherosclerosis in the human carotid bifurcation. Positive correlation between plaque location and low oscillating shear stress. Arteriosclerosis. 5, 293-302 (1985).
- Glagov S, Zarins C, Giddens DP, Ku DN. Hemodynamics and atherosclerosis. Insights and perspectives gained from studies of human arteries. Arch Pathol Lab Med. 112(10), 1018-1031 (1988)
- Passerini AG, Polacek DC, Shi C et al. Coexisting proinflammatory and antioxidative endothelial transcription profiles in a disturbed flow region of the adult porcine aorta. Proc Natl Acad Sci U S A. 101(8), 2482-2487 (2004).
- Volger OL, Fledderus JO, Kisters N et al. Distinctive expression of chemokines and transforming growth factor-beta signaling in human arterial endothelium during atherosclerosis. Am J Pathol. 171(1), 326-337 (2007).
- Mattsson EJ, Kohler TR, Vergel SM, Clowes AW. Increased blood flow induces regression of intimal hyperplasia. Arterioscler Thromb Vasc Biol. 17(10), 2245-2249 (1997).
- Hobson RW, Wilson SE, Veith F. Vascular surgery: principles and practice. 3rd ed. New York: Marcel Dekker 43-60 (2004).
- Motomiya M, Karino T. Flow patterns in the human carotid artery bifurcation. Stroke. 15(1):50-56 (1984).
- Nguyen KT, Clark CD, Chancellor TJ, Papavassiliou DV. Carotid geometry effects on blood flow and on risk for vascular disease. J Biomech. 41(1), 11-19 (2008).
- Younis HF, Kaazempur-Mofrad MR, Chan RC et al. Hemodynamics and wall mechanics in human carotid bifurcation and its consequences for atherogenesis: investigation of inter-individual variation. Biomech Model Mechanobiol. 3(1),17-32 (2004).
- Cecchi E, Giglioli C, Valente S et al. Role of hemodynamic shear stress in cardiovascular disease. Atherosclerosis. 214(2), 249-256 (2011).
- Inci S, Spetzler RF. Intracranial aneurysms and arterial hypertension: a review and hypothesis. Surg Neurol. 53(6), 530-540 (2000).
- Atlas SW. Magnetic resonance imaging of intracranial aneurysms. Magn Reson Imaging Clin N Am. 6(4), 835-848 (1998).
- Zarins CK, Giddens DP, Bharadvaj BK et al. Carotid bifurcation atherosclerosis. Quantitative correlation of plaque localization with flow velocity profiles and wall shear stress. Circulation Research. 53(4), 502-14 (1983).
- Oyre S, Ringgaard S, Kozerke S et al. Accurate noninvasive quantitation of blood flow, cross-sectional lumen vessel area and wall shear stress by three-dimensional paraboloid modeling of magnetic resonance imaging velocity data. J Am Coll Cardiol. 32(1), 128-134 (1998).
- Hoeks AP, Samijo SK, Brands PJ, Reneman RS. Noninvasive determination of shear-rate distribution across the arterial lumen. Hypertension. 26(1), 26-33 (1995).
- Gnasso A, Carallo C, Irace C et al. Association between intima-media thickness and wall shear stress in common carotid arteries in healthy male subjects. Circulation. 94(12), 3257-3262 (1996).
- Gnasso A, Irace C, Carallo C et al. In vivo association between low wall shear stress and plaque in subjects with asymmetrical carotid atherosclerosis. Stroke. 28(5), 993-998 (1997).


