Research Article - Imaging in Medicine (2014) Volume 6, Issue 1
Computer-aided diagnosis in digital mammography: comparison of two commercial systems
Donato Cascio*,1, Francesco Fauci1, Marius Iacomi1,2, Giuseppe Raso1, Rosario Magro1, Debora Castrogiovanni3, Guido Filosto3, Raffaele Ienzi4 & Maria Simone Vasile51Dipartimento di Fisica e Chimica, Università di Palermo, Palermo, Italy
2Institutul de Stiinte Spatiale, Bucharest-Magurele, Romania
3Clinica ‘La Maddalena’, Palermo, Italy
4Dipartimento di Scienze Radiologiche, Policlinico ‘P Giaccone’, Palermo, Italy
5CyclopusCAD srl, Palermo, Italy
- Corresponding Author:
- Donato Cascio
Dipartimento di Fisica e Chimica
Università di Palermo, Palermo, Italy
Tel: +39 091 2389 9050
Fax: +39 091 2386 0816
E-mail: donato.cascio@unipa.it
Abstract
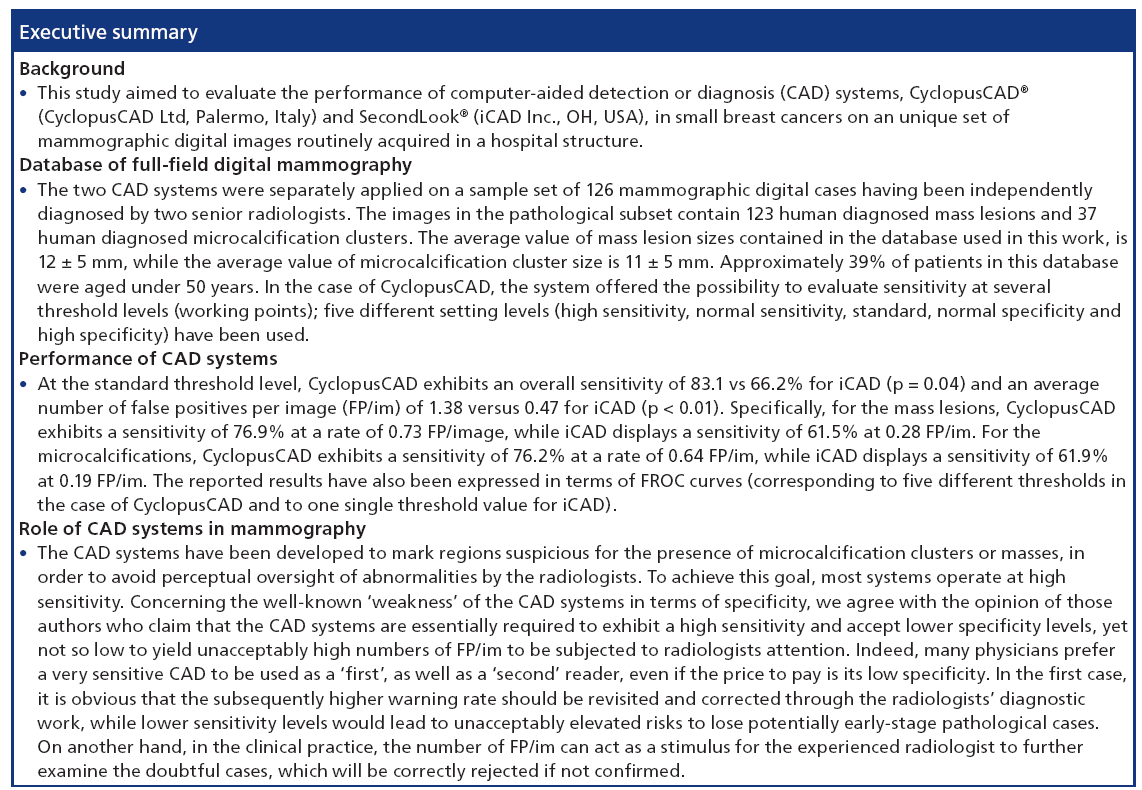
Aim: Within this work, a comparative analysis of two commercial computer-aided detection or diagnosis (CAD) systems, CyclopusCAD® mammo (v. 6.0) produced by CyclopusCAD Ltd (Palermo, Italy) and SecondLook® (v. 6.1C) produced by iCAD Inc. (OH, USA) is performed by evaluating the results of both systems application on an unique set of mammographic digital images routinely acquired in a hospital structure.
Materials & methods: The two CAD systems have been separately applied on a sample set of 126 mammographic digital cases, having been independently diagnosed by two senior radiologists. According to the human diagnosis, the cases in the sample reference set are divided into 61 negatives and 65 pathological cases (21 cases displaying both mass lesions and microcalcifications and 44 cases characterized only by mass lesions). The images in the pathological subset contain 123 human diagnosed mass lesions and 37 human diagnosed microcalcifications clusters. In the case of CyclopusCAD, the system offered the possibility to evaluate sensitivity at several threshold levels (working points); five different setting levels (high sensitivity, normal sensitivity, standard, normal specificity and high specificity) have been used. Results: At the standard threshold level, CyclopusCAD exhibits an overall sensitivity of 83.1 versus 66.2% for iCAD (p = 0.04) and an average number of false positives per image (FP/im) of 1.38 against 0.47 for iCAD (p < 0.01). Specifically, for the mass lesions, CyclopusCAD exhibits a sensitivity of 76.9% at a rate of 0.73 FP/im, while iCAD displays a sensitivity of 61.5% at 0.28 FP/im. For the microcalcifications, CyclopusCAD exhibits a sensitivity of 76.2% at a rate of 0.64 FP/image, while iCAD displays a sensitivity of 61.9% at 0.19 FP/im. The reported results have also been expressed in terms of free-response receiver operating characteristic curves, corresponding to five different thresholds in the case of CyclopusCAD and to one single threshold value for iCAD. Conclusion: The overall accuracies of the two systems are fairly comparable up to the uncertainty level of this analysis. CyclopusCAD may reach a higher sensitivity level for both masses and microcalcifications owing to the flexibility in the working point choice, with the price of a major number of FP/im.
Keywords
breast cancer • clusters • computer-assisted diagnosis • FFDM • FROC curve • mammography • mass lesions • microcalcifications • performance
Breast tumors constitute the second most important cause of cancer mortality in women [1]. Current screening programs have proven themselves as valuable auxiliary instruments that lead to noticeable decreases in mortality incidence. One may safely assert that a further reduction of the mortality incidence could be reached through significant improvement of the screening sensitivity. Several methods for reducing the probability of error have been considered; first is the double reading, which consists of either acquiring a double perception of the lesion or a double interpretation of the latter. The most accurate (lesion) interpretation method is the supervised double lecture, in which a third reader revisits the cases on which the first two readers disagree [2]. For several decades, researchers in the field of medical imaging and artificial intelligence have been involved in elaborating and implementing algorithms for identifying mammographic abnormalities, with the aim of automating the interpretation process or, more realistically, to provide an instrument for improved accuracy of image reading. The resulting expert systems, also known as computeraided detection or diagnosis (CAD), have been proposed in the early diagnosis of mammary carcinoma [3], as a valuable alternative to the ‘double reading’ [4,5] for improving the performance of radiologists. Within this application context, the aim of the CAD is to draw the reader’s attention to the potentially anomalous regions and to increase the suspicion level for the anomaly indications, having previously been dismissed as normal. The gradual transition of the radiological community towards digital techniques and standardized image acquisition protocols have made a noticeable contribution to the widespread use of increasingly friendly, effective and standardized CAD systems.
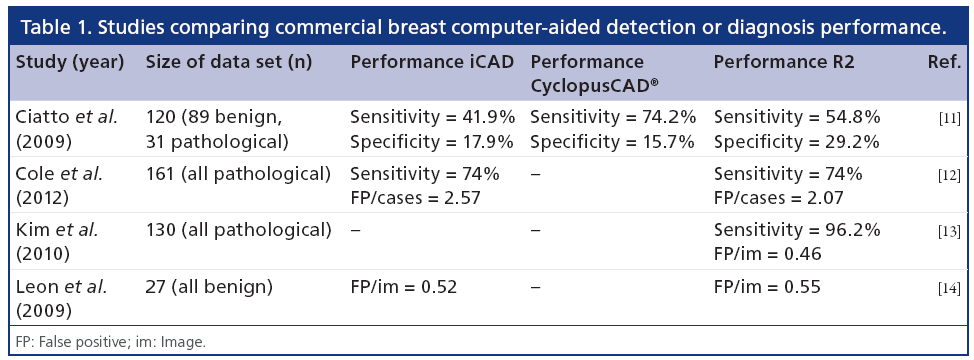
Several studies have evaluated the performance of CAD systems in mammography [6–8]; a more complete review of the results in the literature can be found [9]. At present, commercial mammographic CAD systems have been available on the market for several years; nevertheless, their performance very often make reference to private databases that leave no room for a head-to-head comparison of these systems [10]. Some papers report results of tests performed on databases consisting of digitalized images [11,12], others compare the performances of two software versions of a commercially available CAD system [13], but little investigation has been carried out on a same database allowing reliable head-to-head comparisons between commercial systems [14]. Table 1 presents a summary of the results obtained in the aforementioned studies. In the present paper, two commercial mammographic CAD systems are compared on a same database of full-field digital mammography (FFDM).
Materials & methods
Once the locations of potential abnormalities have been identified on the mammography, the CAD systems send the information to the radiologist as visual signals (markers associated to the regions of interest, located on the digital display or on the film). These markers correspond to true positives or false positives (FPs) [15]. In a CAD algorithm evaluation process, it is important to take into account its sensitivity and specificity, along with the type of cases that constitute the database under examination. Thus, a high sensitivity might actually not reflect a good performance if the evaluation has been performed only on cases with obvious abnormalities. In confronting different CAD algorithm performances, the main issue consists in the variability of the cases from their corresponding databases. A data set of clinical images constitutes the base for important epidemiological and statistical studies [10,16–17]; as a rule, the data set is used for developing and testing CAD system algorithms, but also for the instruction and the training of medical students, if it happens to contain a rare case archive; it can also be used (as it was in this case study), for headto- head performance comparison. The performance of the CAD systems can be evaluated in two ways: by measuring the performance of the algorithms themselves, or by estimating the performance of the readers who use them. Within this work, we followed the first performance testing approach on two commercial CAD systems, CyclopusCAD® (CyclopusCAD Ltd, Palermo, Italy) and SecondLook® (iCAD Inc., OH, USA), which were run on the same data set of digital images acquired in a hospital facility.
The FFDM images have been independently diagnosed by two senologists; the positive diagnosis cases have been further confirmed by histological examination reports, while the negative cases have been selected among those database cases with a 2-year negative follow- up. The database consists of 65 pathologic cases and 61 healthy cases acquired in the Senology Department of the Clinic ‘La Maddalena’ from Palermo, Italy. The mammograph used in acquisition is a Senograph 2000D produced by General Electric (CT, USA) and the images were subsequently stored on a picture-archiving and communications system.
The age distribution of the patients in the database is presented in Figure 1. Approximately 39% of patients in this database were aged under 50 years.

Figure 1: Age distribution of the patients from the database.
Figures 2 & 3 display two histograms characterizing the database composition, namely: the mass lesion sizes histogram (Figure 2) and the microcalcifications cluster dimensions histogram (Figure 3).

Figure 2: Mean size distribution of mass lesions.

Figure 3: Cluster size distribution of microcalcifications.
The size distribution of mass lesions has an average value equal to 12 ± 5 mm, while the size distribution of microcalcification clusters has an average value equal to 11 ± 5 mm.
Within the 65 selected pathologic cases (of which 21 were mass lesions and microcalcifications and 44 were only mass lesions), 123 mass lesions and 37 microcalcification clusters are present, with a Breast Imaging Reporting and Data System index ranging from R3 to R5 [18]. All the cases contained the usual four views (two mediolateral oblique + two craniocaudal). Almost always, the possible presence of a lesion in a case occurred within two of the views. This explains why the number of lesions was approximately twice the number of cases.
The two commercial CAD systems available at the Senology Department of the ‘Maddalena’ Clinic are CyclopusCAD mammo (v. 6.0) and SecondLook (v. 6.1C). CyclopusCAD mammo is a recent commercial system [11] using artificial intelligence algorithms and several signal identification and emphasizing methods [19–24]; some of these methods are proprietary owned [25].
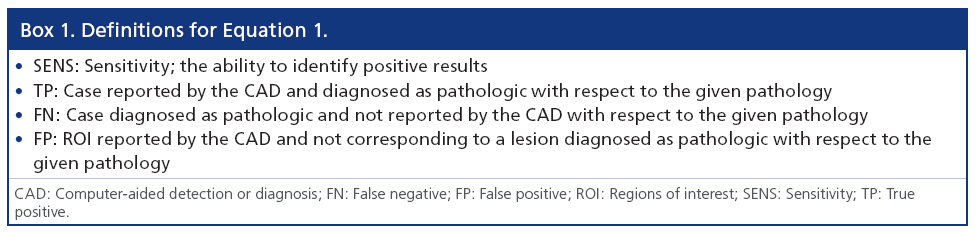
A mammographic workstation equipped with a dedicated graphical environment visualization software has been used for displaying the CAD results, either as markers corresponding to the regions of interest (ROI) centroids or as ROI contours. Moreover, since Cyclopus- CAD mammo output enables displaying these CAD results for several working points corresponding to various sensitivity/specificity couples, the radiologist has the opportunity to use the CAD at several workpoints (high sensitivity, normal sensitivity, standard, normal specificity and high specificity). The choice of the working point by the radiologist, is carried out by clicking on a selection window positioned on the graphical interface of the workstation. The radiologist’s choice of a given working point is based on the specific needs of the working scenario (e.g., screening or clinical). The CAD systems have been developed to mark regions suspicious for the presence of microcalcification clusters or masses, in order to avoid perceptual oversight of abnormalities by the radiologists. To achieve this goal, most systems operate at a high sensitivity [26]. However, in order to make a more effective comparison of CAD system performances [11], this article presents detailed data on the results obtained using a standard working point. Results obtained with all (five) working points have been summarized (freeresponse receiver operating characteristic [FROC] curves; Figures 4 & 5). The CAD system produced by iCAD is activated upon physician request by a specifically configured graphical user interface and the results are displayed as ROI centroids. The results of the CAD systems have been quantized in terms of the parameters defined in Box 1. The corresponding performances have been expressed in terms of sensitivity and number of FPs per image. From the definitions given in Box 1, one can deduce the following parameters:

Figure 4: Free-response receiver operating
characteristic curve for the performance on mass
lesions.
FP: False positive; im: Image.

Figure 5: Free-response receiver operating
characteristic curve for the performance on
microcalcifications clusters.
FP: False positive; im: Image.
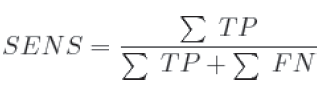 (1)
(1)
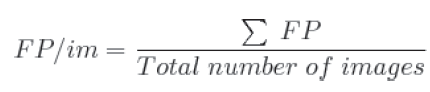 (2)
(2)
In order to reach an improved statistical reliability, when computing the number of FPs per image, the numerator summation is extended only on the single representative ROI found by the system on healthy cases (61 cases), while the denominator is the total number of healthy images considered (61 cases for four-view, a total of 244 healthy images). Thus, one avoids the problem of the evaluation of partial overlaps between pathological lesions and CAD marks.
The McNemar test for couples of data has been used for the computation of the statistical significance of the differences between the two CAD systems. In order to obtain a value for the statistical significance to be subsequently used in the comparison, one has to determine the errors that affect the measured parameters. Denoting p for sensitivity, the (binomial) error σp is:
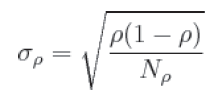 (3)
(3)
where Np is the number of pathological cases in the sample. Therefore σp will decrease as Np increases [27]. Finally, as suggested in [9] and [28], the results have also been expressed through the FROC curve.
Results
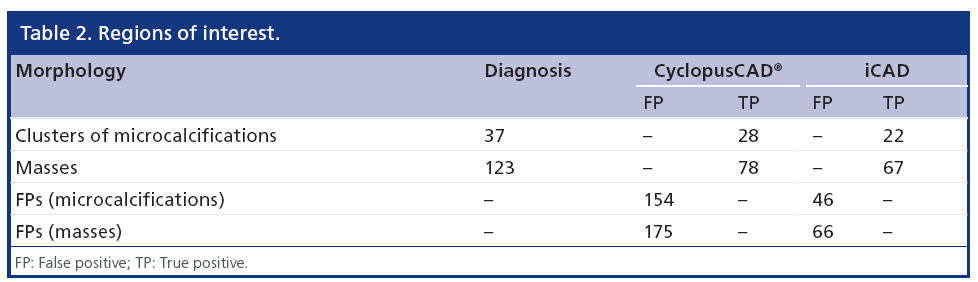
In performing the comparison of iCAD and Cyclopus- CAD, we took into account the possibility of changing the sensitivity threshold (its working point) offered by the latter system; more specifically, for CyclopusCAD we used five configuration points (high sensitivity, normal sensitivity, standard, normal specificity and high specificity). Figures 4 & 5 display the FROC curves used in an immediate head-to-head performance comparison between iCAD and CyclopusCAD; in the case of CyclopusCAD, the five different points corresponding to the five above-mentioned configurations have also been reported on the curve. More specifically, the FROC curve points corresponding to the mass lesions are represented in Figure 4, while the FROC curve points corresponding to the microcalcifications are represented in Figure 5. For comparison purposes, the points corresponding to the sensitivity and the number of FP/im in the case of iCAD are represented on the same figures. From a summary analysis of these figures, one can notice that the performances of the two CAD systems are fully comparable within the limits of the statistical error. Noticeably, CyclopusCAD can reach higher sensitivity levels due to the flexibility in choosing the threshold level configuration (the working point), conversely paying the specificity price with a higher number of FP/im. The diagnoses and the data related to the two CAD systems, including further details concerning the composition of the database used in this work, are given below in Table 2. In particular, the values corresponding to CyclopusCAD are referring to the standard threshold work point.
The parameters defined in the above paragraph and their corresponding relative statistical errors have been computed for both CAD systems and are presented in Table 3.
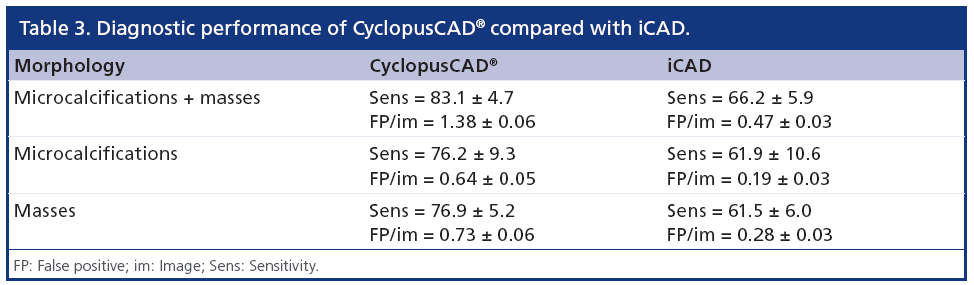
From Table 3, one can note that CyclopusCAD (at the standard threshold) is more sensitive than iCAD (83.1 vs 66.2%; p = 0.04), while the number of FP/im is higher in the case of CyclopusCAD with respect to iCAD (1.38 vs 0.47; p < 0.01). More specifically, if one distinguishes between mass lesions and microcalcifications, from one can note that concerning mass lesion identification, CyclopusCAD (standard threshold) is more sensitive than iCAD (76.9 vs 61.5%; p = 0.17), but at this working point, CyclopusCAD exhibits a number of FP/im of 0.73 versus 0.28 for iCAD (p < 0.01). Additionally, concerning the microcalcifications, demonstrates a better sensitivity for CyclopusCAD (at the standard threshold) with respect to iCAD (76.2 vs 61.9%; p < 0.01) and a number of FP/im of 0.64 for CyclopusCAD and 0.19 for iCAD (p < 0.01).
Discussion
This study was aimed to evaluate the performance of CAD in small breast cancers (the size distribution of pathologies analyzed has an average value of 1.2 cm) using FFDM.
It is debatable whether reporting the performance results of the CAD system alone rather than the radiologist performance with and without the CAD is a useful and correct approach, since in reality, at least at present, the diagnosis is never decided only by the CAD system. In the present article, we have deliberately chosen to follow this path because it is the only way to compare various commercial CAD systems meaningfully and provide radiologists valuable information concerning the qualities and features of these products; obviously, in order to make a meaningful test, all the CAD systems to be compared must run on a common database.
The average value of mass lesion sizes contained in the database used in this work is 12 ± 5 mm, while the average value of microcalcification clusters size is 11 ± 5 mm. The apparently poor performances of the CAD systems reported here in comparison with the performances mentioned in other CAD studies, are due to the composition of the database; the database contains lesions of small average size and are thus difficult to detect. The results are also heavily influenced by the high percentage of patients aged less than 50 years (39%).
The results obtained show that when choosing the ‘standard’ working point, CyclopusCAD was substantially more sensitive compared with iCAD. CyclopusCAD was less specific than iCAD, as shown by the higher FP rate and the higher average number of markings per view. The statistical content of the pathologic cases used in this work (especially in the case of the microcalcifications) most certainly does not allow highly significant comparisons; on the other hand, it displays an overall uniformity of performances of the two analyzed CAD systems.
Concerning the well-known ‘weakness’ of the CAD systems in terms of specificity, we agree with the opinion of those authors who claim that the CAD systems are essentially required to exhibit a high sensitivity and accept lower specificity levels, yet not so low to yield unacceptably high numbers of FP/im to be subjected to radiologists attention [11,26]. Indeed, many physicians prefer a very sensitive CAD to be used as a ‘first’, as well as a ‘second’ reader, even if the price to pay is its low specificity; in the first case, it is obvious that the subsequently higher warning rate should be revisited and corrected through the radiologists’ diagnosis work, while lower sensitivity levels would lead to unacceptably elevated risks to lose potentially early-stage pathological cases. On the other hand, in the clinical practice, the number of FP/im can act as a stimulus for the experienced radiologist to further examine the doubtful cases, which will be correctly rejected if not confirmed.
However, working at ‘low sensitivity’ mode is a very risky choice, especially if one wants to use the CAD as a first reader, because the inevitable increase in false negatives would lead to significant risks to the patients health and a subsequent increase in healthcare costs. However, in our opinion, CAD systems that allow the choice of the threshold are interesting since they leave the opportunity to the doctor to choose the optimal operating point depending on the intended use of the CAD: as a first reader (medium–high sensitivity) or as a second reader (low sensitivity).
Financial & competing interests disclosure
The authors D Cascio, F Fauci, G Raso, R Magro and R Ienzi are consultants and shareholders of CyclopusCAD Ltd. MS Vasile is an employee of CyclopusCAD Ltd. The authors have no other relevant affiliations or financial involvement with any organization or entity with a financial interest in or financial conflict with the subject matter or materials discussed in the manuscript apart from those disclosed.
No writing assistance was utilized in the production of this manuscript.
References
- American Cancer Society. Cancer Facts and Figures. American Cancer Society, Atlanta, GA, USA (2011).
- Warren Burhenne LJ, Wood SA, D’Orsi CJ et al. Potential contribution of computer-aided detection to the sensitivity of screening mammography. Radiology 215, 554–562 (2000).
- Ayer T, Ayvaci MU, Liu ZX, Alagoz O, Burnside ES. Computer-aided diagnostic models in breast cancer screening. Imaging Med. 2(3), 313–323 (2010).
- Blanks RG, Wallis MG, Moss SM. A comparison of cancer detection rates achieved by breast cancer screening programmes by number of readers, for one and two view mammography: results from the UK National Health Service breast screening Programme. J. Med Screen. 5, 195–201 (1998).
- Dinnes J, Moss S, Melia J et al. Effectiveness and cost–effectiveness of double reading of mammograms in breast cancer screening: findings of a systematic review. Breast 10, 455–463 (2001).
- Giger ML. Update on the potential of computer-aided diagnosis for breast cancer. Future Oncol. 6(1), 1–4 (2010).
- Baltzer PA, Schelhorn J, Dietzel M, Kaiser WA. Breast screening programs using MRI: is there a role for computer-aided diagnosis? Imaging Med. 2(6), 659–673 (2010).
- Singh V, Saunders C, Wylie L, Bourke A. New diagnostic techniques for breast cancer detection. Future Oncol. 4(4), 501–513 (2008)
- Bazzocchi M, Mazzarella F, Del Frate C, Girometti R, Zuiani C. CAD systems for mammography: a real opportunity? A review of the literature. Radiol. Med. 112, 329–353 (2007).
- Tangaro S, Bellotti R, De Carlo F et al. MAGIC-5: an Italian mammographic database of digitized images for research. La Radiologia Medica 113, 477–485 (2008).
- Ciatto S, Cascio D, Fauci F et al. Computer assisted diagnosis (CAD) in mammography. Comparison of diagnostic accuracy of a new algorithm (CyclopusCAD®, Medicad) with two commercial systems. La Radiologia Medica 114(4), 626–635 (2009).
- Cole EB, Zhang Z, Marques HS et al. Assessing the standalone sensitivity of computer-aided detection with cancer cases from the digital mammographic imaging screening trial. Am. J. Roentgenol. 199(3), W392–W401 (2012).
- Kim SJ, Moon WK, Kim SY, Chang JM, Kim SM, Cho N. Comparison of two software versions of a commercially available computer-aided detection (CAD) system for detecting breast cancer. Acta Radiologica 51(5), 482–490 (2010).
- Leon S, Brateman L, Honeyman-Buck J, Marshall J. Comparison of two commercial CAD systems for digital mammography. J. Digit. Imaging 22(4), 421–423 (2009).
- Retico A. Computer-aided detection for pulmonary nodule identification: improving the radiologist’s performance? Imaging Med. 5(3), 249–263 (2013).
- Masala GL, Tangaro S, Golosio B et al. Comparative study of feature classification methods for mass lesion recognition in digitized mammograms. Nuovo Cimento della Societa Italiana di Fisica C 30(3), 305–316 (2007).
- Masala GL, Golosio B, Oliva P et al. Classifiers trained on dissimilarity representation of medical pattern: a comparative study. Nuovo Cimento della Societa Italiana di Fisica C 28(6), 905–912 (2005).
- tani M, Griffin AT, Whitman GJ. Mammography of breast calcifications. Imaging Med. 5(1), 63–74 (2013).
- Fauci F, Bagnasco S, Bellotti R et al. Mammogram segmentation by contour searching and massive lesions classification with neural network. IEEE Nucl. Sci. Symp. Conf. Rec. 5, 2695–2699 (2004).
- Vivona, L, Cascio, D, Magro, R, Fauci, F, Raso, G. A fuzzy logic C-means clustering algorithm to enhance microcalcifications clusters in digital mammograms. IEEE Nucl. Sci. Symp. Conf. Rec. 6152551, 3048–3050 (2012).
- Cascio D, Fauci F, Iacomi M, Magro R, Raso G. Automatic detection of lung nodules in CT datasets based on stable 3D mass-spring models. Comput. Biol. Med. 42(11), 1098–1109 (2012).
- Cascio D, Cheran SC, Chincarini A et al. Automated detection of lung nodules in low-dose computed tomography. Comput. Assist. Radiol. Surg. 2(Suppl. 1), S357–S359 (2007).
- Fauci F, La Manna A, Cascio D et al. A Fourier-based algorithm for microcalcification enhancement in mammographic images. IEEE Nucl. Sci. Symp. Conf. Rec., 4774254, 4388–4391 (2008).
- Magro R, Cascio D, Fauci, F et al. A method to reduce the FP/imm number through CC and MLO views comparison in mammographic images. IEEE Nucl. Sci. Symp. Conf. Rec. 4774249, 4364–4367 (2008).
- Cascio D, Fauci F, Magro R, Raso G. Method for processing biomedical images. Medicad S.r.l. WO 2007/119204 A2 (2007).
- Hupse R, Samulski M, Lobbes M et al. Standalone computeraided detection compared to radiologists’ performance for the detection of mammographic masses. Eur. Radiol. 23(1), 93–100 (2013).
- Almat DG. Practical Statistics for Medical Research. Chapman & Hall/CRC London, UK (1991).
- Baker JA, Rosen EL, Crockett MM, Lo JY. Accuracy of segmentation of a commercial computer-aided detection system for mammography. Radiology 235(2), 385–390 (2005).


