Review Article - Imaging in Medicine (2013) Volume 5, Issue 3
Computer-aided detection for pulmonary nodule identification: improving the radiologists performance?
Alessandra Retico*Istituto Nazionale di Fisica Nucleare, Sezione di Pisa, Largo Bruno Pontecorvo, 3, I-56127 Pisa, Italy
- Corresponding Author:
- Alessandra Retico
Istituto Nazionale di Fisica Nucleare
Sezione di Pisa, Largo Bruno Pontecorvo
3, I-56127 Pisa, Italy
Tel: +39 050 221 4459
Fax: +39 050 221 4460
E-mail: alessandra.retico@pi.infn.it
Abstract
Keywords
classification ▪ computer-aided detection ▪ feature extraction ▪ ground-glass opacity ▪ lung cancer ▪ observer study ▪ performance evaluation ▪ segmentation ▪ solid nodule
Computer-aided detection (CAD) systems devoted to the automated identification of pulmonary nodules on chest CT have been deeply investigated in the last two decades [1–9], as they could represent a valuable tool to provide radiologists with a second opinion. CAD systems integrated in routine clinical practice could assist physicians by highlighting complementary information encoded in biomedical images, thus possibly shortening the diagnostic algorithm of a large variety of pathologies. With the advance of imaging technology, the number of diagnostic images to be reviewed by medical experts is increasing, together with the demand for automated tools for image interpretation. This happens in many fields of diagnostic radiology and in particular in the framework of screening protocols for early detection of lung cancer with lowdose CT. A significant reduction in lung cancer mortality in the study participants screened with low-dose CT with respect to participants screened with x-rays has recently been reported [10,101]. This result strongly supports large-scale screening for lung cancer and constitutes a boosted motivation for lung CAD development.
In a large-scale screening context, radiologists are faced with the challenging task of identifying subtle abnormalities on a very noisy background. Moreover, they are required to review a large number of images for each patient. Small pulmonary nodules are considered to be primary signs of early-stage lung cancers. Several CAD schemes for automated lung nodule identification have been developed in the recent years to aid radiologists in this complicated task and many of them are robust enough to be integrated in a lung screening workflow [11–28].
The subject of CAD for pulmonary nodule detection and diagnosis has been covered by detailed reviews since early lung CAD developments [1–4], providing a historical overview of the context that gave rise to the CAD concept [3,5]. Comprehensive reviews on the research carried out in more recent years have already been presented [5–9]. The peculiarity of the present review is that it discusses mainly two categories of research papers: the first one consists of papers describing full systems devoted to lung nodule automated identification; the second one is papers reporting the evaluation of CAD systems as second readers. This work is especially focused on the CAD research activity carried out during the last 5–6 years, that is, since 2007, with the aim of highlighting the current trends and the unanswered issues in this research area. The recent availability of extensive computing power has allowed sophisticated approaches to become rapidly executable and decisional algorithms to be trainable on large databases, more accurately resembling the underlying population being studied. This work aims to complement the existing reviews by providing young researchers in this field with a brief overview of the analysis methods generally implemented to process CT data in order to automatically extract useful information. Moreover, the review will also stress the importance of conducting appropriate tests to assess whether or not the developed CAD systems are effective aids for radiologists. In particular, this article aims to give an overall idea of the long process, from the design and development of a CAD system for lung nodule detection to its use in clinical practice.
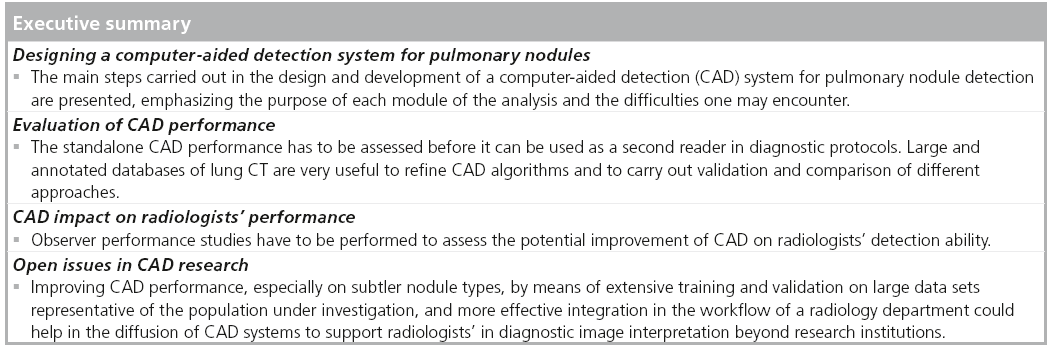
Designing a CAD system for pulmonary nodules
The strategies adopted in the attempt to automatically detect lung nodules in CT images are many and various, and depend on the type of nodules to identify. First of all, it is necessary to define the target of a lung CAD. Lung nodules can be categorized according to their shape, location and possible connections with anatomical structures: isolated nodules are rather spherical abnormalities fully embedded within the lung parenchyma; perivascular nodules appear to be connected to the vascular tree; juxtapleural nodules include both hemispherical nodules originating in the pleura and growing towards the lung parenchyma, and nodules with almost spherical shape, connected to the pleura through a tail (Figure 1) [29]. Lung nodules can also be distinguished according to their CT contrast into solid and part-solid or ground-glass nodules.

As lung nodules may differ either in shape or intensity, they are characterized by a large variety of features that the algorithms have to be trained to interpret. In many cases CAD systems are developed with the aim of detecting all type of nodules at the same time. However, specific approaches can be developed independently for each nodule type [16,19], and complementary algorithms can finally be integrated [25]. Regardless of the type of nodule it is targeted to detect, a CAD algorithm can generally be schematized in three steps, as described in Figure 2: first the data undergo a preprocessing step, such as filtering and/or resampling algorithms, and often lung parenchyma segmentation – that is, the identification of the lung tissue with respect to the surrounding different anatomical structures; then, the initial selection of nodule candidates is performed; finally, the list of nodule candidates is optimized by eliminating as many false positives as possible. Each step of this scheme is discussed in detail in the following sections.

Figure 2: Generic flowchart of a computer-aided detection system for lung nodule identification. The main steps of the
algorithm are represented. The circles represent CAD marks.
CAD: Computer-aided detection.
■Image preprocessing
As a preliminary step of the analysis, many authors implement filters, such as Gaussian filters, to reduce noise in the images and resample data in order to have isotropic voxel sizes. Procedures to enhance interesting structures may be applied, such as spherical-shaped object enhancement filters [30] or multiscale enhancement filters, to suppress blood vessels and highlight nodule-like structures [15,16,31]. As real nodules may strongly differ from the nodule models used in conventional filtering procedures, a supervised filter based on the massive-training artificial neural network approach [32] was trained with actual nodules to enhance actual patterns of nodules [33].
A second preprocessing step identifies the target volume for the automated search of lesions. The aim of this segmentation task is both to reduce the computational costs of CAD execution and to avoid for example unwanted CAD marks pointing at anatomical structures external to the lungs. There are studies fully dedicated to the development of specific algorithms for accurate lung parenchyma identification [22,34–36]. This not straightforward task is further complicated when an elderly population is investigated due to the complexity of the anatomical structures, especially in the presence of underlying lung diseases [34,35]. The accuracy of the lung segmentation step is crucial, especially when dealing with the identification of juxtapleural nodules. In this case, depending on the planned detection algorithm, the lung segmentation step is required either to include or exclude the pleural abnormalities (including juxtapleural nodules) in the segmented lungs.
The lung segmentation step is crucial to determine the maximum sensitivity of the CAD systems (the sensitivity is defined as the percentage of nodules correctly identified by the CAD system); lung nodules excluded from the segmented volume at this stage will be definitely missed by the detection systems.
The validation of lung segmentation algorithms is far from being trivial, and a large public database with a well-defined ground truth would be needed. Performance comparison between various methods has low significance.
The segmentation of structures in medical images still represents a challenging task many research groups try to deal with, such as by the implementation of innovative methods based on shape analysis strategy [37] or an improved marching cube algorithm [38].
■Nodule candidate identification
A crucial task in the development of a CAD scheme for nodule detection is the initial selection of nodule candidates. This consists of implementing suitable image processing techniques to highlight suspicious regions of the images where lung nodules may be located. Working in the segmented lung regions, CAD developers can alternatively implement the following three main categories of approaches: intensity-based algorithms, shape-based approaches and template-matching procedures.
Algorithms that exploit the CT intensity information belong in the first category; they rely on the assumption that lung nodules have higher relative intensity than those of lung parenchyma. Among the intensity-based methods applied to identify nodule candidates are the multiple graylevel thresholding techniques [23,39]. In this case, the segmented lung volume is applied to a series of gray-level thresholds, leading to a series of thresholded lung subvolumes, which are selected as initial lung nodule candidates in case they satisfy a volume criterion [39]. The intermediate candidate masks obtained for each threshold in the multiple-threshold approach can also be processed by specific morphological opening operation and finally combined by the logical disjunction (OR) operation to obtain the final nodule candidate masks [23]. The initial selection of nodule candidates can also be based on a multithreshold surface-triangulation approach [22]. In this case, the surface triangulation is performed at different threshold values over a wide range. At each threshold value a nodule candidate is defined as the volume inside a connected component of the triangulated isosurface [18]. Multithreshold nodule candidates are defined as a path of the tree-like structure that represents the evolution of a nodule candidate as a function of the threshold values. Instead of applying multiple thresholds, it is also possible to carry out a local-adaptive thresholding approach [18,40]; in this case an adaptive threshold that automatically converges to the optimum gray level value that separates the higher density regions from the background is applied to the segmented lung volume to identify nodule candidates [18]. Intensity thresholding can be combined with morphological processing [14,23] or rule-based pruning [41] to detect and segment nodule candidates simultaneously. Another intensity-based method for nodule candidate identification is the region-growing algorithm, where seed points are iteratively chosen from the segmented lung volume [14]. In particular, the segmented volume is scanned until a voxel satisfying the region-growing inclusion rule is found; that voxel is used as a seed point and the growth starts; once the region is completely grown, it is removed from the CT and stored for further analysis; then, the search for new seed points is iterated until no more seed points satisfy the inclusion rule [14].
The second category consists of methods that exploit the shape properties of the objects to be detected, in addition to their intensity. Nodules are considered to be nearly rounded objects and thus suitable features that highlight the local sphericity characteristic of image regions are computed to identify nodule candidate locations. Since the pioneering work of Li et al. [31], many authors have implemented the selective filter for nodule enhancement and suppression of normal anatomic structures such as blood vessels, which are the main source of false positives [15,16,20,25]. This filter is based on the computation of the eigenvalues of the Hessian matrix at each voxel location, which can be quite time consuming. Subsequent thresholding of the filter output map allows identification of nodule candidates. This filter can be complemented with the computation of a volumetric shape index map based on a Gaussian filter and mean curvature [20,21]. Among the shape-based methods, some are dedicated to almost hemispherical objects, such as juxtapleural nodule candidates. In particular, gradient-based filters are used to enhance the convexity of the pleura surface [19,42].
The third category of nodule candidate identification algorithms consists of template-matching methods [13,40,43]. In this case, nodule models are created, taking into account variability in shape, size and location of true nodules in the lungs. The calculation of the correlation coefficient between templates and lung subregions allows the identification of nodule candidates. The possibility of carrying out a template-matching technique is not limited to matching in the voxel space, but it can be extended, for example, to the feature space, as in the case of the shape-based genetic algorithms template-matching method proposed by Dehmeshki et al. [12].
The nodule candidate selection step requires the highest possible sensitivity because nodules missed at this stage cannot be recovered in the later steps of the analysis.
■Nodule candidate classification or false-positive reduction
After their first identification, nodule candidates have to be characterized in terms of image properties, often referred to as features, which can be handled and investigated by machine-learning approaches. This step of the analysis is referred to as nodule candidate classification, which aims to label each entry of the initial list of candidate nodules either as a CAD finding, according to a certain degree of suspicion, or as a portion of normal tissue. The classification step has the essential role of reducing the number of false-positive detections generated by the nodule candidate selection algorithm. The number of nodule candidates corresponding to false-positive detections can be quite large at this stage, depending on how strict the requirement of maintaining the highest possible maximum sensitivity was up to this stage. This is the first step of the analysis where some nodules can be missed. In general, a compromise should be reached between the need to have high sensitivity to lung nodules and the need to avoid too many confounding CAD marks being shown to the radiologists. The aim of this step of the analysis is to improve the specificity of the CAD system, while keeping the sensitivity as high as possible.
Two main strategies are generally implemented: the characterization of the nodule candidate by its global shape- and/or intensity-based features [11,12,14,15,18–23,26–28,44]; and the characterization of the nodule candidate at the voxel level [16,19,32,33]. Both approaches require segmentation of the nodule candidates, then the feature extraction, and finally the feature classification. The accuracy of the nodule segmentation step is particularly important in the first approach, where the computed features strictly depend on the shape of the segmented nodule candidate. The accurate segmentation of lung nodules is even more important for reliable computations of the nodule doubling time; thus, research on this particular issue is very active [45–47]. The voxel-based approaches to falsepositive reduction are, in principle, less affected by nodule segmentation accuracy. With the current increasing availability of computational power, the current trend is to classify every single voxel of a diagnostic image, bypassing the candidate selection and characterization steps [48]. However, this choice is still not efficient in the case of 3D CT data, such as the CT data acquired in lung cancer screening. The global features generally computed on the nodule candidates are gray-level based features, texture features and morphological features. They are all encoded in a vector of features and finally classified by machine learning approaches. In contrast, when characterizing nodule candidates at the voxel level, each voxel is assigned a number of features extracted from its neighborhood, then each voxel is classified by a decisional system and a majority criterion has to be implemented to finally assign the nodule candidate to either the nodule or healthy tissue class.
In the classification of nodule candidates, which are represented in terms of the vectors of features extracted from either each nodule candidate or each voxel of each nodule candidate, pattern-recognition techniques are generally implemented. Among them, artificial neural networks (ANNs) are very popular [49], and linear discriminat analysis (LDA) [50] and support vector machines [51] are also widely used.
The choice of the minimal amount of features to properly characterize the nodule candidates and carry out an efficient reduction of false positives is a nontrivial task and it is still a matter of investigation. If many features are considered, such as in the voxel-by-voxel classification approach, possible drawbacks are high computational time and overfitting of the classifiers. By contrast, if an overly restrictive set of features are chosen to characterize the nodule candidate, they could not encode all necessary information to get an accurate classification performance. In choosing the number of features to characterize the nodule candidates and in designing the appropriate classifier to handle them, some practical considerations have to be made about the availability of training cases. CAD developers have to take into account the finite size of available cases to train, test and validate the CAD system, and that the sample size affects the classifier performance [52].
Evaluation of CAD performance
Once the design and development of a CAD scheme has been completed, it is very important to make a reliable estimate of its standalone performance. Although the CAD system has been developed with the aim of using it as a second reader of diagnostic images, it is necessary to fully characterize its own performance before its impact on radiologists’ performance can be evaluated. Although research on CAD has been very active in the recent years, it is difficult to carry out a fair comparison among the performance of systems developed by different research groups. As already pointed out by many authors, a reliable comparison of the nodule detection ability of different systems could be done only on common databases. The rapid growth of CAD algorithms over the last two decades has simultaneously triggered the development of the appropriate methodology to carry out CAD performance assessment, and also highlighted the necessity of the availability to CAD developers of a large, clinically relevant and annotated database to test and validate their systems.
■Publicly available databases
CAD researchers very often develop their algorithms on private lung CT databases collected and annotated in medical centers accessible within specific research networks and projects. However, it is currently possible to also access public databases of annotated CT images. Useful repositories of annotated lung CT images are those released by the Early Lung Cancer Action Program in 2003 [102] and by the Lung Image Database Consortium (LIDC) [103] funded by the National Cancer Institute in 2000. The aim of the LIDC was to develop consensus guidelines for a spiral CT lung image resource and to construct a database of spiral CT lung images [53]. Another dataset of lung CT scans is accessible within the ANODE09 initiative (see ‘comparing the performance of recently developed CAD’ section) [54,104], which contains data from the NELSON study, the largest CT lung cancer screening trial in Europe [105]. In this case, the CT annotations are not available on the website; however, CAD developers can submit the output of their systems for each case to the organizers and the CAD performance will be evaluated and published on the website.
All these initiatives promote the early detection of lung cancers by supporting the research of image processing tools and CAD and the diagnosis of lung nodules.
■Comparing the performance of recently developed CAD
Although public databases of lung CT scans acquired with screening setting protocols are becoming available, it is not yet a common practice for CAD developers to validate their CAD systems on a public dataset and to discuss the results achieved in comparative research papers. However, many groups still develop and validate their systems on private data sets and a fair comparison among the performance achieved is not possible. Table 1 reports the results achieved by recently developed innovative approaches to CAD of pulmonary nodules in thin-slice CT exams. The publication year of the results, the dataset used, slice thickness, the number of CT cases and the number, size and, possibe type of nodules are reported, in addition to the performance information expressed in terms of sensitivity and false-positive detection per scan (FP/scan).
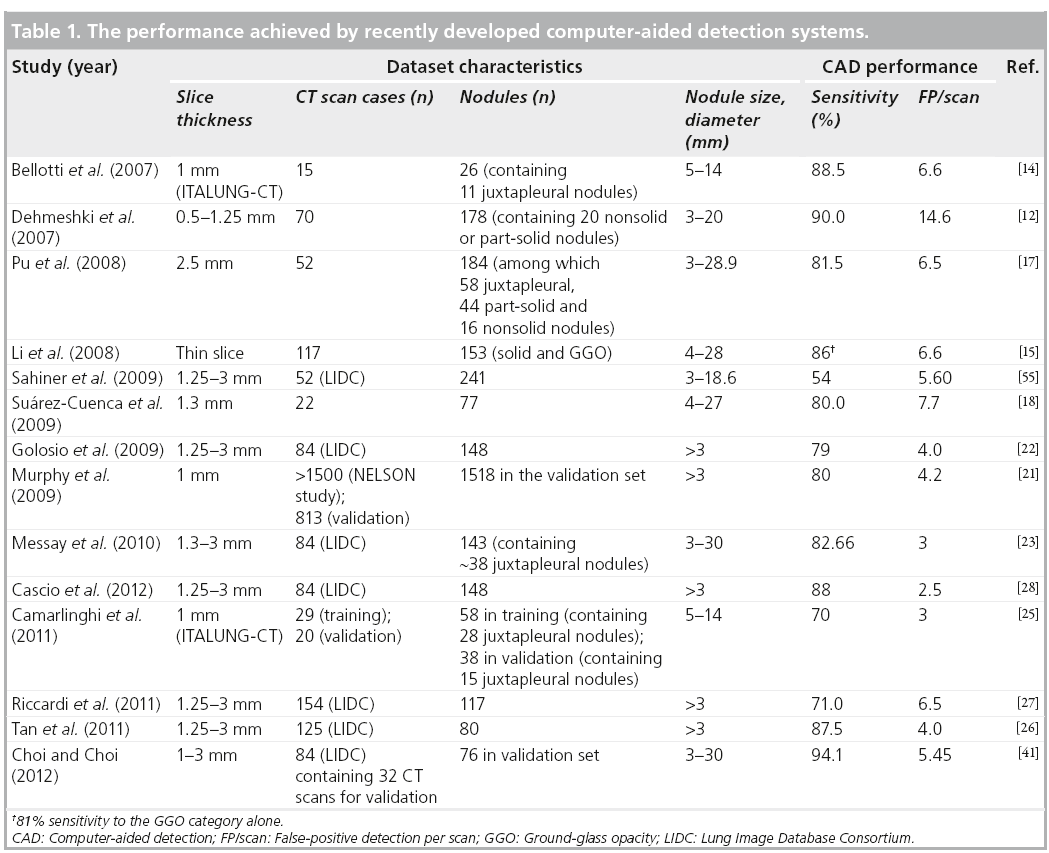
Several CAD systems were recently developed using the LIDC database [22,23,26–28,41,55,56], as reported in Table 1. Sahiner et al. used adaptive 3D clustering and a 3D active contour algorithm to detect nodule candidates; clustering initialized by k-means was then used for segmentation of the nodule candidates, further characterized by three groups of features [55]. An automated discrimination between internal and juxtapleural nodules was performed before applying rule-based classification and LDA to both the juxtapleural and internal nodule candidates. Validation of the CAD system on an independent dataset of 52 CT scans containing 241 nodules in the 3–18.6 mm diameter range achieved 54% sensitivity with 5.60 FP/scan. Golosio et al. selected the nodule candidates by means of a multithreshold surface-triangulation approach; shape- and intensity-based features were then computed at each threshold on nodule candidates and classified by ANNs [22]. Following a twofold crossvalidation protocol, the system achieved a 79% sensitivity at 4.0 FP/scan in the detection of nodules with a diameter greater than or equal to 3 mm on a dataset of 84 CT scans containing 148 nodules. Messay et al. developed a sequential forward selection process for selecting the optimum features for LDA and quadratic discriminant analysis [23]. They obtained a sensitivity of 83% with 3 FP/scan on a dataset of 84 CT scans containing 143 nodules in a sevenfold cross-validation test. Riccardi et al. implemented a 3D fast radial filtering system to select nodule candidates and a heuristic approach based on geometric features, followed by a support vector machine for classification [27]. Following a twofold crossvalidation protocol, the CAD system achieved a sensitivity of 71% with 6.5 FP/scan on a dataset of 154 CT scans containing 117 nodules. Tan et al. developed a feature-selective classifier based on a genetic algorithm and ANNs for classification [26]. They achieved a sensitivity of 87.5% with 4.0 FP/scan on an independent validation set of 125 CT scans containing 80 nodules. Choi and Choi developed a classifier based on genetic programming to process 2D and 3D features of nodule candidates identified by optimal multiple thresholding and rule-based pruning applied to the lung volume segmented by thresholding and 3D-connected component labeling [41]. They obtained 94.1% sensitivity with 5.45 FP/scan on a subset of 32 CT scans containing 76 nodules in the 3–30 mm range. Cascio et al. used a stable 3D mass–spring model combined with a spline curve reconstruction process to detect nodule candidates, taking into account both intensity and shape information [28]. A double-threshold cut on candidate features and a neural classifier were then implemented to reduce false-positive detections. The CAD performance was evaluated through a cross-validation procedure on a dataset of 84 CT scans containing 148 nodules with a diameter greater than or equal to 3 mm, obtaining sensitivity values of 97 and 88% with 6.1 and 2.5 FP/scan, respectively, at two different operative points the CAD system can run on.
Many other valuable CAD approaches on private data sets have been developed and validated [12,14,15,17,18,21,25], as reported in Table 1. Bellotti et al. developed a CAD system based on region growing algorithms and a new active contour model implementing a local convex hull, able to draw the correct contour of the lung parenchyma and to include the pleural nodules [14]. Rule-based classifiers and ANNs are implemented in a leaveone- out cross-validation protocol. The system achieved a sensitivity of 88.5% with 6.6 FP/scan on 15 CT scans containing 26 nodules, acquired within the ITALUNG-CT trial, the first Italian randomized controlled trial for the screening of lung cancer [57]. Dehmeshki et al. implemented a shape-based genetic algorithm template-matching method for the detection of nodules with spherical elements [12]. Lung nodule phantom images were used as reference images for template matching. This method has been validated on a clinical dataset of 70 thoracic CT scans containing 178 nodules, achieving a sensitivity of 90% with 14.6 FP/scan. Pu et al. developed a detection procedure in the signed distance field of the image [17]. Nodule candidates are detected by searching local maxima of signed distances; detected candidates are then classified according to the similarity distance of their medial axis-like shapes obtained through a progressive clustering strategy combined with a marching cube algorithm from a sphere-based shape. This system achieved a sensitivity of 81.5% with 6.5 FP/scan on a dataset of 52 CT scans with 184 nodules, including 16 nonsolid nodules. Li et al. implemented the selective nodule enhancement filter in the nodule candidate identification procedure and automated rule-based classifier to reduce false-positive detections [15]. A case-based fourfold cross-validation testing method led to an overall sensitivity of 86% with 6.6 FP/scan on a dataset of 117 CT scans with 153 nodules, including both solid and nonsolid nodules. Suárez-Cuenca et al. developed a CAD system based on the capability of an iris filter to discriminate between nodules and false-positive findings [18]. Suspicious regions were characterized with features based on the iris filter output, gray level and morphological features, and finally classified by LDA. The system achieved a sensitivity of 80% with 7.7 FP/scan on an independent validation dataset of 22 CT scans containing 77 nodules. Murphy et al. proposed an algorithm based on local image features of shape index and curvedness to detect nodule candidates and two successive k-nearest neighbor classifiers to reduce false positives [21]. The CAD was trained and tested on three databases extracted from a large-scale experimental screening study. The system performance was evaluated on a random selection of 813 scans, leading to a sensitivity of 80% with an average 4.2 FP/scan. The extensive training and validation of the system on large data sets of nodules of varying sizes, types and textures allows for a realistic measure of the CAD system performance in low-dose screening CT studies. Camarlinghi et al. developed two dedicated and integrated procedures to detect both isolated and juxtapleural lung nodules [25]. The selective nodule enhancement filter and the directional gradient concentration approach are used in the internal and pleural nodule candidate selection steps, respectively. A sensitivity of 70% with an average of 3 FP/scan was achieved on an independent validation set of 20 CT scans of the ITALUNG-CT screening trial, containing 38 nodules.
It is evident from Table 1 that even when the publicly available LIDC database is used for CAD development and validation, the number of considered cases is not consistent among different studies. Not considering the different cardinality of the training and test sets among the various studies, the performance achieved on LIDC data sets spans the 54−97% range of sensitivity and 3−6.5 FP/scan. On private data sets of lung CT scans, values of sensitivity are in the 70−90% range and values of FP/scan of 3−14.6 have been reported. If the numbers of FP/scan are compared between the systems whose performance is given on LIDC dataset, it can be asserted that the CAD systems developed by Messay et al. [23], Cascio et al. [28], Tan et al. [26] and Choi and Choi [41] outperform the others. As they are evaluated at different operating points, a direct comparison among them cannot be performed.
Among the most challenging tasks reported by CAD developers is the difficulty in the identification of ground-glass opacity (GGO) nodules strongly connected to the vasculature or to the pleura surface. These types of nodules often happen to be false negatives of CAD systems, and still represent an open issue in lung CAD research.
■Combining different CAD algorithms leads to improved performance
CAD systems implementing different approaches to detect lung nodules may generally be characterized by high sensitivity to a particular nodule type, while being less accurate in detecting nodules with a different appearance. Mimicking the multiple reader algorithm often used in diagnostic protocols, lung CT data can be processed by many CAD systems and their outputs can be compared and possibly automatically combined [54,58,59]. The combination of different CAD systems extends the concept of the multiple classification problem, a known research issue in pattern recognition [60]. The classification step is only the final task of a CAD algorithm, and the maximum sensitivity of the system has often already been reduced at that stage. The potential beneficial impact of the combination of different CAD systems lies in the principle that even less-performing systems can contribute to the enhancement of the detection accuracy.
To avoid the mere summation of false-positive findings, the outputs of different CAD systems have to be merged according to an appropriate criterion.
When two independent systems analyze two nonoverlapping or partially overlapping regions of interest, such as the lung parenchyma and the pleura surface, searching for different types of nodules [16,19], the CAD output of the two systems could, in principle, merely be merged. However, in the choice of the operating point at which each system works, the relative weight between the two CAD systems has to be at least empirically determined [25].
General practical methods to combine many system outputs have been proposed by van Ginneken et al. [54] and Niemeijer et al. [58]. Those authors have organized a lung CAD challenge, the ANODE09 competition [104], where CAD developers were asked to blindly validate their CAD systems on a wide lung screening dataset (55 CT scans extracted from the NELSON study) by uploading their CAD findings on a web-based framework for CAD performance evaluation. As reported in [54], the combination of the outputs of algorithms, even characterized by different performances, led to an overall improvement in nodule detection ability.
A similar study conducted on 138 cases of the LIDC database demonstrated that the combination of the output of three different CAD systems [14,24,25,61], contributes to the reduction of false positives by exploiting the CAD complementarity [59]. A dedicated plug-in for the OsiriX open-source DICOM viewer [106] has also been developed to interactively review each CAD output and their combination at different operating points [59].
■Is there any winning strategy in nodule detection?
The large variety of CAD strategies for lung nodule identification adopted in recent years strongly suggest the absence of a single method that clearly outperforms the others. Each approach has its own strengths and weaknesses and the complexity and variety of nodule appearance both with respect to the anatomical location and contrast causes the detection algorithms to fail to reach 100% sensitivity. Despite this consideration, CAD systems can still represent useful aids in the diagnostic image reviewing process and they have to be accurately set up and their performance evaluated according to universal criteria shared by different research groups. As a general consideration, among the large variety of CAD approaches, those that are less affected by the presence of empirical thresholds set on available data guarantee a better generalization ability, thus are preferable. It would be desirable in any case that authors themselves show in their reports how the performance of their systems is reliable on wide data sets of previously unseen data. Now that large data sets of CT data are becoming available, it is hoped that researchers will reach an agreement on which data to use in the different steps of the CAD training procedure in order to carry out highly instructive comparisons of different methods, with the possibility of mixing and merging the different procedures implemented at each stage of the analysis.
Impact of CAD on the radiologist’s performance
The active field of research on CAD systems aims to develop algorithms and procedures able to provide radiologists with a second opinion on diagnostic image interpretation, thus to facilitate and accelerate the diagnosis of a large variety of pathologies. It is very important that CAD systems show satisfactory standalone performance, but it is even more important that they have a complementary ability with respect to the radiologist’s expertise in detecting lesions. It has been necessary to develop appropriate instruments to assess the impact of CAD on the radiologist’s performance. Observer studies allow the assessment of the diagnostic accuracy of radiologists with and without the use of CAD systems.
■How to carry out an observer performance study
To assess the potential clinical usefulness of a CAD system, observer studies have to be conducted. To evaluate the impact of CAD as a second reader on the radiologist’s detection ability, the observer performance has to be evaluated before and after the CAD output is shown and make a statistical comparison of the performance achieved. Usually two to ten radiologists with different levels of experience in image annotation participate in the study. The possible improvement of the radiologist’s performance when using CAD has to be evaluated according to statistically relevant protocols. For example, the jackknife free-response receiver operating characteristic (JAFROC) analysis can be implemented [62,63]. The JAFROC figure of merit is the probability that lesions are rated higher than false-positive marks on normal images. With respect to other statistical comparison procedures, the JAFROC method has shown an improved statistical power that can allow for a reduced sample size requirement for the observer study.
Both radiologists and CAD systems have to be evaluated against a dataset of annotated CT cases. The consensus achieved by two experienced radiologists or by an expert panel is usually implemented as the reference standard.
■Is CAD improving the radiologist’s performance?
CAD systems have the potential to improve the radiologist’s performance in detecting lung cancer. Especially in large-scale screening programs of an asymptomatic population, subtle early-stage lung nodules can be overlooked [64].
The efficacy of CAD systems in detecting nodules missed in CT screening programs has been demonstrated [65,66]. Moreover, numerous studies report that the use of CAD systems improved the radiologist’s diagnostic accuracy [55,67–70]. The impact of CAD systems on the diagnostic workflow has been demonstrated to be beneficial, especially in lung screening settings [71–73].
The choice of the operative point at which the CAD systems have to work in an observer performance study is not trivial. If high sensitivity levels are chosen, the drawback is that a high number of false-positive marks may be shown to the radiologists. An acceptable number of marks to be reviewed for possible rejection by the radiologists is approximately five per case. Longer lists of CAD marks may lead to increased reading time and cause radiologists to avoid using CAD. Under this condition, the observer study of Beigelman-Aubry et al. on 54 pairs of CT scans containing nodules with diameters ≥4 mm, involving two radiologists and a commercial CAD system, demonstrated an improvement in the radiologist’s sensitivity, while the overall reading time on the CAD workstation and on the clinical workstation was comparable [71]. Furthermore, Beyer et al. investigated the impact of a commercial CAD system on radiologists’ sensitivity and reading time [67]. The study involved four radiologists reviewing 50 CT scans containing lung nodules with diameters ≥4 mm. When using CAD as a second reader, the radiologists’ sensitivity improved from 68 to 75% at the cost of longer reading times. Fraioli et al. conducted an observer performance study on 200 CT scans with screening characteristics [72]. The study involved three radiologists with variable experience, whose sensitivity to lung nodules had been found to be 57, 68 and 46%. With CAD used as a second reader, sensitivity significantly improved up to 94, 96 and 94%, respectively. Hirose et al. conducted a JAFROC study on six expert radiologists reviewing the CT exams of 21 subjects [68]. The standalone CAD sensitivity to lung nodules was 71.4% with 0.95 FP/scan. The average radiologists’ sensitivity improved significantly from 39.5 to 81.0% when using CAD. Das et al., in an observer study involving two radiologists reviewing 77 CT exams, showed a benefit in the sensitivity of the two radiologists of between 8 and 24% when using CAD [69]. White et al. conducted a multicenter observer performance study involving ten radiologists with variable levels of experience reviewing 109 CT cases acquired with different CT scanners, containing nodules with diameters ≥4 mm [70]. The average increase in the performance for the ten readers with CAD software was 1.9% for a 95% CI (0.8–8.0%). Sahiner et al. carried out a JAFROC experiment on a dataset of 85 CT exams, involving six radiologists [55]. A statistically significant improvement in radiologists’ average sensitivity from 56% at 0.67 FP/scan to 67% at 0.78 FP/scan has been achieved on nodules with diameters ≥3 mm, whereas no significant improvement has been obtained on nodules with diameters ≥5 mm, thus indicating an enhanced sensitivity to small nodules, which are those more easily overlooked on visual inspection. Bogoni et al. evaluated the impact on radiologists’ performance of a commercial CAD system integrated with the picture archiving and communication system (PACS) environment [73]. The average sensitivity of five radiologists evaluated on 48 CT exams improved from 44 to 57% for nodules with diameters ≥3 mm, whereas the number of false-positive detections significantly increased for only two radiologists. The integration of CAD into PACS increased reader sensitivity with minimal impact on interpretation time.
Most studies reporting on observer performance studies actually carry out a statistical comparison between the averaged sensitivity values shown by the radiologists before and after they are shown the CAD marks. However, to evaluate whether the entire performance has changed – that is, both in terms of sensitivity and FP/scan, a more complete analysis would be recommended, such as the JAFROC method. As shown in the reported studies, this powerful approach is rarely implemented. This is probably due to two main reasons: to conduct a JAFROC study the radiologists have to assign degrees of suspicion to their findings, which is a more timeconsuming task; and the CAD algorithms have to provide a nonbinary output, which is, in general, not available, especially for commercial CAD systems.
Open issues in CAD research
■Dedicated CAD for solid & part-solid nodules
As stated before, nodules with GGO appearance (part-solid and part-nonsolid nodules) are more difficult to detect. They are characterized by low contrast with respect to the background and ill-defined boundaries, thus they appear subtler with respect to solid nodules and are often missed by CAD algorithms. The likelihood of malignancy for GGO nodules is much higher than that for solid nodules [74].
Despite some of the CAD systems including nonsolid nodules among the detected nodules [12,15], dedicated approaches have been also attempted [75–77]. Kim et al. proposed a method to detect pure nonsolid nodules based on the analysis of overlapping regions of a CT scan by computing 2D texture and Gaussian fitting features, finally classified by ANNs [75]. Ye et al. implemented geometric shape features (e.g., shape index and dot enhancement) calculated for each voxel and then thresholded to detect nodule candidates; false-positive detection was removed by rule-based filtering [76]. On a dataset of 50 CT scans containing 52 GGO nodules, the system achieved a sensitivity of 92.3% at 12.7 FP/scan. This dedicated approach has been further refined in a later work by Ye et al., where a CAD system of a dataset of clinical lung CT was developed and validated to detect both solid and GGO nodules [20]. Jacobs et al. based their dedicated system on the computation of a rich set of intensity, shape and context features to accurately describe the appearance of this type of nodule [77]. A two-stage classification method based on LDA and GentleBoost classifier led to a detection sensitivity of 73% at only one FP/scan on a dataset of 140 CT scans acquired in a screening trial.
Although dedicated approaches to GGO detection are needed due to the different appearance of GGOs with respect to solid nodules, it is desirable that GGO-dedicated CAD modules are integrated into existing CAD approaches for other nodule types in order to get the most from the complementarity of these systems.
■CAD integration in the clinical workflow
It is now widely agreed that the appropriate use of CAD is as a second reader of diagnostic images, which means that radiologists carry out a first interpretation of the CT exam, then review the CAD output, and finally take the final decision. Although many CAD systems show high standalone performance and have been demonstrated to enhance the radiologists’ ability in detecting lung cancers, their use is still not widespread in clinical practice. There are many obstacles to be overcome before CAD can be used daily in the clinical reading environment [78,79]. Some are related to the reliability and generalizability of CAD performance. Automated algorithms may fail if underlying diseases modify the expected pattern content of the CT images; automated controls of system failures should be integrated to avoid, for example, CAD marks in undersegmented lung regions. Moreover, medical experts and technicians involved in diagnostic image acquisition would prefer not to have to handle unexpected failures or update requests.
To be considered valuable aid instruments in clinical practice, CAD systems should be characterized by very high sensitivity and specificity levels for all nodule types and sizes, and they should be fast and easy to use. Depending on the task they are demanded to accomplish, they should allow the possibility to browse through CAD marks according to type, size and degree of suspicion. CAD marks should be accessible from any workstation used by the radiologists and connected to the PACS.
A possible solution to making CAD algorithms easily accessible by clinicians could be the use of web-based on-demand CAD services [80]. This kind of service allows for CT data uploading through secure web protocols. Then the service provider executes the CAD algorithm and notifies the end-user either via e-mail or text message that the CAD output is ready for downloading. CAD output may be available in standard formats agreed with the end-user. In this scenario, a short algorithm execution time is not mandatory because an automated protocol for data transfer can be set up to start uploading the CT data as soon as they are acquired. The CAD output is in any case available before the radiologist starts to review the case. In addition, if the web-based on-demand CAD service paradigm is adopted, the quality of the CAD output can be optimized. In fact, the CAD service provider can, in principle, own more than one CAD system, thus different algorithms can be simultaneously executed, and CAD findings can be compared and combined to enhance their nodule detection ability. Hospitals and diagnostic centers do not have to acquire powerful workstations to carry out huge CAD computations or own CAD software licenses; they just pay for the CAD service if they use it, whereas the maintenance and the upgrade of CAD systems and the computing power is fully managed by the CAD service provider.
Contrasting trends in recent CAD research
Although the research on CAD for lung nodule detection has reached maturity after approximately two decades of very active work by many research groups, a standardization of many procedures in CAD analysis, decisional system training, performance evaluation and comparison is still missing. Several original algorithms and procedures, both for the automated search of lung nodules and for the evaluation of CAD system performance as a second reader have been successfully implemented and validated. Unfortunately, many of them are not shared among researchers and are not commonly used as standard tools, thus their potential remains unexploited.
The initiative carried out by the LIDC is extremely useful for CAD research, as it makes annotated CT scans available to CAD developers for developing and comparing systems [53]. However, as shown in Table 1, CAD developers very often extract subsets of data from the LIDC according to their own criterion, making the comparisons between different systems quite hard, if not impossible. Authors indeed rarely provide the complete list either of cases included in the analysis, or of those assigned to each partition used to train and validate the decisional systems. It would be desirable that the effort sustained by the LIDC initiative to promote CAD system development is rewarded with a more farsighted use of the data by CAD developers.
Although it has been demonstrated that the combination of different CAD systems, each with its own strengths and weaknesses, can lead to improved detection performance [54,59], only a few initiatives are working on the practical implementation of this new paradigm as a possible solution to maximize the sensitivity of CAD systems [80].
Conclusion & future perspective
In recent years, a variety of approaches have been adopted in the design, development and validation of CAD systems for lung nodule identification on CT images. These systems have a great potential to detect early-stage lung cancers and may represent a valuable aid when used as second readers in the workflow of a radiology department. The standalone performance of different CAD systems is difficult to compare due to the large variety of dataset characteristics used to train and test each system.
Often CAD algorithms are trained on limited data sets, which are not representative of the complexity and variability of CT characteristics that can be found in a screening population or, even worse, in a clinical context. The performance of these systems is generally not reproducible on any other dataset. To address this problem, the training and validation of CAD systems on a large annotated database is advisable. The availability of public databases of annotated lung CT scans could also facilitate the evolution of CAD performance in nodule detection, adding to the scientific competition on efficient CAD development those research groups without any other direct access to diagnostic images.
The LIDC dataset is the largest repository of annotated lung CT scans available at present. Despite many research groups using this extremely valuable resource, CAD performance happens to be evaluated by different developers either on arbitrary choices of data subsamples, or with different validation protocols, making a comparison unfair. Further studies are thus needed to refine the procedure to determine CAD standalone performance.
The combination of different CAD algorithms in a more complex system seems beneficial. The optimal combination lies in complementarity among the detection abilities of different CAD systems.
Studies devoted to improving CAD performance and validation procedures must go on simultaneously with the evaluation of the impact of CAD on the radiologist’s performance. When used as a second reader, CAD is not required to have comparable or better performance in nodule detection with respect to human readers, it has to be complementary to the radiologist’s ability. Although many studies demonstrated that CAD could aid in daily radiologic workflow, detecting a substantial number of nodules (especially small nodules) unseen by radiologists, these efforts in CAD research have not reached the stage of routine daily use.
The performance of CAD systems still needs to be further improved for detecting nodules, especially for nodules attached to other structures and in cases where they have subtler appearance, such as GGOs. The main issue is to maintain high levels of sensitivity to all types of nodules while keeping a limited number of false-positive marks; the radiologists’ reading time to review and discard these will otherwise undesirably increase.
Automated monitoring systems to diagnose possible CAD system failures should be integrated in all CAD systems available in the reading workstation in order to assign reliability scores to the CAD marks that the radiologists are shown.
To facilitate the integration of CAD in the workf low of radiology departments, CAD should be connected to the PACS environment. To avoid CAD final users have to face with CAD system installation, upgrade, maintenance and possible unexpected failures in algorithm execution, a confortable solution could be the access to a web-based CAD service. The service provider in this case guarantees huge computational power, usually not available in medical centers, and has the possibility to execute several CAD algorithms for comparisons and combinations.
Research in the field of CAD systems and their potential role in supporting the radiologist’s daily work is currently a very active research area. The main obstacles to the widespread implementation of these systems beyond a restricted amount of research centers will hopefully be overcome in a few years. Lung CAD systems will then become useful tools to improve and accelerate the radiologist’s task of lung CT image interpretation.
Financial & competing interests disclosure
The author has no relevant affiliations or financial involvement with any organization or entity with a financial interest in or financial conflict with the subject matter or materials discussed in the manuscript. This includes employment, consultancies, honoraria, stock ownership or options, expert testimony, grants or patents received or pending, or royalties.
No writing assistance was utilized in the production of this manuscript.
References
- Doi K. Current status and future potential of computer-aided diagnosis in medical imaging. Br. J. Radiol. 78(1), S3–S19 (2005).
- Sluimer I, Schilham A, Prokop M, van Ginneken B. Computer analysis of computed tomography scans of the lung: a survey. IEEE Trans. Med. Imaging 25(4), 385–405 (2006).
- Doi K. Computer-aided diagnosis in medical imaging: historical review, current status and future potential. Comput. Med. Imaging Graph. 31(4–5), 198–211 (2007).
- Li Q. Recent progress in computer-aided diagnosis of lung nodules on thin-section CT. Comput. Med. Imaging Graph. 31(4–5), 248–257 (2007).
- Giger ML. Anniversary Paper: history and status of CAD and quantitative image analysis: the role of Medical Physics and AAPM. Med. Phys. 35(12), 5799–5820 (2008).
- Sprindzuk MV, Kovalev VA, Snezhko EV, Kharuzhyk SA. Lung cancer differential diagnosis based on the computer assisted radiology: the state of the art. Pol. J. Radiol. 75(1), 67–80 (2010).
- Goo JM. A computer-aided diagnosis for evaluating lung nodules on chest CT: the current status and perspective. Korean J. Radiol. 12(2), 145–155 (2011).
- Lee SLA, Kouzani AZ, Hu EJ. Automated detection of lung nodules in computed tomography images: a review. Mach. Vision Appl. 23(1), 151–163 (2012).
- Suzuki K. A review of computer-aided diagnosis in thoracic and colonic imaging. Quant. Imaging Med. Surg. 2(3), 163–176 (2012).
- Kramer BS, Berg CD, Aberle DR, Prorok PC. Lung cancer screening with low-dose helical CT: results from the National Lung Screening Trial (NLST). J. Med. Screen. 18(3), 109–111 (2011).
- Enquobahrie AA, Reeves AP, Yankelevitz DF, Henschke CI. Automated detection of small pulmonary nodules in whole lung CT scans. Acad. Radiol. 14(5), 579–593 (2007).
- Dehmeshki J, Ye X, Lin X, Valdivieso M, Amin H. Automated detection of lung nodules in CT images using shape-based genetic algorithm. Comput. Med. Imaging Graph. 31(6), 408–417 (2007).
- Wang P, DeNunzio A, Okunieff P, O’Dell WG. Lung metastases detection in CT images using 3D template matching. Med. Phys. 34(3), 915–922 (2007).
- Bellotti R, De Carlo F, Gargano G et al. A CAD system for nodule detection in lowdose lung CTs based on region growing and a new active contour model. Med. Phys. 34(12), 4901–4910 (2007).
- Li Q, Li F, Doi K. Computerized detection of lung nodules in thin-section CT images by use of selective enhancement filters and an automated rule-based classifier. Acad. Radiol. 15(2), 165–175 (2008).
- Retico A, Delogu P, Fantacci ME, Gori I, Preite Martinez A. Lung nodule detection in low-dose and thin-slice computed tomography. Comput. Biol. Med. 38(4), 525–534 (2008).
- Pu J, Zheng B, Leader JK, Wang X-H, Gur D. An automated CT based lung nodule detection scheme using geometric analysis of signed distance field. Med. Phys. 35(8), 3453–3461 (2008).
- Suárez-Cuenca JJ, Tahoces PG, Souto M et al. Application of the iris filter for automatic detection of pulmonary nodules on computed tomography images. Comput. Biol. Med. 39(10), 921–933 (2009).
- Retico A, Fantacci ME, Gori I et al. Pleural nodule identification in low-dose and thinslice lung computed tomography. Comput. Biol. Med. 39(12), 1137–1144 (2009).
- Ye X, Lin X, Dehmeshki J, Slabaugh G, Beddoe G. Shape-based computer-aided detection of lung nodules in thoracic CT images. IEEE Trans. Biomed. Eng. 56(7), 1810–1820 (2009).
- Murphy K, van Ginneken B, Schilham AMR, de Hoop BJ, Gietema HA, Prokop M. A large-scale evaluation of automatic pulmonary nodule detection in chest CT using local image features and k-nearestneighbour classification. Med. Image Anal. 13(5), 757–770 (2009).
- Golosio B, Masala GL, Piccioli A et al. A novel multithreshold method for nodule detection in lung CT. Med. Phys. 36(8), 3607–3618 (2009).
- Messay T, Hardie RC, Rogers SK. A new computationally efficient CAD system for pulmonary nodule detection in CT imagery. Med. Image Anal. 14(3), 390–406 (2010).
- Cerello P. The MAGIC-5 CAD for nodule detection in low dose and thin slice lung CTs. Nucl. Instrum. Methods Phys. Res. A 623(2), 832–835 (2010).
- Camarlinghi N, Fantacci ME, Gori I, Retico A. A computer-aided detection system for lung nodules in CT images. Il Nuovo Cimento C 34(1), 65–78 (2011).
- Tan M, Deklerck R, Jansen B, Bister M, Cornelis J. A novel computer-aided lung nodule detection system for CT images. Med. Phys. 38(10), 5630–5645 (2011).
- Riccardi A, Petkov TS, Ferri G, Masotti M, Campanini R. Computer-aided detection of lung nodules via 3D fast radial transform, scale space representation, and Zernike MIP classification. Med. Phys. 38(4), 1962–1971 (2011).
- Cascio D, Magro R, Fauci F, Iacomi M, Raso G. Automatic detection of lung nodules in CT datasets based on stable 3D mass-spring models. Comput. Biol. Med. 42(11), 1098–1109 (2012).
- Hansell DM, Bankier AA, MacMahon H, McLoud TC, Müller NL, Remy J. Fleischner Society: glossary of terms for thoracic imaging. Radiology 246(3), 697–722 (2008).
- Ochs RA, Goldin JG, Abtin F et al. Automated classification of lung bronchovascular anatomy in CT using AdaBoost. Med. Image Anal. 11(3), 315–324 (2007).
- Li Q, Sone S, Doi K. Selective enhancement filters for nodules, vessels, and airway walls in two- and three-dimensional CT scans. Med. Phys. 30(8), 2040–2051 (2003).
- Suzuki K, Armato SG 3rd, Li F, Sone S, Doi K. Massive training artificial neural network (MTANN). Med. Phys. 30(7), 1602–1617 (2003).
- Suzuki K. A supervised ‘lesion-enhancement’ filter by use of a massive-training artificial neural network (MTANN) in computer-aided diagnosis (CAD). Phys. Med. Biol. 54(18), S31–S45 (2009).
- Pu J, Roos J, Yi CA, Napel S, Rubin GD, Paik DS. Adaptive border marching algorithm: automatic lung segmentation on chest CT images. Comput. Med. Imaging Graph. 32(6), 452–462 (2008).
- van Rikxoort EM, de Hoop B, Viergever MA, Prokop M, van Ginneken B. Automatic lung segmentation from thoracic computed tomography scans using a hybrid approach with error detection. Med. Phys. 36(7), 2934–2947 (2009).
- De Nunzio G, Tommasi E, Agrusti A et al. Automatic lung segmentation in CT images with accurate handling of the hilar region. J. Digit. Imaging 24(1), 11–27 (2011).
- Pu J, Paik DS, Meng X, Roos JE, Rubin GD. Shape ‘break-and-repair’ strategy and its application to automated medical image segmentation. IEEE Trans. Vis. Comput. Graph. 17(1), 115–124 (2011).
- Masala GL, Golosio B, Oliva P. An improved Marching Cube algorithm for 3D data segmentation. Comput. Phys. Commun. 184(3), 777–782 (2013).
- Armato SG 3rd, Giger ML, MacMahon H. Automated detection of lung nodules in CT scans: reliminary results. Med. Phys. 28(8), 1552–1561 (2001).
- Lee Y, Hara T, Fujita H, Itoh S, Ishigaki T. Automated detection of pulmonary nodules in helical CT images based on an improved template-matching technique. IEEE Trans. Med. Imaging 20(7), 595–604 (2001).
- Choi W-J, Choi T-S. Genetic programmingbased feature transform and classification for the automatic detection of pulmonary nodules on computed tomography images. Inform. Sci. 212, 57–78 (2012).
- Paik DS, Beaulieu CF, Rubin GD et al. Surface normal overlap: a computer-aided detection algorithm with application to colonic polyps and lung nodules in helical CT. IEEE Trans. Med. Imaging 23(6), 661–675 (2004).
- Ozekes S, Osman O, Ucan ON. Nodule detection in a lung region that’s segmented with using genetic cellular neural networks and 3D template matching with fuzzy rule based thresholding. Korean J. Radiol. 9(1), 1–9 (2008).
- Osman O, Ozekes S, Ucan ON. Lung nodule diagnosis using 3D template matching. Comput. Biol. Med. 37(8), 1167–1172 (2007).
- Kubota T, Jerebko AK, Dewan M, Salganicoff M, Krishnan A. Segmentation of pulmonary nodules of various densities with morphological approaches and convexity models. Med. Image Anal. 15(1), 133–154 (2011).
- Dehmeshki J, Amin H, Valdivieso M, Ye X. Segmentation of pulmonary nodules in thoracic CT scans: a region growing approach. IEEE Trans. Med. Imaging 27(4), 467–480 (2008).
- Diciotti S, Picozzi G, Falchini M, Mascalchi M, Villari N, Valli G. 3-D segmentation algorithm of small lung nodules in spiral CT images. IEEE Trans. Inf. Technol. Biomed. 12(1), 7–19 (2008).
- Suzuki K. Pixel-based machine learning in medical imaging. Int. J. Biomed. Imaging 2012, 792079 (2012).
- Bishop CM. Neural Networks for Pattern Recognition. Academic Press, San Diego, CA, USA (1990).
- Fukunaga K. Introduction to Statistical Pattern Recognition. Academic Press, San Diego, CA, USA (1990).
- Vapnik V. The Nature of Statistical Learning Theory. Springer-Verlag, Berlin, Germany (1995).
- Sahiner B, Chan HP, Hadjiiski L. Classifier performance prediction for computer-aided diagnosis using a limited dataset. Med. Phys. 35(4), 1559–1570 (2008).
- Armato SG, McLennan G, McNitt-Gray MF et al. Lung image database consortium: developing a resource for the medical imaging research community. Radiology 232(3), 739–748 (2004).
- van Ginneken B, Armato SG, de Hoop B et al. Comparing and combining algorithms for computer-aided detection of pulmonary nodules in computed tomography scans: the ANODE09 study. Med. Image Anal. 14(6), 707–722 (2010).
- Sahiner B, Chan HP, Hadjiiski LM et al. Effect of CAD on radiologists’ detection of lung nodules on thoracic CT scans: analysis of an observer performance study by nodule size. Acad. Radiol. 16(12), 1518–1530 (2009).
- Ge Z, Sahiner B, Chan HP et al. Computeraided detection of lung nodules: false positive reduction using a 3D gradient field method and 3D ellipsoid fitting. Med. Phys. 32(8), 2443–2454 (2005).
- Lopes Pegna A, Picozzi G, Mascalchi M et al. Design, recruitment and baseline results of the ITALUNG trial for lung cancer screening with low-dose CT. Lung Cancer 64(1), 34–40 (2009).
- Niemeijer M, Loog M, Abramoff MD, Viergever MA, Prokop M, van Ginneken B. On combining computer-aided detection systems. IEEE Trans. Med. Imaging 30(2), 215–223 (2011).
- Camarlinghi N, Gori I, Retico A et al. Combination of computer-aided detection algorithms for automatic lung nodule identification. Int. J. Comput. Assist. Radiol. Surg. 7(3), 455–464 (2012).
- Kittler J. On combining classifiers. IEEE Trans. Pattern Anal. Mach. Intell. 20(3), 226–239 (1998).
- Cerello P, Cheran SC, Bagnasco S et al. 3-D object segmentation using ant colonies. Pattern Recogn. 43(4), 1476–1490 (2010).
- Chakraborty DP, Berbaum KS. Observer studies involving detection and localization: modeling, analysis and validation. Med. Phys. 31(8), 2313–2330 (2004).
- Chakraborty DP. Analysis of location specific observer performance data: validated extensions of the Jackknife Free-Response (JAFROC) method. Acad. Radiol. 13(10), 1187–1193 (2006).
- Li F, Sone S, Abe H, MacMahon H, Armato SG, Doi K. Lung cancers missed at low-dose helical CT screening in a general population: comparison of clinical, histopathologic, and imaging findings. Radiology 225(3), 673–683 (2002).
- Armato SG, Li F, Giger ML, MacMahon H, Sone S, Doi K. Lung cancer: performance of automated lung nodule detection applied to cancers missed in a CT screening program. Radiology 225(3), 685–692 (2002).
- Li F, Arimura H, Suzuki K et al. Computeraided detection of peripheral lung cancers missed at CT: ROC analyses without and with localization. Radiology 237(2), 684–690 (2005).
- Beyer F, Zierott L, Fallenberg EM et al. Comparison of sensitivity and reading time for the use of computer-aided detection (CAD) of pulmonary nodules at MDCT as concurrent or second reader. Eur. Radiol. 17(11), 2941–2947 (2007).
- Hirose T, Nitta N, Shiraishi J, Nagatani Y, Takahashi M, Murata K. Evaluation of computer-aided diagnosis (CAD) software for the detection of lung nodules on multidetector row computed tomography (MDCT): JAFROC study for the improvement in radiologists’ diagnostic accuracy. Acad. Radiol. 15(12), 1505–1512 (2008).
- Das M, Mühlenbruch G, Heinen S et al. Performance evaluation of a computer-aided detection algorithm for solid pulmonary nodules in low-dose and standard-dose MDCT chest examinations and its influence on radiologists. Br. J. Radiol. 81(971), 841–847 (2008).
- White CS, Pugatch R, Koonce T, Rust SW, Dharaiya E. Lung nodule CAD software as a second reader 1: a multicenter study. Acad. Radiol. 15(3), 326–333 (2008).
- Beigelman-Aubry C, Raffy P, Yang W, Castellino RA, Grenier PA. Computer-aided detection of solid lung nodules on follow-up MDCT screening: evaluation of detection, tracking, and reading time. AJR Am. J. Roentgenol. 189(4), 948–955 (2007).
- Fraioli F, Bertoletti L, Napoli A et al. Computer-aided detection (CAD) in lung cancer screening at chest MDCT: ROC analysis of CAD versus radiologist performance. J. Thorac. Imaging 22(3), 241–246 (2007).
- Bogoni L, Ko JP, Alpert J et al. Impact of a computer-aided detection (CAD) system integrated into a picture archiving and communication system (PACS) on reader sensitivity and efficiency for the detection of lung nodules in thoracic CT exams. J. Digit. Imaging 25(6), 771–781 (2012).
- Henschke CI, Yankelevitz DF, Mirtcheva R et al. CT screening for lung cancer: frequency and significance of part-solid and nonsolid nodules. AJR Am. J. Roentgenol. 178(5), 1053–1057 (2002).
- Kim KG, Goo JM, Kim JH et al. Computeraided diagnosis of localized ground-glass opacity in the lung at CT: initial experience. Radiology 237(2), 657–661 (2005).
- Ye X, Lin X, Beddoe G, Dehmeshki J. Efficient computer-aided detection of groundglass opacity nodules in thoracic CT images. Conf. Proc. IEEE Eng. Med. Biol. Soc. 2007, 4449–4452 (2007).
- Jacobs C, Sánchez CI, Saur SC, Twellmann T, de Jong PA, van Ginneken B. Computeraided detection of ground glass nodules in thoracic CT images using shape, intensity and context features. Med. Image Comput. Comput. Assist. Interv. 14(Pt 3), 207–214 (2011).
- Goo JM. Computer-aided detection of lung nodules on chest CT: issues to be solved before clinical use. Korean J. Radiol. 6(2), 62–63 (2005).
- van Ginneken B, Schaefer-Prokop CM, Prokop M. Computer-aided diagnosis: how to move from the laboratory to the clinic. Radiology 261(3), 719–732 (2011). n Most problems currently preventing broad use of CAD systems in the radiologist’s daily work are presented, spanning a large variety of CAD applications.
- Berzano D, Bagnasco S, Brunetti B et al. On-demand lung CT analysis with the M5L-CAD via the WIDEN Front-End Web Interface and an OpenNebula-Based Cloud Back-End. IEEE Nucl. Sci. Symp. Conf. Rec. N14–73 (2012).
- National Cancer Institute. Lung cancer trial results show mortality benefit with low-dose CT. www.cancer.gov/newscenter/ newsfromnci/2010/NLSTresultsRelease
- ELCAP Public Lung Image Database. www.via.cornell.edu/lungdb.html
- Cancer Imaging Program. Lung Image Database Consortium (LIDC). http://imaging.cancer.gov/ programsandresources/InformationSystems/ LIDC
- Automatic nodule detection 2009. http://anode09.isi.uu.nl
- NELSON. www.nelsonproject.nl
- OsiriX Imaging Software. Advanced opensource PACS workstation DICOM viewer. www.osirix-viewer.com
■Websites


