Short Communication - Imaging in Medicine (2018) Volume 10, Issue 3
Clinical approach of perfusion-weighted imaging
Nguyen Minh Duc1,2†*, Huynh Quang Huy1, Mai Tan Lien Bang2, Luc Minh Truong3, Pham Ngoc Hoa1, Pham Minh Thong4†1Department of Radiology, Pham Ngoc Thach University of Medicine, Ho Chi Minh city, Vietnam
2Department of Radiology, Childrens hospital 2, Ho Chi Minh city, Vietnam
3Department of Radiology, Siemens Healthcare Vietnam, Ho Chi Minh city, Vietnam
4Department of Radiology, Hanoi medical university, Ha Noi, Vietnam
†Both authors contributed equally.
- *Corresponding Author:
- Nguyen Minh Duc
Department of Radiology
Pham Ngoc Thach University of Medicine
Ho Chi Minh city, Vietnam
E-mail: bsnguyenminhduc@pnt.edu.vn
Abstract
Perfusion is one of the most important parameters affected on the diagnosis, treatment planning, and disease response to therapy. There are some discriminative kinds of Perfusion-Weighted Imaging (PWI) such as dynamic susceptibility contrast PWI, semiquantitative dynamic contrast-enhanced PWI, quantitative dynamic contrast-enhanced PWI, dynamic glucose-enhanced PWI, arterial spin labelling and amide proton transfer. In this short communication, we aimed to introduce clinical approach of these PWI types.
Keywords
perfusion-weighted imaging ▪ magnetic resonance imaging ▪ clinical approach
Introduction
Perfusion, one of the most crucial physiologic and pathophysiologic features of tissue, can be investigated non-invasively and non-ionzingly by magnetic resonance imaging (MRI) [1-5]. Currently, we have some different perfusionweighted imaging (PWI) sequences to achieve perfusion-related parameters using external tracer such as gadolinium-based contrast agent (GBCE) or substances and internal tracer such as blood or water molecule. In practice, we have two groups of PWI: group A with contrast enhancement: (1) dynamic susceptibility contrast (DSC) PWI; (2) semiquantitative dynamic contrast-enhanced (DCE) PWI; (3) quantitative dynamic contrast-enhanced (DCE) PWI; and (4) dynamic glucose-enhanced (DGE) PWI and group B without contrast enhancement: (1) arterial spin labelling (ASL) and (2) amide proton transfer (APT)[1-5]. In this short communication, we aimed to introduce clinical approach of these PWI applications.
Group A
■ DSC PWI
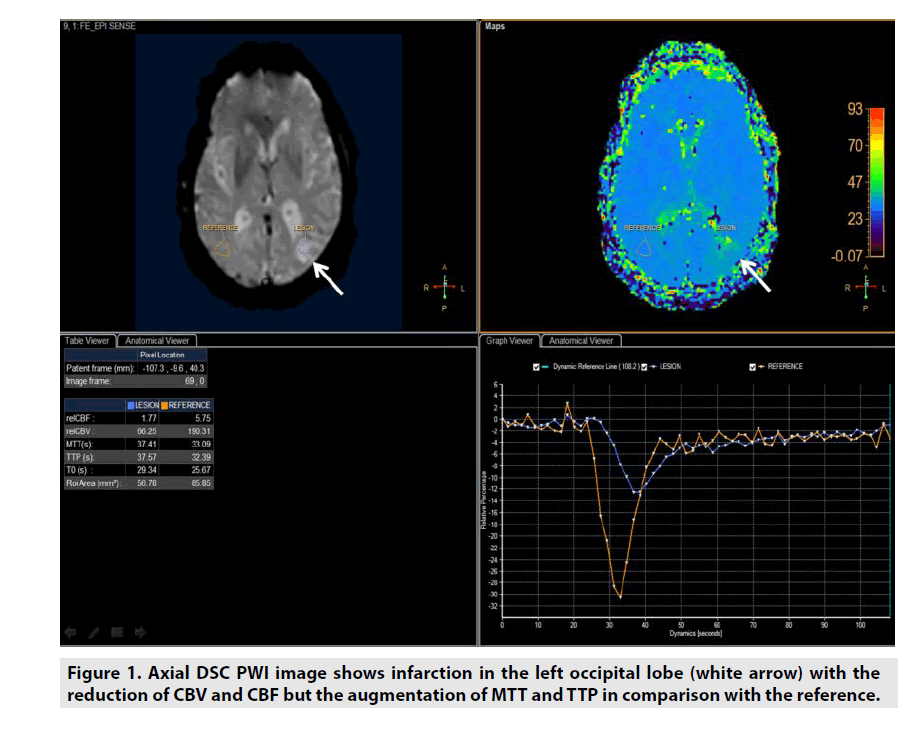
DSC PWI might be utilized in estimating not only the microvessel area (MVA) but also 4 important parameters of lesion included cerebral blood volume (CBV), cerebral blood flow (CBF), mean time transit (MTT) and time to peak (TTP) derived from multidynamic T2*- weighted gradient recalled echo sequence as seen in figure 1 [1-6].
• CBV was defined as milliliters of blood per 100 g of brain tissue (mL/100g/ min).
• CBF was defined as milliliters of blood per minute per 100 g of brain tissue (mL/100g/min).
• MTT was equal to CBV/CBF (sec).
• TTP was the duration from the 0 second to the peak of enhancement (sec).
DSC PWI was predominantly applied in assessment of stroke or even brain tumor [1-6].
■Semi-quantitative DCE PWI
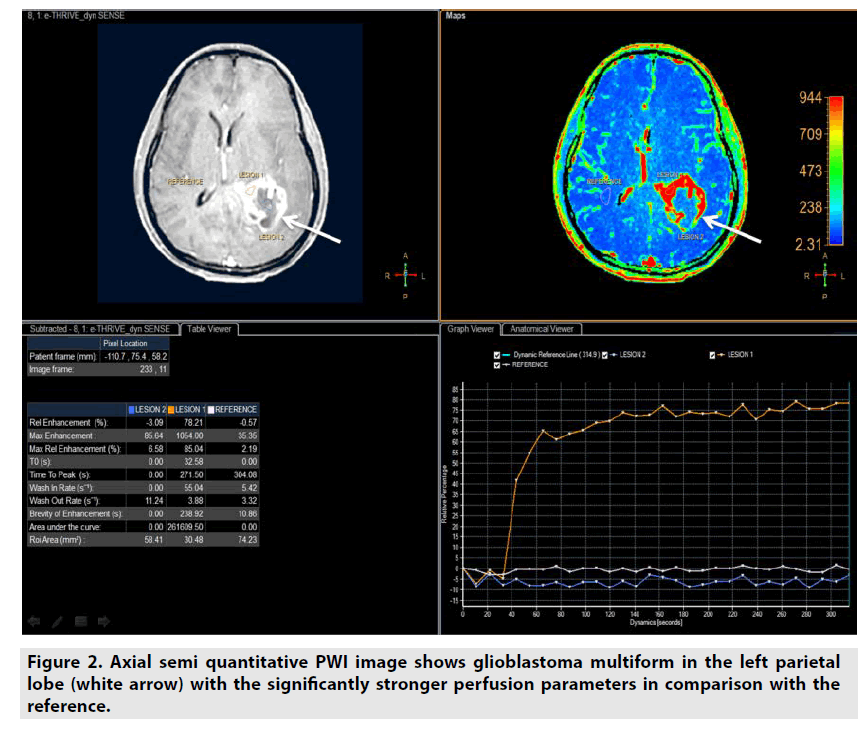
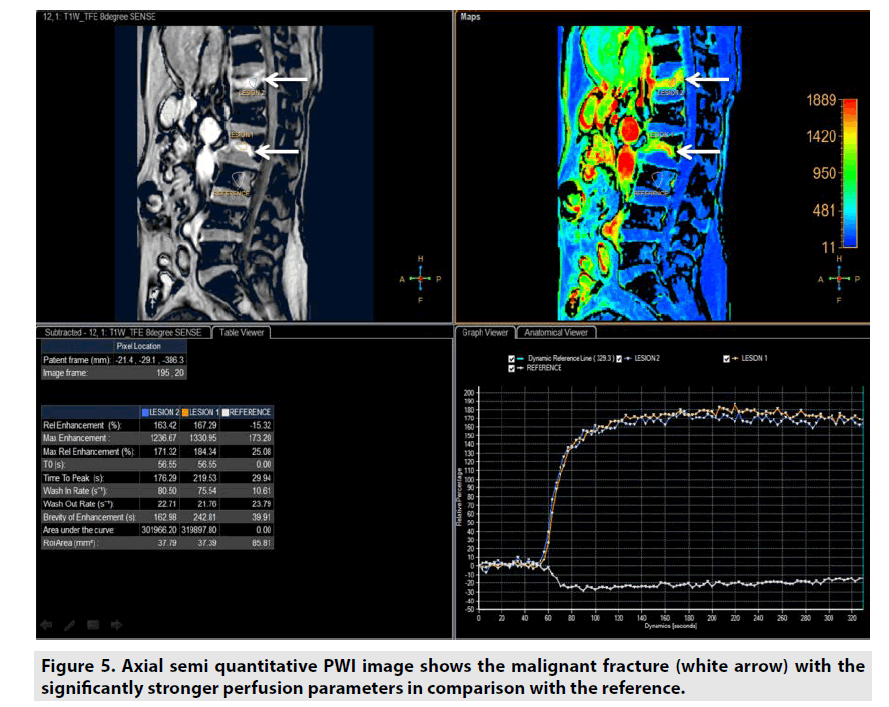
Semiquantitative DCE PWI was simpler than quantitative DCE PWI by utilizing single multidynamic T1-weighted sequence with GBCE. Semi-quantitative DCE PWI was exploited to achieve parameters relative enhancement, maximal enhancement, maximal relative enhancement, T0, time to peak, wash-in rate, wash-out rate, brevity of enhancement and area under the curve as seen in Figure 2 [7-9].
Figure 2. Axial semi quantitative PWI image shows glioblastoma multiform in the left parietal lobe (white arrow) with the significantly stronger perfusion parameters in comparison with the reference.
• Relative enhancement was defined as difference signal intensity of a pixel over all dynamics relative to same pixel in reference dynamic (%).
• Maximum enhancement was defined as difference maximum signal intensity of a pixel over all dynamics and signal intensity of same pixel in reference dynamic.
• Relative maximum enhancement was defined as maximum signal intensity of a pixel over all dynamics relative to same pixel in reference dynamic, 0% indicates the same signal intensity as that in the reference dynamic (%).
• T0 was defined as the baseline duration of curve (sec).
• Time to peak was the duration from the 0 second to peak of enhancement (sec).
• Wash-in rate was defined as maximum slope between the time at which the signal intensity increases at least 20% compared with the reference dynamic and the time of peak enhancement (sec-1).
• Wash-out rate was defined as maximum of absolute value of slope between time of peak and the end of dynamic (sec-1).
• Brevity of enhancement was defined as the stability of the time signal intensity curve.
• Area under the curve was defined as the area under tissue concentration time curve ultil a stipulated time point that includes a major portion of the tissue’s response.
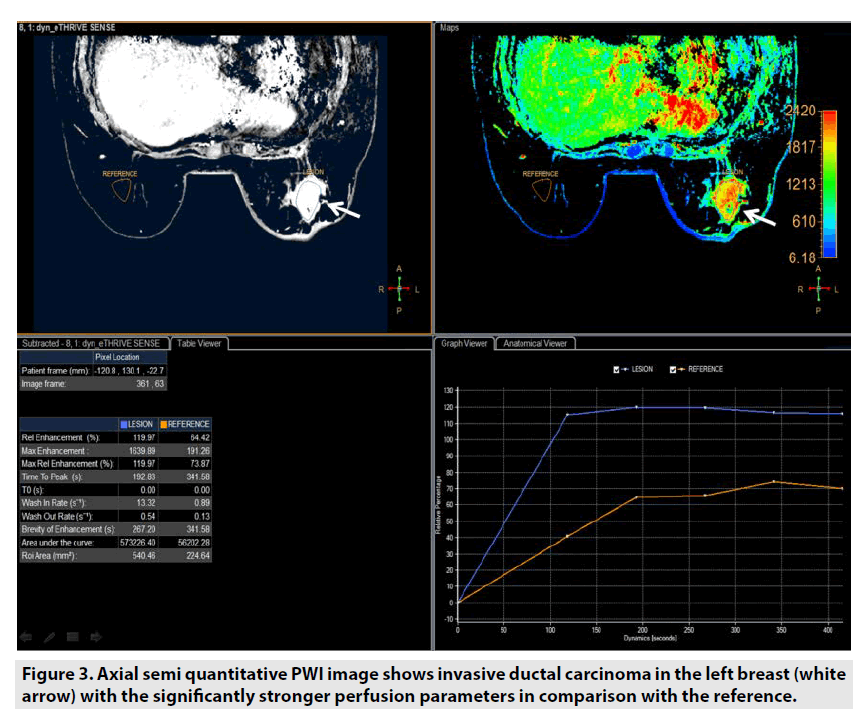
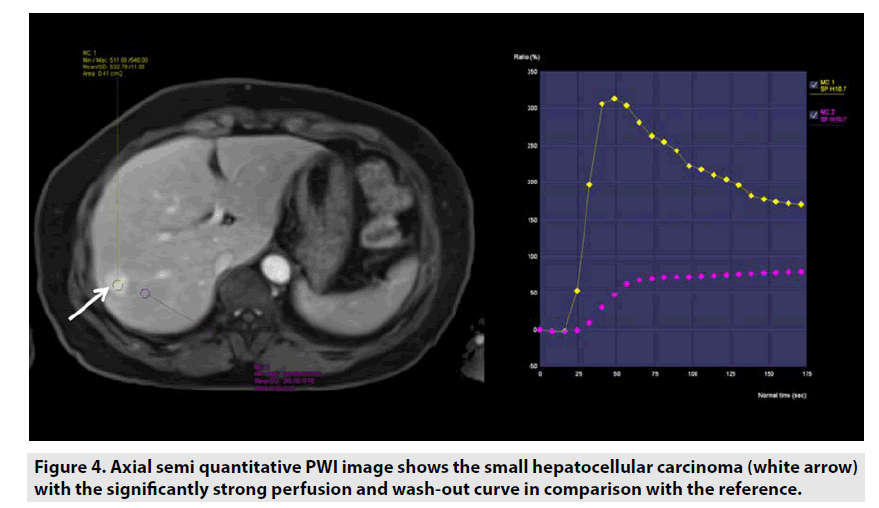
Semi-quantitative DCE PWI was predominantly applied in perfusion assessment of breast tumor (FIGURE 3), liver tumor (FIGURE 4), bone tumor (FIGURE 5), prostate tumor and brain tumor [1-9].
Figure 3. Axial semi quantitative PWI image shows invasive ductal carcinoma in the left breast (white arrow) with the significantly stronger perfusion parameters in comparison with the reference.
Figure 4. Axial semi quantitative PWI image shows the small hepatocellular carcinoma (white arrow) with the significantly strong perfusion and wash-out curve in comparison with the reference.
■Quantitative DCE PWI
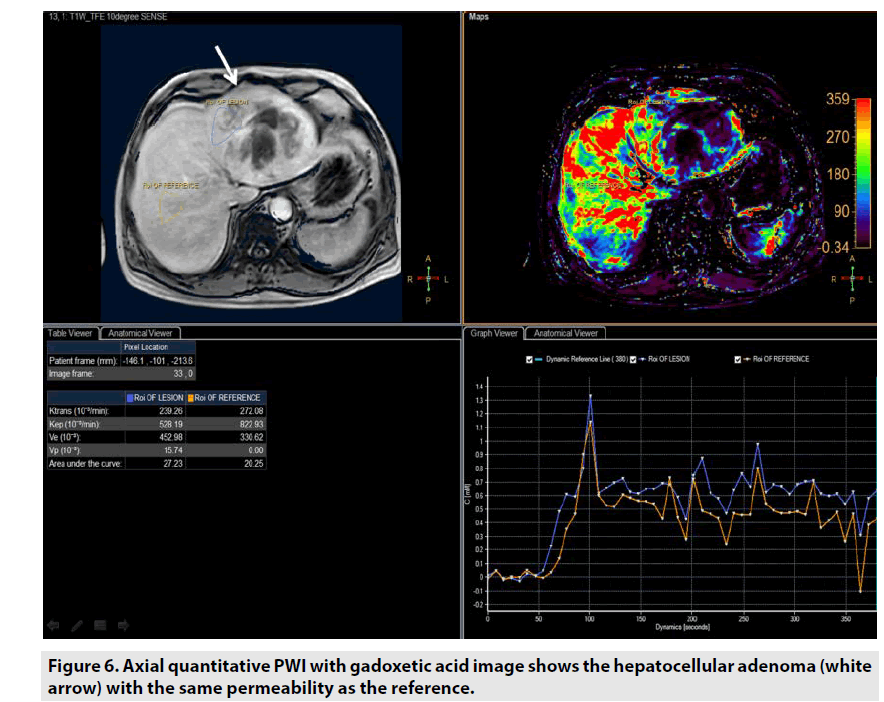
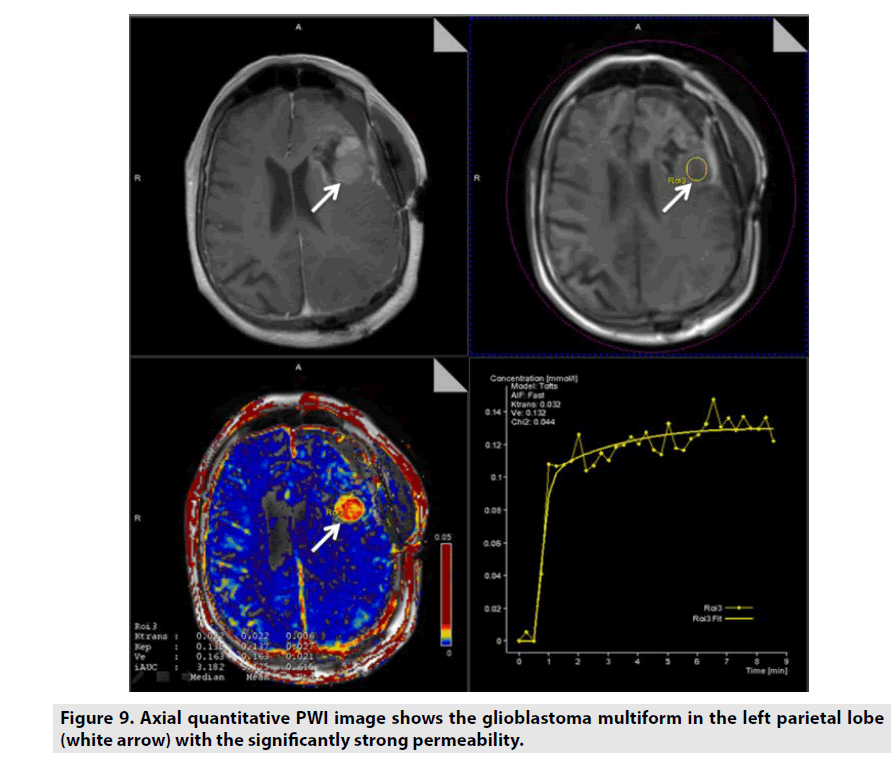
Quantitative DCE PWI involves the calculation of perfusion parameters from a timesignal intensity curve on the basis of T1 mapping of pre- and post-contrast images. Quantitative DCE PWI was launched to obtain 4 parameters: Ktrans, Kep, Ve, and Vp as seen in Figure 6.
• Ktrans was defined as volume transfer constant (10-3/min).
• Kep was defined as reverse reflux rate constant (10-3/min).
• Ve was defined as volume fraction of extravascular extracellular space (10-3).
• Vp was defined as volume fraction of plasma (10-3).
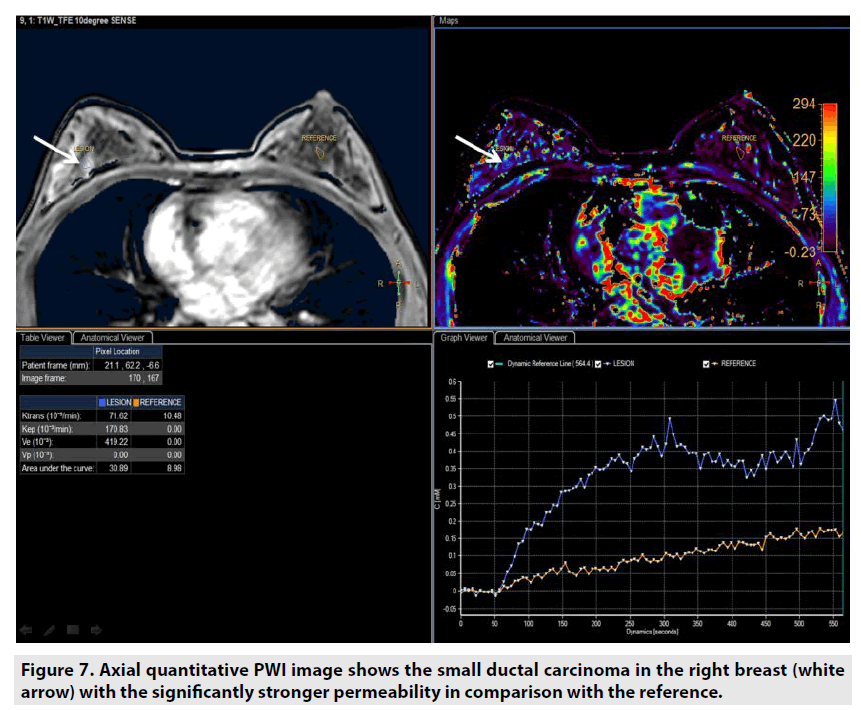
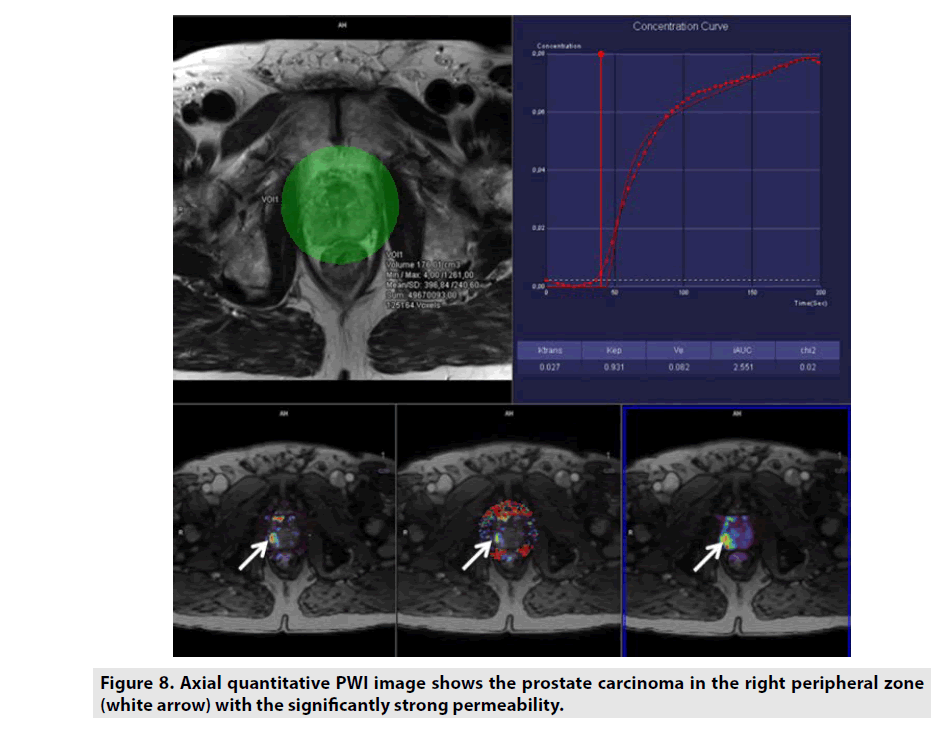
Quantitative DCE PWI was principally used in assessment of tumor’s permeability such as breast tumor (FIGURE 7), prostate tumor (FIGURE 8) and brain tumor (FIGURE 9) [1-5].
Figure 7. Axial quantitative PWI image shows the small ductal carcinoma in the right breast (white arrow) with the significantly stronger permeability in comparison with the reference.
Figure 8. Axial quantitative PWI image shows the prostate carcinoma in the right peripheral zone (white arrow) with the significantly strong permeability.
Figure 9. Axial quantitative PWI image shows the glioblastoma multiform in the left parietal lobe (white arrow) with the significantly strong permeability.
■DGE PWI
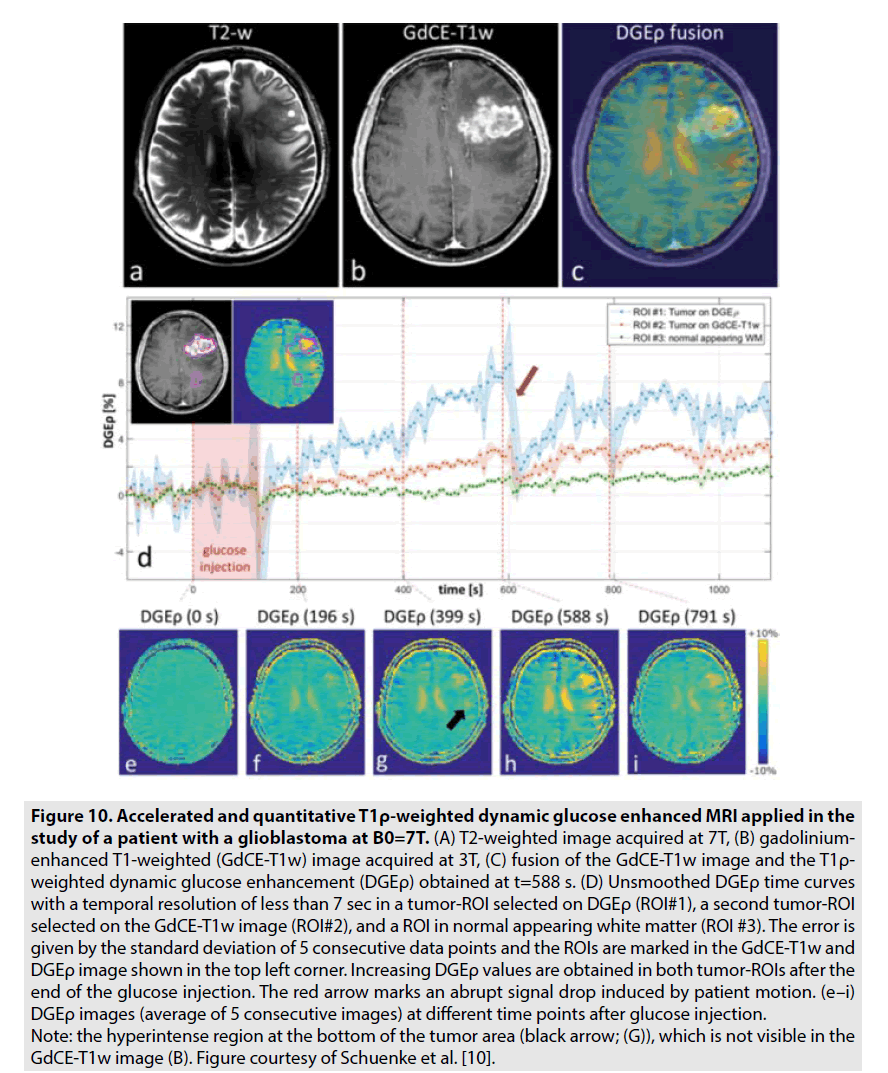
DGE PWI was utilized to investigate the brain tumor’s consumption of unlabelled deoxyglucose (D-glucose). Recently, there are some studies on 7-Tesla MRI revealed the potential of this technique in assessment of brain tumor especially glioblastoma multiform as seen in FIGURE 10 [10,11]. In contrast to GBCE, which is limited in the vascular and extracellular extravascular spaces, D-glucose is further transported into the intracellular space. Hence, DGE PWI produces more information on not solely tumor perfusion but also intracellular glucose consumption [10,11].
Figure 10. Accelerated and quantitative T1ρ-weighted dynamic glucose enhanced MRI applied in the study of a patient with a glioblastoma at B0=7T. (A) T2-weighted image acquired at 7T, (B) gadoliniumenhanced T1-weighted (GdCE-T1w) image acquired at 3T, (C) fusion of the GdCE-T1w image and the T1ρ- weighted dynamic glucose enhancement (DGEρ) obtained at t=588 s. (D) Unsmoothed DGEρ time curves with a temporal resolution of less than 7 sec in a tumor-ROI selected on DGEρ (ROI#1), a second tumor-ROI selected on the GdCE-T1w image (ROI#2), and a ROI in normal appearing white matter (ROI #3). The error is given by the standard deviation of 5 consecutive data points and the ROIs are marked in the GdCE-T1w and DGEρ image shown in the top left corner. Increasing DGEρ values are obtained in both tumor-ROIs after the end of the glucose injection. The red arrow marks an abrupt signal drop induced by patient motion. (e–i) DGEρ images (average of 5 consecutive images) at different time points after glucose injection. Note: the hyperintense region at the bottom of the tumor area (black arrow; (G)), which is not visible in the GdCE-T1w image (B). Figure courtesy of Schuenke et al. [10].
Group B
■ ASL
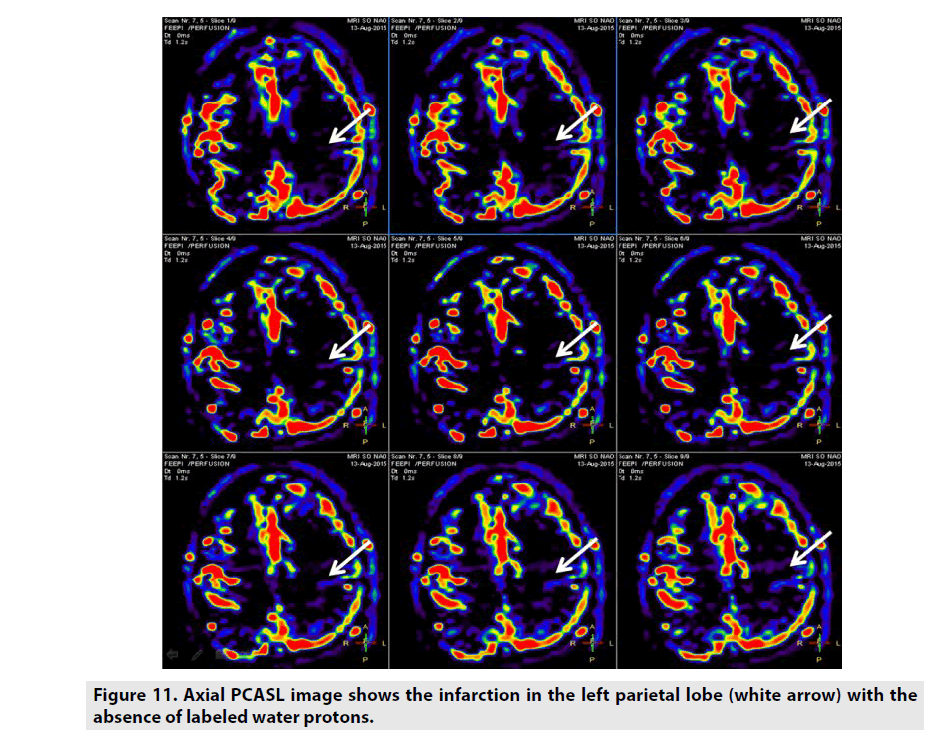
ASL is a perfusion method which does not necessitate GBCE as seen in FIGURE 11. ASL utilizes the label arterial blood water proton capability as internal contrast-enhanced tracer. CBF was the important parameter arisen from this sequence [12,13]. There are some different kinds of ASL rested on the magnetic labelling procedure:
• Pulsed ASL (PASL) utilizes short (5–20 ms) radio-frequency (RF) pulses to invert a thick slab of spins in the tagging plane proximal to the imaging region [14].
• Continuous ASL (CASL) uses long and continuous RF pulses (1-2 sec) along with a constant gradient field to induce a flow-driven adiabatic inversion in a narrow plane of spins, usually just below the imaging plane [15,16].
• Pseudocontinuous ASL (PCASL) uses a train of discrete RF pulses in conjunction with a synchronous gradient field to mimic a flow-driven adiabatic inversion seen in CASL without the special hardware [17].
• Velocity-Selective ASL (VSASL) saturates the blood that is moving at a faster velocity than the specified cut-off value to achieve perfusion contrast [18].
The main idea in ASL is to obtain a labelled image and a control image, in which the static tissue signals are identical but the magnetisation of the inflowing blood is dissimilar. The water molecules in the arterial blood are magnetically labelled by using a RF pulse that saturates water protons. Subtraction between labelled and control images eliminate the static signals and the remaining signals are linear measures to the perfusion, which is corresponding to the Cerebral Blood Flow (CBF).
ASL can be indicated in assessment of cerebrovascular stroke, vascular malformation, encephalitis, migraineassociated, hyperperfusion, hypoperfusion, dementia, migraine, infectious etiologies, physiologic quantification, posterior reversible encephalopathy syndrome, cognitive disorders, pediatric patients, immunocompromised patients, patients with GBCE allergy and impaired renal function patients [12,13].
■APT
APT is a new MRI technique not used GBCE which detects endogenous mobile proteins and peptides in biotissues. The low-concentration proteins are labelled by saturating their interchangeable protons such as hydroxyl, amine, and amide through selective RF irradiation at their specific resonance frequency, and then the labelled protons are transferred to the bulk water via chemical exchange at an exchange rate. The solute protons are always at a very low concentration and hard to identify directly using standard MR protocols. Nonetheless, after a certain time of continuous transfer, this effect alleviates the MRI signal and the protons are discovered indirectly through the attenuation of the water signal [19,20].
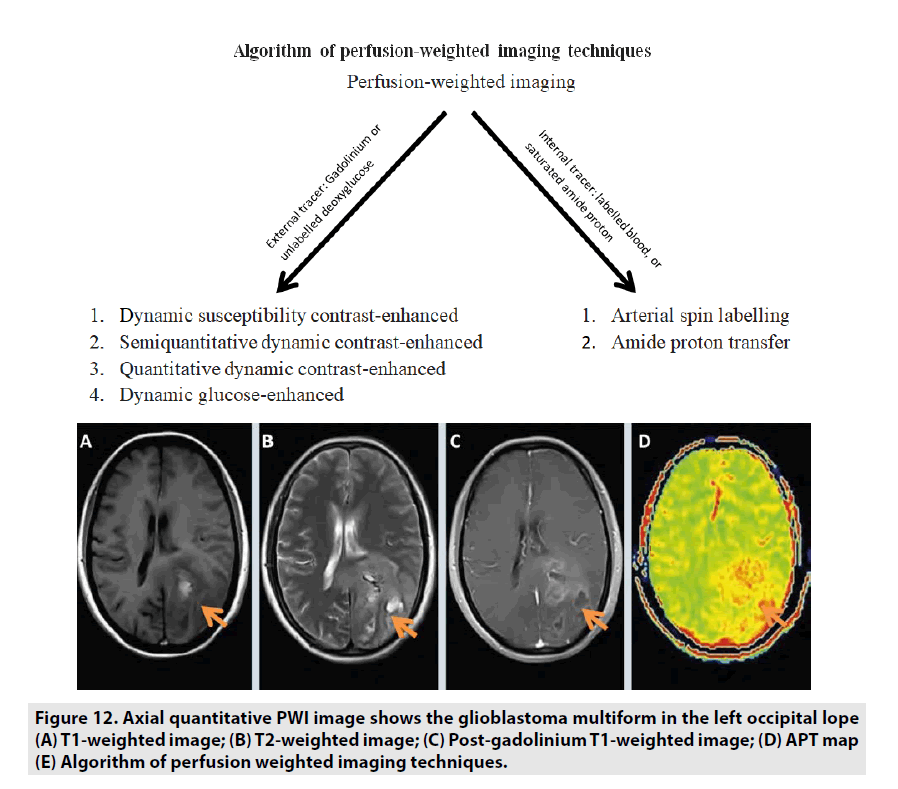
Previous studies manifested that APT MRI is sensitive to changes in cellular pH and protein concentration related to cell proliferation. Therefore, the APT signal strength indirectly reflects the malignant tumor grade. Tumor grade and APT signal have been noticed to be generally positively correlated: high-grade tumors are tendency to manifest a high APT contrast as seen in FIGURE 12. Some studies differentiating tumor grades with APT signal in glioma suggest that APT can support tumor grading and separating high-grade from lowgrade [21-23].
Figure 12. Axial quantitative PWI image shows the glioblastoma multiform in the left occipital lope (A) T1-weighted image; (B) T2-weighted image; (C) Post-gadolinium T1-weighted image; (D) APT map (E) Algorithm of perfusion weighted imaging techniques.
Advantage and disadvantage
The greatest advantage of PWI is the value of quantitative parameters derived from the sequences reflected the perfusion, permeability and vascularity of tissues compared to conventional contrast-enhanced T1W. In addition, PWI is also the most robust technique in recommending the malignant or benign risk of tumor, monitoring the response of tumor to chemotherapy, radiation, and assessing the recurrent of disease. Nonetheless, PWI is needed to exploit the appropriate dynamic sequences and corresponding computer-aided program to investigate in comparison with simple contrast-enhanced T1W. Currently, novel and innovative PWI sequences and analysis software were achieved in order that the clinicians can economize time and cost. In terms of research on the physiological and biological characteristics of tissue, PWI is more predominant and academic than simple contrast-enhanced T1W [1-5].
Conclusion
PWI is one of the most robust and accuracy method in accessing the tissue perfusion and permeability. All parameters derived from PWI should be considered carefully by clinicians in order to obtain the confident diagnosis and appropriate treatment for patients.
Disclosure statement
Luc Minh Truong is an employee of Siemens. However, the scientific guarantor of this publication is Dr. Nguyen Minh Duc and Dr Huynh Quang Huy, Department of Radiology, Pham Ngoc Thach University of Medicine. Nguyen Minh Duc and Huynh Quang Huy contributed equally to this article. All authors read and approved the manuscript. The authors of this manuscript report no conflict of interest.
References
- Essig M, Shiroishi MS, Nguyen TB et al. Perfusion MRI: The Five Most Frequently Asked Technical Questions. AJR. Am. J. Roentgenol. 200, 24–34 (2013).
- Kim M, Kim HS. Emerging Techniques in Brain Tumor Imaging: What Radiologists Need to Know. Korean. J. Radiol. 17, 598-619 (2016).
- Essig M, Nguyen TB, Shiroishi MS et al. Perfusion MRI: The Five Most Frequently Asked Clinical Questions. AJR. Am. J. Roentgenol.201, 495-510 (2013)
- Cuenod CA,Balvay D. Perfusion and vascular permeability: Basic concepts and measurement in DCE-CT and DCE-MRI. Diagn. Interv. Imaging. 94, 1187-1204 (2013).
- Jahng GH,Li KL,Ostergaard Let al. Perfusion Magnetic Resonance Imaging: A Comprehensive Update on Principles and Techniques. Korean. J. Radiol. 15, 554-577 (2014).
- Petrella JR,Provenzale JM. MR Perfusion Imaging of the Brain: Techniques and Applications. AJR. Am. J. Roentgenol. 175, 207-219 (2000).
- Kim YS,Kim BG,Rhim H et al. Uterine fibroids: semiquantitative perfusion MR imaging parameters associated with the intraprocedural and immediate postprocedural treatment efficiencies of MR imaging-guided high-intensity focused ultrasound ablation. Radiology. 273, 462-471 (2014).
- Kim YS,Lee JW,Choi CH et al. Uterine Fibroids: Correlation of T2 Signal Intensity with Semiquantitative Perfusion MR Parameters in Patients Screened for MR-guided High-Intensity Focused Ultrasound Ablation. Radiology. 278, 925-935 (2016).
- Keserci B,Duc NM. Magnetic Resonance Imaging Parameters in Predicting the Treatment Outcome of High-intensity Focused Ultrasound Ablation of Uterine Fibroids With an Immediate Nonperfused Volume Ratio of at Least 90. Acad. Radiol.25, 1-8 (2018).
- Schuenke P,Paech D,Koehler C et al. Fast and Quantitative T1ρ-weighted Dynamic Glucose Enhanced MRI. Sci. Rep.7, 1-10 (2017).
- Paech D,Schuenke P,Koehler C et al. T1ρ-weighted Dynamic Glucose-enhanced MR Imaging in the Human Brain. Radiology. 285, 914-922 (2017).
- Pollock JM,Tan H,Kraft RAet al. Arterial spin-labeled MR perfusion imaging: clinical applications. Magn. Reson. Imaging. Clin. N. Am.17, 315-338 (2009).
- Van Osch MJ,Teeuwisse WM,Chen Z et al. Advances in arterial spin labelling MRI methods for measuring perfusion and collateral flow. J. Cereb. Blood. Flow. Metab. 37, 1–20 (2017).
- Edelman RR, Siewert B, Darby DG et al. Qualitative mapping of cerebral blood flow and functional localization with echo-planar MR imaging and signal targeting with alternating radio frequency. Radiology. 192, 513-520 (1994).
- Detre JA, Leigh JS, Williams DS et al. Perfusion imaging. Magn. Reson. Med. 23, 37-45 (1992).
- Detre JA, Alsop DC. Perfusion magnetic resonance imaging with continuous arterial spin labeling: methods and clinical applications in the central nervous system. Eur. J. Radiol. 30, 115-124 (1999).
- Garcia DM, Bazelaire CD, Alsop D. Pseudo-continuous Flow Driven Adiabatic Inversion for Aterial Spin Labeling. Intl. Soc. Mag. Reson. Med. 10, 5 (2005).
- Wong EC, Cronin M, Wu WC et al. Velocity-selective arterial spin labeling. Magn. Reson. Med. 55, 1334-1341 (2006).
- Park JE, Jahng GH, Jeong HK. Amide Proton Transfer Imaging in Clinics: Basic Concepts and Current and Future Use in Brain Tumors and Stroke. J. Korean. Soc. Radiol. 75, 419-433 (2016).
- Wang S, Jarso S, Van Zijl PCM et al. Role of Amide Proton Transfer (APT)-MRI of Endogenous Proteins and Peptides in Brain Tumor Imaging. Functional. Brain. Tumor. Imaging. 28, 171-181 (2014).
- Togao O, Yoshiura T, Keupp J et al. Amide proton transfer imaging of adult diffuse gliomas: correlation with histopathological grades. Neuro. Oncol. 16, 441-448 (2014).
- Park KJ, Kim HS, Park JE et al. Added value of amide proton transfer imaging to conventional and perfusion MR imaging for evaluating the treatment response of newly diagnosed glioblastoma. Eur. Radiol. 26, 4390-4403 (2016).
- Park JE, Kim HS, Park KJ et al. Pre-and Posttreatment Glioma: Comparison of Amide Proton Transfer Imaging with MR Spectroscopy for Biomarkers of Tumor Proliferation. Radiology. 278, 514 (2016).
