Research Article - Imaging in Medicine (2018) Volume 10, Issue 6
The Role Of Non-Invasive Methods In Evaluating Liver Fibrosis Of Patients With Non-Alcoholic Steatohepatitis
Tran Thi Khanh Tuong†1 & Nguyen Minh Duc*†21Department of Internal Medicine, Pham Ngoc Thach University of Medicine, Ho Chi Minh City, Vietnam
2Department of Radiology, Pham Ngoc Thach University of Medicine, Ho Chi Minh City, Vietnam
†These authors are contributed equally.
- Corresponding Author:
- Nguyen Minh Duc
Department of Radiology
Pham Ngoc Thach University of Medicine
Ho Chi Minh City, Vietnam
E-mail: bsnguyenminhduc@pnt.edu.vn
Abstract
Patients and Methods: The study was carried out on 101 patients with NASH. All patients underwent a liver biopsy for histological assessment of liver fibrosis and non-invasive methods for assessment of liver fibrosis including FIB4, NFS, FibroScan, and ARFI. Cut-off values along with the diagnostic accuracy of these methods were determined by receiver-operating characteristic (ROC) curves.
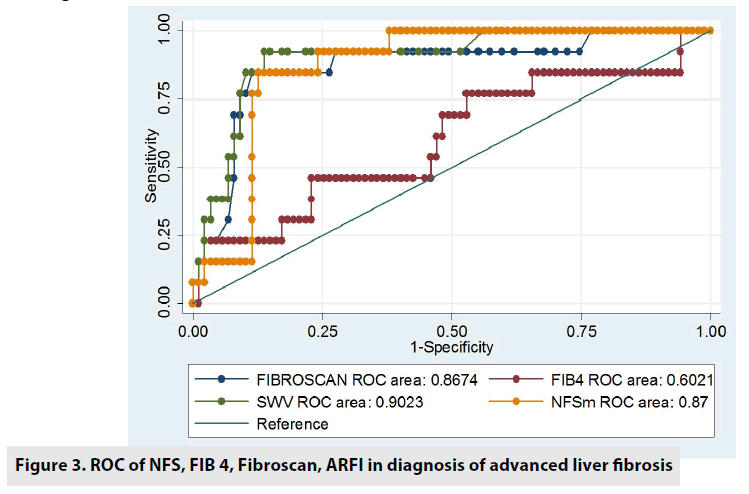
Results: Histological liver fibrosis was evaluated by Metavir scoring (F0: 10 cases; F1: 47 cases; F2: 24 cases; F3: 17 cases; and F4: 3 cases). Liver stiffness determined by FIB4, NFS, FibroScan, and ARFI were significantly correlated with the fibrosis stages (Spearman rho: 0.32; 0.51; 0.56 and 0.54; p<0.05, respectively). AUROC of FIB4, NFS, FibroScan and ARFI for diagnosing ≥ F3 were 0.6, 0.8, 0.8, and 0.9, respectively. FibroScan, ARFI v/s NFS were more accurate than FIB4 for diagnosing ≥ F3 (p<0.05). Among those, NFS had the highest sensitivity for diagnoses of ≥ F3. The specificity values of NFS, ARFI and TE were greater than 80% for diagnosing ≥ F3.
Conclusions: Liver stiffness determined by these methods had significantly correlated with the fibrosis stages. FibroScan and ARFI had more accurate than NFS and FIB4 in diagnosis of advanced fibrosis. NFS was the best method for screening advanced fibrosis (≥ F3) in patients with NASH.
Keywords
liver fibrosis ■ liver stiffness ■ Non-Alcoholic Fatty Liver Disease (NAFLD) ■ Non-Alcoholic Steatohepatitis (NASH) ■ Acoustic Radiation Force Impulse Imaging (ARFI)
Introduction
Non-alcoholic fatty liver disease (NAFLD) is the most common liver disorder in the world. Recent studies have shown that NAFLD is a growing health problem in the Asia Pacific region. The important risk factors associated with NAFLD are obesity, diabetes, hyperlipidemia, and hypertriglyceridemia. NAFLD includes non-alcoholic fatty liver (NAFL) with only fatty liver, no hepatocellular injury; and Non Alcoholic steatohepatitis (NASH) when there is hepatic cell damage with or without liver fibrosis. About 10% of NAFL progress to NASH within 10 years. In addition, 5% - 25% of NASH population progress to cirrhosis, and 30% - 50% of these patients will die from complications within the next 10 years. NASH with the advanced liver fibrosis has a risk of liver cancer [1]. Therefore, staging liver fibrosis plays a very important role in the indication of appropriate treatment to prevent changes to advanced fibrosis (≥ F3).
So far, liver biopsy is still considered as a gold standard for assessing liver fibrosis. Nevertheless, liver biopsy is an invasive method with some severe complications. There have been some non-invasive methods to evaluate rapidly liver fibrosis on patients with NAFLD/ NASH such as NAFLD Fibrosis Score (NFS), FIB 4, and ARFI technique. The NFS is recommended by the American Association for the Study of Liver Diseases (2018) [2] and European Association for the Study of the Liver (2016) [3] in the assessment of patients with advanced fibrosis. The FIB-4 was originally developed for evaluating liver fibrosis in patients co-infected with the hepatitis C virus/human immunodeficiency virus. The score comprises readily available clinical data: age, AST, ALT and platelet count. Transient elastography by Fibroscan measures shear wave velocity of a low-frequency shear wave (50 Hz) transmitted via an ultrasound probe in the liver as an estimate of liver stiffness. ARFI is an elastography technique developed by Siemens using modified commercially available ultrasound machines, integrating both elastography and conventional B-mode ultrasonography. By using conventional ultrasound, the operator is able to avoid large blood vessels and other anatomic confounders of liver stiffness [4]. Conceptually, with increased liver stiffness, shear wave velocity correspondingly increases. There are no studies comparing non-invasive liver fibrosis methods including ARFI, FibroScan, NFS and FIB4 in Vietnam. Therefore, this study aimed to validate the diagnostic usefulness of FIB4, NAFLD Fibrosis Score (NFS), FibroScan, and ARFI in assessing liver fibrosis in patients with NAFLD/NASH.
Materials and Methods
Study design: Cross-sectional analysis.
Population: All patients older than 18-yearolds with nonalcoholic steatohepatitis (NASH) at People Hospital 115 in Vietnam during study period.
Inclusion criteria: patients older than 18- year-olds definitively diagnosed NASH at gastroenterology department, People Hospital 115.
NASH when meets following standards:
Liver fatty from 5% and above,
Infiltration of chronic inflammatory cells and ballooning liver cell damage on pathology [5];
Unremarkable alcoholic: <210 g/week in male, <140 g/week in female during the past two years [5];
Ruling out fatty liver due to other causes such as HBV, HCV, alcohol, medications.
■ Exclusion criteria
Patients did not agree to join the study, did not agree to do liver biopsy or had contraindication.
There was another cause of chronic liver disease.
Biopsy sample did not meet the standard (< 6 portal space).
Invalid results (Fibroscan, ARFI): successful rate <60%, IQR/med >30% [6].
■ Performance
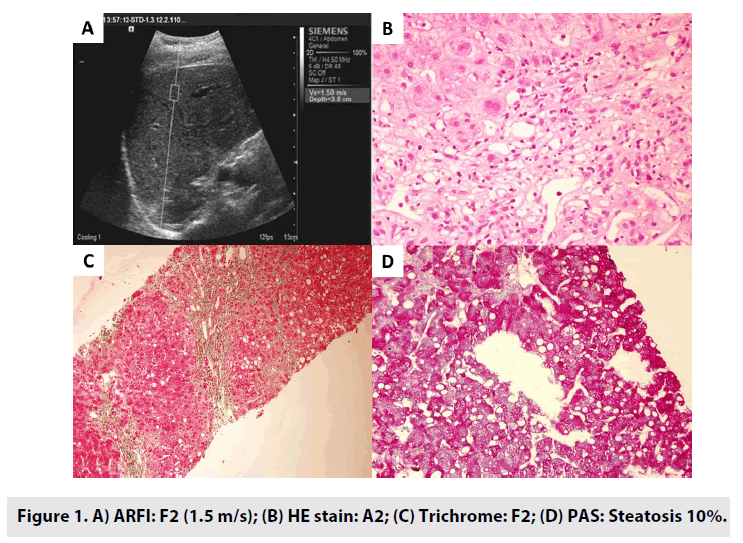
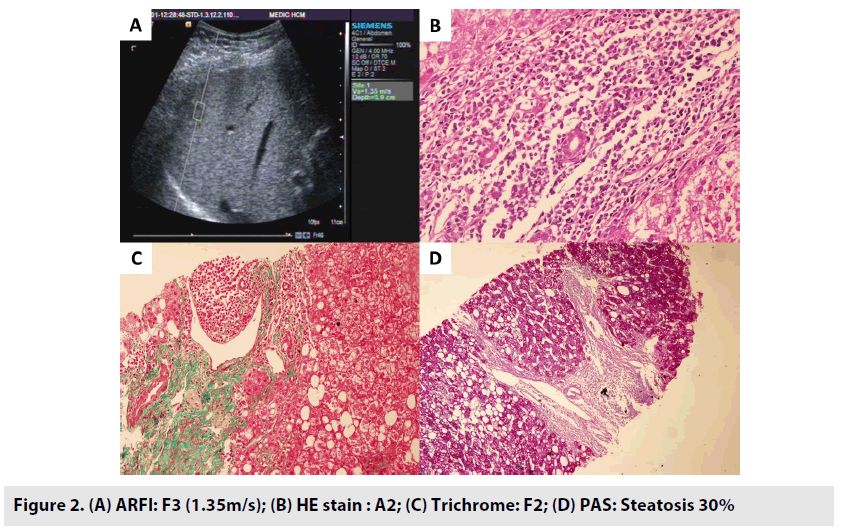
All patients were checked medical history, physical examination, and lab tests. Liver biopsy under the guidance of ultrasound was performed at People Hospital 115 in Vietnam. All patients underwent ARFI technique incorporated with Siemens ACUSON S2000. FibroScan was also carried out prior to or after two weeks of liver biopsy. CBC, AST, ALT, IFG, albumin were done simultaneously a week before biopsy. Histopathological samples stained HE, PAS and Trichrome (FIGURES 1 and 2) were analyzed by histopathologist at Pham Ngoc Thach University of Medicine.
Formula of APRI, NFS, FIB4:
- APRI: APRI=[(AST / ULN AST) x 100] / Platelets (109 /L)] [7]
- NFS= -1.675 + 0.037 × age (years) + 0.094 × BMI (kg/m2) + 1.13 × IFG/diabetes (yes = 1, no = 0) + 0.99 × AST/ALT ratio – 0.013 × platelet (×109/l) – 0.66 × albumin (g/dl) [8]
- FIB-4 = Age (years) × AST (U/L)/ [PLT(109/L)×ALT1/2 (U/L)] [9]
■ Data management (By statistic software STATA 12)
Determine accuracy in diagnosis of fibrosis degree by analyzing ROC (Receiver Operating Characteristic) including Area under the ROC Curve (AUROC), Confidence Interval (CI), sensitivity, specificity, PPV v/s NPV according to the best cut-off value (TABLE 1).
| Method | Cut-off value |
Sen % | Spe % | PPV | NPV |
|---|---|---|---|---|---|
| FIB4 | 2.59 | 69.2 | 56.7 | 78.6 | 81.4 |
| NFS | >0.676 | 52.7 | 97.5 | 82.0 | 88.7 |
| <-1.455 | 90.8 | 71.2 | 55.8 | 98.4 | |
| ARFI | 1.65 m/s | 74.9 | 89.4 | 80.2 | 97.7 |
| FibroScan | 8.26 Kpas | 73.5 | 82.8 | 78.9 | 87.6 |
Table 1. Sensitivity, specificity, PPV v/s NPV and AUROC to diagnosis advanced fibrosis.
Assess the correlation of two continuous variations standard distribution by Pearson correlation with Pearson correlation coefficient r.
Assess the correlation of one continuous variation with one ordinary variation with Spearman’s rank correlation with Spearman correlation coefficient r.
Result is statistically significant when p <0.05.
Results
From 12/2012 to 7/2016, we performed 104 liver biopsy cases, but only 101 cases were eligible enrolled in this study.
■ Baseline characteristics
Age was 44.07 ± 12.13 (20-81). Male was dominant 59.8%.
BMI: 25.20 ± 3.34 (17.96-30.35). Overweight and obese was 63.02%.
Most patients have dyslipidaemia, accounting for 81.3%, of whom hypertriglyceridemia is the most common disorder (63.7%).
Characteristics of biochemistry liver tests (TABLE 2) GGT, AST and ALT had high rate of abnormalities. All patients had bilirubin, ALP, albumin, and INR in a normal range.
| Lab tests | Average | SD | Abnormal value (%) |
|---|---|---|---|
| AST (U/l) | 47.27 | 26.285 | 55.9 |
| ALT (U/l) | 77.32 | 37.12 | 77.6 |
| ALP (U/l) | 78.34 | 25.3 | 0 |
| GGT (U/l) | 77.46 | 53.43 | 59.8 |
| Bilirubin (mg/dl) | 0.66 | 0.33 | 0 |
| INR | 0.99 | 0.08 | 0 |
| Albumin (g/dl) | 4.45 | 0.79 | 0 |
Table 2. Characteristics of biochemical liver tests.
According to AASLD and EASL guideline, NFS has 2 cut-off values to exclude (–1.455) and identify (0.676) advanced fibrosis. Thus, we chose these cut-off values to calculate sensitivity, specificity, PPV and NPV [2,3].
Discussion
Patients with NASH are largely asymptomatic at examination. Nonetheless, routine laboratory tests such as a serum panel of liver enzymes (albumin, bilirubin, alanine aminotransaminase (ALT), aspartate aminotransaminase (AST), gamma-glutamyl transpeptidase (GGT), full blood count (CBC) and prothrombin time/international normalized ratio (INR) are mostly manifested with abnormalities. Elevated ALT, AST, GGT levels are predominant findings in patients with NASH in our study (TABLE 3).
| Stage of liver fibrosis | F0 | F1 | F2 | F3 | F4 | Total |
|---|---|---|---|---|---|---|
| n | 10 | 47 | 24 | 17 | 3 | 101 |
| % | 9.9 | 46.5 | 23.7 | 16.8 | 3 | 100 |
Table 3. Stage of liver fibrosis according to Metavir score.
Transient elastography via Fibroscan machine and ARFI were advantage techniques with successful rate in this study was 100%. In this study, NFS, FIB 4, Fibroscan, ARFI (SWV) had significant correlation with degree of liver fibrosis.
NFS, FIB 4, liver stiffness via Fibroscan and ARFI increased in concordance with worsened stage of liver fibrosis according to Metavir score; whereas ultrasound elastography (ARFI and FibroScan) had significantly correlation with biochemical makers (NFS and FIB4) (TABLE 4).
| FIB4 | NFS | ARFI | FibroScan | |
|---|---|---|---|---|
| Spearman rho | 0.32 | 0.51 | 0.56 | 0.54 |
| p | 0.023 | 0.02 | 0.001 | 0.015 |
Table 4. Relationship between NFS, FIB 4, Fibroscan, ARFI and stage of liver fibrosis.
According to meta-analysis, non-invasive fibrosis methods including NFS, CK18 and ARFI had no difference in sensitivity, specificity and AUROC to diagnose advanced fibrosis [10]. The World Health Organization, AASLD and EASL recommend using of NFS to initially assess the advanced fibrosis which will help to identify and exclude advanced fibrosis in patients with NAFLD. Patients who cannot be identified advanced fibrosis by NFS should be undergone FibroScan to further diagnosis of advanced liver fibrosis. ARFI, a novel technology for evaluating liver fibrosis in chronic liver disease in general and NAFLD in particular, was validated similar to FibroScan. Our recent study also showed that ARFI technique was valuable in evaluating liver fibrosis in patients with NASH [11]. Our findings showed that FibroScan, ARFI and NFS were more accurate than FIB4 for diagnosis of ≥ F3 (p<0.05) (Figure 3). NFS had the highest sensitivity, thus NFS was considered as the first screening test to determine or exclude advanced fibrosis in accordance with the current practice guidelines. A score of <-1.455 had sensitivity of 90.8% and specificity of 71.2% to exclude advanced fibrosis meanwhile a score of > 0.67 had sensitivity of 52.7% and specificity of 97.5% to identify advanced fibrosis. The specificity values of NFS, ARFI and FibroScan were greater than FIB4, of which NFS with high cut-off value (0.67) had the highest specificity. NPV values of these methods were greater than 80%, of which ARFI was the highest (97.7%). Therefore these methods should be applied in routine work to improve the diagnosis of liver fibrosis in patients with NAFLD/NASH.
Conclusion
Liver stiffness determined by non-invasion methods including NFS, FIB4, Fibroscan, ARFI had significantly correlated with the fibrosis stages. FibroScan and ARFI were more accuracy than NFS and FIB4 in diagnosis of advanced liver fibrosis. NFS was the best method for screening advanced fibrosis (≥ F3) for patients with NASH.
Disclosure statement
Tran Thi Khanh Tuong and Nguyen Minh Duc contributed equally to this article. All authors read and approved manuscript. The authors of this manuscript declare no conflict of interest.
References
- Blachier M, Leleu H, Peck-Radosavljevic M et al. The burden of liver disease in Europe: a review of available epidemiological data. J. Hepatol. 58: 593-608, (2013).
- Nguyen LH, Nguyen MH. Systematic review: Asian patients with chronic hepatitis C infection. Aliment. Pharmacol. Ther. 37: 921-936, (2013).
- Amarapurkar DN, Hashimoto E, Lesmana LA et al. How common is non-alcoholic fatty liver disease in the Asia-Pacific region and are there local differences?. J. Gastroenterol. Hepatol. 22: 788-793, (2007).
- Chou R, Wasson N. Blood tests to diagnose fibrosis or cirrhosis in patients with chronic hepatitis C virus infection: a systematic review. Ann. Intern. Med. 158: 807-20, (2013).
- Wai CT, Greenson JK, Fontana RJ et al. A simple noninvasive index can predict both significant fibrosis and cirrhosis in patients with chronic hepatitis C. Hepatology. 38: 518-26, (2003).
- Chalasani N, Younossi Z, Lavine JE, et al. The Diagnosis and Management of Non-Alcoholic Fatty Liver Disease: Practice Guideline by the American Association for the Study of Liver Diseases, American College of Gastroenterology, and the American Gastroenterological Association. Hepatology. 55: 2005-23 (2012).
- European Association for the Study of Liver. EASL Clinical Practical Guidelines: Management of Alcoholic Liver Disease. J. Hepatol. 57: 399-420, (2012).
- Bota S, Sporea I, Sirli R et al. Factors associated with the impossibility to obtain reliable liver stiffness measurements by means of Acoustic Radiation Force Impulse (ARFI) elastography-analysis of a cohort of 1,031 subjects. Eur. J. Radiol. 83: 268-272, (2014).
- Goertz RS, Sturm J, Pfeifer L et al. ARFI cut-off values and significance of standard deviation for liver fibrosis staging in patients with chronic liver disease. Ann. Hepatol. 12: 935-941, (2013).
- Li SM, Li GX, Fu DM et al. Liver fibrosis evaluation by ARFI and APRI in chronic hepatitis C. World. J. Gastroenterol. 20: 9528-9533, (2014).
- Bota S, Herkner H, Sporea I et al. Meta-analysis: ARFI elastography versus transient elastography for the evaluation of liver fibrosis. Liver. Int. 33: 1138-1147, (2013).
- Friedrich-Rust M, Nierhoff J, Lupsor M et al. Performance of Acoustic Radiation Force Impulse imaging for the staging of liver fibrosis: A pooled meta-analysis. J. Viral. Hepat. 19: 212-219, (2012).
- Nierhoff J, Chávez Ortiz AA, Herrmann E et al. The efficiency of acoustic radiation force impulse imaging for the staging of liver fibrosis: a meta-analysis. Eur. Radiol. 23: 3040-3053, (2013).
- Tachi Y, Hirai T, Kojima Y et al. Liver stiffness reduction correlates with histological characteristics of hepatitis C patients with sustained virological response. Liver. Int. 38: 59-67, (2018).
- Tachi Y, Hirai T, Kojima Y et al. Liver stiffness measurement using acoustic radiation force impulse elastography in hepatitis C virus-infected patients with a sustained virological response. Aliment. Pharmacol. Ther. 44: 346-55, (2016).
- Le L. Comparison of liver stiffness values by Virtual Touch ARFI and Fibroscan TE in Large Sample Study of 554 Cases. Eur. Radiol. 23: 1-14, (2013).
- Sporea I, Sirli R, Popescu A et al. Acoustic Radiation Force Impulse (ARFI) - A new modality for the evaluation of liver fibrosis. Med. Ultrason. 12: 26-31, (2010).


