Research Article - International Journal of Clinical Rheumatology (2018) Volume 13, Issue 2
Estimation of bone fracture risk using FRAX model in some regions of Russian Federation
- *Corresponding Author:
- Irina A. Skripnikova
Head of Osteoporosis Preventive Department
National Medical Research Center for Preventive Medicine Ministry of Healthcare
Russian Federation
E-mail: ISkripnikova@gnicpm.ru
Abstract
Purpose: To estimate the absolute risk (AR) of fractures in urban population of some Russian regions using Russia-specific FRAX® model, as well as to evaluate therapeutic intervention threshold (TIT) adopted in Russia.
Material and methods: Representative samples of the population from 8 Russian cities included 9143 Russian residents (6324 women and 2819 men) aged 40-69 years (mean age 53.29 ± 0.02 years). AR of fractures was calculated without BMD using the batch processing of data.
Results: The average AR of major fractures (MF) was 7.8% (8.9% in women and 5.5% in men, p=0,0001), hip fractures (HF) – 0.7% (0.9% in women and 0.4% in men, p=0.0001). In women AR was higher in all age groups across all cities in comparison with that in men both for MF and HF. The proportion of individuals who had a previous fragility fractures was 15.2% and 30.6% from them were determined to be in a highrisk of fractures zone and 69.4% - in the low-risk of fractures zone.
Conclusion: The average AR of MF and HF increased with age regardless of participants’ gender, and were significantly higher among female population. The majority of the respondents with the previous fragility fractures have been included into the low-risk of fractures zone, which implies the low sensitivity of the TIT currently established for country.
Keywords
osteoporosis risk factors, 10-year fracture probability, FRAX®, therapeutic intervention threshold, climate and geography effects, basic economic features
Introduction
Osteoporosis is the major cause of bone fractures throughout the world. Even minimal trauma can cause fragility fractures. According to World Health Organization (WHO) and International Osteoporosis Foundation osteoporosis, among other chronic non-infectious diseases, should be considered as one of the most important and socially significant public health issues of many countries including Russian Federation (Russia) [1]. Demographic changes observed in Russia during the past 20 years indicate a significant aging of the general population. The United Nations (UN) forecasts suggest that while the total Russian population will be decreasing from 143 million in 2010 down to 133.8 million in 2035, the number of men and women aged 60 and over will increase by 43% and 30% respectively, whereas number of people aged 70 and over will increase by 70% and 54% respectively. At the same time, the number of hip fractures (HF) and major osteoporotic fractures (MF) will increase by 42% and 23.7% respectively [2,3].
Due to the above-listed facts not only the early diagnostics and timely therapeutic intervention, but also the prediction of low-energy fractures risk is gaining in importance [4].
The fracture risk assessment and outcome prediction are critical for osteoporosis preventive care. A number of recent epidemiological studies demonstrated that Dual energy X-ray Absorptiometry (DXA) method, which is considered a golden standard in osteoporosis diagnostics, has insufficient sensitivity and is unable to satisfactory detect patients with elevated risk of bone fractures [5-7]. This fact contributed to the search for more universal methods of fractures risk assessment.
Considering that certain clinical risk factors have an independent effect on the risk of bone fractures, regardless of the bone mineral density (BMD) values, the group of WHO experts developed the Fracture Risk Assessment Tool (FRAX®) using which the 10-year probability of fractures can be estimated based on the complex evaluation of risk factors with or without factoring in BMD [8]. Factors included in FRAX® model were identified among the study participants from nine large countries, such as: Canada, Japan, Australia and several European Union countries, covering the population of several continents. Subsequently, the model was tested on 11 independent population-based cohorts who constituted over a 1 million of man-years [9].
The probability of fractures varies considerably in different regions of the world [10]. This is mainly due to the variable frequencies of fractures occurrence, as well as differences in a life span embedded into the FRAX® model. The probability of fractures is also influenced by multiple risk factors that differ not only between various countries, but also between certain territories of larger countries with ethnically-diverse populations [11-13]. Considering these circumstances subsequently the national FRAX® models were developed based on the country-specific epidemiological studies of fractures and mortality rates related to them.
Currently FRAX® model and its localized versions are available in 58 countries around the world. Russian FRAX® model became available for practical use in 2012 and was based on the epidemiological data on peripheral fractures (femur, shoulder and forearm) and corresponding mortality normalized by sex and age. The model was developed based on full-fledged scientific data, including cases of hospitalization, gathered in two Russian cities: Yaroslavl’ and Pervoural’sk [14]. However, as the territory of Russia is large, spans several climatic zones and ethnically diverse it is virtually impossible to extrapolate the studies’ results to the whole country. According to the results of earlier multicenter epidemiological studies the frequency of fragility fractures had varied substantially between the regions [15]. However, the data collection protocols used in these studies was also different from those used in the baseline study the Russian version of FRAX® model was based on. Ethnic diversity can also cause significant differences in the prevalence of both the fractures themselves and their risk factors [11,12]. Moreover, significant differences in prevalence of certain risk factors included in FRAX® were detected which contributes individually or collectively towards the estimation of fracture probability [16,17]. Consequently, in order to obtain a complete picture of the prevalence of osteoporotic fractures in the Russian Federation, high quality regional epidemiological studies are necessary. Large number of regions included in the study will provide additional information for development of region-specific osteoporosis-preventive activities aimed at managing the risk of fractures.
Determination of the therapeutic intervention threshold (TIT) is another important component of fractures’ prediction and prevention. TIT represents individual fracture probability at which the commencement of the osteoporosis specific treatment is justifiable. TIT is developed for each specific country and considers local economic conditions. The societal willingness to pay is considered to be the major factor contributing to variations in TIT levels per year among the countries, provided that the population’s quality of life or quality-adjusted life-years (QALY) remained consistent [18-20].
The TIT for Russia as well as Russian FRAX® model was developed based on the epidemiological data obtained in Yaroslavl’ and Pervoural’sk. The threshold calculation takes into account the 10-year MF probabilities in women of specific age, with body mass index of 24 kg/m2 and only one risk factor, i.e. lowenergy fracture which on its own is the reason for prescription of the specific therapy [9]. This TIT is also recommended for men as the clinical and economic efficacy of intervention in men is almost identical to that in women with the equivalent fracture risk [3,11]. Russia-specific FRAX® model not include pharmacoeconomic analysis due to lack of the respective healthcare-cost studies.
The prognostic validation of the method requires larger clinical studies in random population groups in various regions of Russia. Conduction of full-fledged epidemiological studies across Russia is an expensive and labor-intensive process which requires significant government funding. So far, the Russia-specific FRAX® model was tested among the urban population of different Russian regions as part of the multicenter epidemiological study of cardiovascular Diseases in Russian Federation.
The goal of the study was to estimate the 10- year probability of fractures in urban population of some Russian regions using Russia-specific FRAX® model, as well as to evaluate TIT adopted in Russia.
The objectives of the study were:
• assessment of the average absolute risk of MF and HF in Russian population;
• determination of the percentage of population with high risk of lowenergy fractures that require medical intervention.
Materials and methods
The study was performed within the framework of a multicenter observational project “Epidemiology of Cardiovascular Diseases in Regions of Russian Federation (ESSE) in 2012- 2014”.
The analysis was performed using representative samples of the population from different regions of the Russia represented by the following 8 cities: Vologda (Northwestern Federal District (FD); n=976), Ivanovo (Central FD; n=1309), Volgograd (Southern FD; n=1097), Tyumen (Ural FD; n=1279), Kemerovo (Siberian FD; n=1081), Krasnoyarsk (Siberian FD; n=398), Vladivostok (Far-Eastern FD; n=1382) and Vladikavkaz (North-Caucasian FD; n=1621). These cities were selected based on the climatic, geographic and economic features. The northwestern border of the territory covered by the study was Vologda (59º13’N, 39º53’E), southern border was Vladikavkaz (43º02’N, 44º40’E) and eastern border was Vladivostok (43º06’N, 131º52’E).
The systematic stratified multi-stage random sample was formed in each region based on availability of hospital and outpatient facilities in accordance with Kish selection methodology [21]. ESSE protocol operated in most advanced healthcare institutions to achieve maximal randomization as described. The sampling methodology and research prerequisites are discussed in detail above [22]. Approximately 80% of the patients responded to the requests.
Inclusion criteria
Men and women at the age of 40 to 69 years old. All patients enrolled in the study signed informed consent forms.
Exclusion criteria
Refusal to participate in the study.
In total, 9143 people were enrolled in the study including 6324 women and 2819 men with the mean age of 53.29 ± 0.02 years old. Predominantly the participants were under the age of 65 (77%) and only 112 patients were over the age of 65. Individuals aged 70+ with substantially higher risks of fractures were not included due to ESSE protocol limitations.
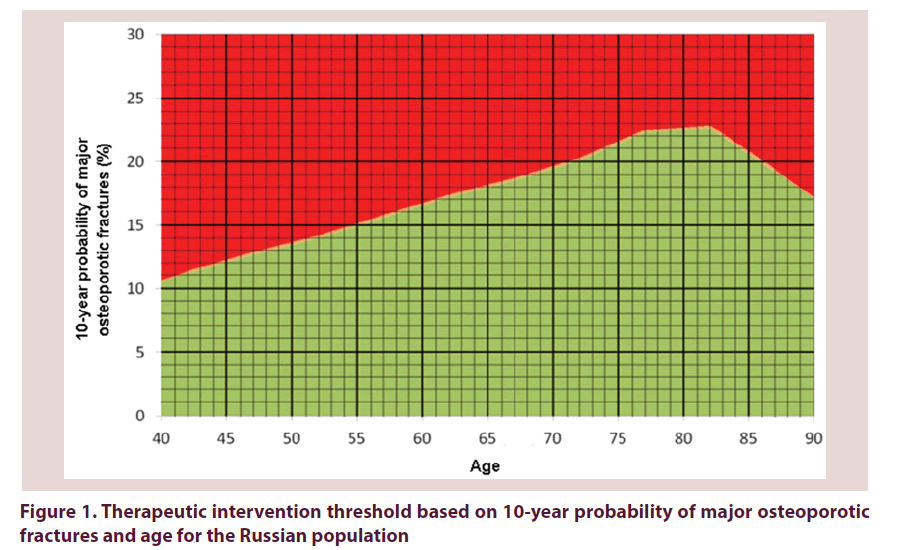
10-year probability of fractures was calculated based on Russia-specific FRAX® model (without BMD) using data batch processing. Patients with high risk of fractures requiring antiosteoporotic treatment were determined based on the TIT proposed by the Russian Osteoporosis Association in 2012 Figure 1.
Figure 1. Therapeutic intervention threshold based on 10-year probability of major osteoporotic fractures and age for the Russian population
In order to estimate the clinical risk factors of osteoporosis and fractures the following questions regarding risk factors embedded into the FRAX® model were included into the study questionnaire designed in a modular manner: contained socio-demographic data of subjects, behavioral features and habits, health status, personal and family history of fractures (including hip fractures in parents), smoking, alcohol abuse, body mass index, use of glucocorticoids, presence of rheumatoid arthritis and/or secondary osteoporosis. The FRAX® model notes on the risk factors were used to determine contributions of the parameters towards risk estimation [23].
Data analysis was performed using Statistical Analysis System (SAS) software package (SAS Institute Inc, USA) and included descriptive statistics, mean and distribution analysis, frequency tests, correlation and dispersion analysis (ANOVA – Analysis of Variation).
Results and discussion
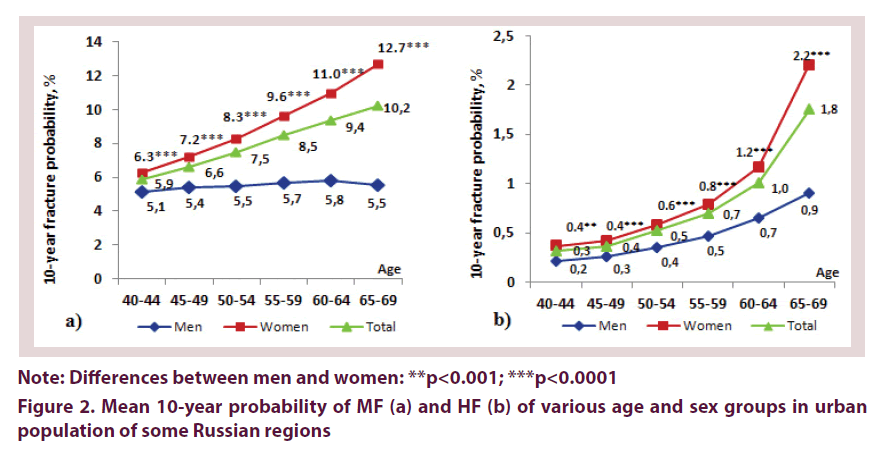
Use of the FRAX® model without BMD permitted extensive application of the calculator for detection of participants with high risk of fractures in regions where DXA is unavailable. Mean 10-year probability of MF and HF in the sample was 7.8% and 0.7% respectively and women had significantly higher probability comparing to men (8.9% vs. 5.5% for MF and 0.9% vs. 0.4% for HF).
With age a gradual increase in the 10-year probability of MF was observed both in men and women from 5.9% in the age group of 40-44 years old up to 10.2% in the age group of 65- 69 years old. By the age of 70 the risk of MF doubled in women and increased by 1.2 times in men. In women the average risk of fractures has been increasing consistently with age while in men maximal risk was achieved by 60-64 years of age and then has been decreasing gradually Figure 2a. Similar tendency was observed with respect to the absolute HF risk. The increase in mean 10-year probability of HF with age from 0.3% in the age group of 40-44 years old up to 1.8% in the age group of 65-69 years old was identified. In women the risk of HF was significantly higher in all age groups comparing to that in men, and dramatically increased at the age of 60+, while in men the trend was less steep. Risk of HF increased by 5.5 times in women and by 4.5 times in men between the age of 40 and 70 years old Figure 2b.
The increase in 10-year probability of MF and HF with age, as well as the decrease in risk of fractures at the age 80-85+ years old, due to the prevalence of the probability of death over the risk of fractures, was observed in both foreign and domestic studies [10,14,24].
When comparing the 10-year probabilities of MF and HF in various Russian cities, the lowest rates were observed in Tyumen (6.7% MF and 0.54% HF), consequently this city was considered a reference. The highest risk was noted in Vologda (8.15% MF and 0.8% HF).
Absolute risk of MF varied depending on geographical location of the cities and was significantly higher in the most northern city - Vologda compared to that in the most southern city - Vladikavkaz (8.15% vs. 7.72%, p<0,05). The significant difference in absolute risk of MF was detected between these cities, however no clear north-to-south gradient was observed. No reliable difference was identified between the uttermost west and east cities of Russia. Similar trend was detected in the prevalence of the risk factors included in FRAX®, particularly of previous low-trauma fractures the frequency of which was considerably higher in Vologda and substantially lower in Vladikavkaz [16]. However, the gradual decrease in the frequency of fractures was not revealed, which demonstrates relatively small contribution of climatic and geographical features to the risk of fractures. It appears that social and economic factors, or combinations of other factors are more important contributors to the risk of fractures.
The mean 10-year probability of fractures in Tyumen was similar to values previously observed in Yaroslavl’ and Pervoural’sk during development of the Russia-specific FRAX® model. Apparently, the Russia-specific fractures risk assessment algorithm was designed based on the data obtained from the cities with relatively low risk of fractures.
Absolute risk of MF and HF was significantly higher in women compared to that in men in all other cities included into the study Table 1.
| City | ||||||||
|---|---|---|---|---|---|---|---|---|
| Vologda (59º13'N, 39º53'E) | Vladivos-tok (43º06'N,131º52'E) | Vladikav-kaz (43º02'N,44º40'E) | Kemero-vo (55º19'N, 86º4'E) | Volgograd (48º43'N, 44º30'E) | Ivanovo (56º59'N,40º58'E) | Krasno-yarsk (56º01'N, 92º52'E) | Tyumen (57º09'N, 65º32'E) | |
| Women (n) | 533 | 1000 | ### | 643 | 781 | 912 | 333 | 966 |
| Mean 10-year probability of MF, % | 10.04*** | 9.52*** | 9.81*** | 9.37*** | 9.16*** | 8.92*** | 8.54* | 7.73 |
| Mean 10-year probability of HF, % | 1.05*** | 1.03*** | 0.95*** | 0.97*** | 0.92*** | 0.86*** | 0.84* | 0.71 |
| Men (n) | 443 | 382 | 465 | 438 | 316 | 397 | 65 | 313 |
| Mean 10-year probability of MF, % | 5.96*** | 5.94*** | 5.36** | 5.58*** | 5.54*** | 5.15* | 4.81 | 4.69 |
| Mean 10-year probability of HF, % | 0.56*** | 0.52*** | 0.43* | 0.47*** | 0.48*** | 0.4 | 0.41 | 0.37 |
Note: Difference between various cities and Tyumen: *p<0.05; **p<0.001; ***p<0.0001
Table 1. Gender differences in mean 10-year probability of MF and HF in cities of Russia
In accordance with the TIT chart for Russia Figure 1, the proportion of individuals with the high risk of MF in the total sample was 7% (1.7% in men and 8.9% in women). To some extent, the low percentage of individuals with high risk of fractures is associated with a relatively “young” sample. The lowest number of women with high risk of MF was observed in Tyumen (4%) while in other cities the number of women with elevated risk of MF was significantly higher (p<0.0001). No significant interregional differences in the frequency of the high risk of MF were noted in men Table 2.
| City | Women | Men | ||||
|---|---|---|---|---|---|---|
| Fraction of patients with high risk of MF, % | P | Odds ratio (CI95%) | Fraction of patients with high risk of MF, % | P | Odds ratio (CI95%) | |
| Vologda | 13.9 | 0.0001 | 4.5 (2.9-7.0) | 1.9 | NS | 6.5 (0.8-51.8) |
| Vladikavkaz | 12.7 | 0.0001 | 4.0 (2.7-6.0) | 2.0 | 0.05 | 7.0 (1.0-55.1) |
| Vladivostok | 12.2 | 0.0001 | 3.8 (2.5-5.7) | 2.4 | 0.05 | 8.5 (1.1-66.6) |
| Kemerovo | 11.8 | 0.0001 | 3.6 (2.3-5.6) | 2.5 | 0.05 | 8.4 (1.1-65.0) |
| Volgograd | 8.8 | 0.001 | 2.5 (1.6-3.9) | 1.2 | NS | 4.4 (0.5-39.2) |
| Ivanovo | 8.0 | 0.05 | 2.2 (1.4-3.5) | 0 | NS | 1.5 (0.1-16.2) |
| Krasnoyarsk | 7.6 | 0.05 | 2.1 (1.2-3.7) | 0 | NS | 0.0 (0.0-999.0) |
| Tyumen | 4 | - | - | 0 | - | - |
Table 2. Distribution of men and women with high risk of MF in cities of Russia
The portion of participants with a history of lowenergy fractures was 15.2% (n=1211; 438 men and 773 women) of which 30.6% were in the red - high risk zone and 69.4% were in the green - low risk zone (according to the TIT chart for Russia above) which indicates low prognostic value of the method.
As of today, there have been only few recent studies on the use of the Russia-specific FRAX® model to determine the 10-year probability of fractures. These studies has also pointed out low sensitivity of Russia-specific FRAX® model with respect to estimation of 10-year probability of fractures, which is probably due to an artificially inflated TIT rather than flaws of the FRAX® model itself [25].
Apart from the effects of climate and geography on distribution of the 10-year probability in various regions of Russia, we have also evaluated influence of certain basic economic features of cities included into study and individual parameters of healthcare availability to the citizens with the absolute risk of fractures Table 3.
| City | Total regional product per capita, RUB | Mean income per capita, RUB | Mean 10-year probability of MF, % | Mean 10-year probability of HF, % | Budget plus mandatory state health insurance, RUB | Mandatory state health insurance, RUB |
|---|---|---|---|---|---|---|
| Tyumen without autonomous regions | 604 921.2 | 24 731.3 | 6.66 | 0.54 | 13 554.67 | 12 782.87 |
| Krasnoyarsk | 441 084.9 | 24 921.7 | 7.08 | 0.62 | 13 387.5 | 11 915 |
| Vladivostok | 297 224.3 | 24 342.5 | 7.95 | 0.77 | 12 363.9 | 10 459.34 |
| Vologda | 289 782.8 | 20 513.2 | 8.15 | 0.8 | 10 149.7 | 8 451 |
| Kemerovo | 243 932.3 | 19 697.4 | 7.58 | 0.72 | 11 445.9 | 9 050.3 |
| Volgograd | 235 814.1 | 17 589.6 | 7.47 | 0.7 | 10 094.9 | 7 234.9 |
| Vladikavkaz | 168 268.3 | 17 788.1 | 7.72 | 0.7 | 9 510.6 | 7 595.7 |
| Ivanovo | 151 263.6 | 18 123.2 | 7.12 | 0.64 | 9 397.6 | 7 903.7 |
Table 3. Interrelation of the fracture risks with welfare and income in population of various cities of Russia
| Total regional product, RUB | Mean income per capita, RUB | Budget plus mandatory state health insurance, RUB | Mandatory state health insurance, RUB | |||||
|---|---|---|---|---|---|---|---|---|
| r | p | r | p | r | p | r | p | |
| Mean 10-year probability of MF, % (n=8) | -0.48 | 0.19 | -0.49 | 0.18 | - | - | - | - |
| Mean 10-year probability of HF, % (n=8) | -0.44 | 0.24 | -0.46 | 0.21 | - | - | - | - |
| Individual 10-year probability of MF, % (n=9143) | -0.05 | 0.0001 | -0.06 | 0.0001 | -0.06 | 0.0001 | -0.07 | 0.0001 |
| Individual 10-year probability of HF, % (n=9143) | -0.02 | 0.05 | -0.03 | 0.002 | -0.03 | 0.004 | -0.05 | 0.0001 |
Table 4. Correlations between economic parameters of the regions and 10-year probability of fracture risk
According to the official data of the Russian state statistical agency Rosstat in 2013 (the year of the present study) Tyumen and Krasnoyarsk had more favorable economic conditions. Total regional product in these cities was 1.5-3 times higher than that in other cities included into the study [26,27]. Moreover, the regional funding of mandatory state health insurance programs per capita and standards of the free healthcare were also higher in these cities compared to that in other cities covered by the study [28].
Our data indicates that 10-year probability of fractures, as well as the number of participants with the high risk of low-energy fractures was the lowest in Tyumen and Krasnoyarsk.
Based on the assessment of the correlation between total regional product, mean individual income, mandatory state health insurance, budget plus mandatory state health insurance and mean 10-year probability of MF and HF in each region covered by the study, quite significant correlations were identified. These correlations cannot be deemed statistically significant due to the insufficient number of regions included in the study. However, the low negative correlation coefficient between the economic parameters of the regions and the individual 10-year probability of fractures was determined to be statistically significant Table 4.
Thus, the data suggests that even small increase in mandatory state health insurance may significantly lower the risks of fractures regardless of the climate and/or geographical conditions of the region.
Study limitations
The study is not population-based, since the sample is not represented by all Federal districts. The Volga region is not included in the study. This study did not include persons over 70 years of age, as this was not provided for by ESSE protocol.
Conclusion
The present study is based on the Russia-specific FRAX® model and estimates the risk of fractures in random samples recruited in different regions of Russia. The epidemiological study of such scale was conducted in Russia for the first time, thus the batch processing of the FRAX® algorithm was used. Mean 10-year probability of MF varied depending on the geographical location of the selected cities and was higher in the most northern city (Vologda) compared to that in the most southern city (Vladikavkaz). However, no significant north-to-south gradient in fracture risks was observed. Tuymen and Krasnoyarsk had the lowest mean 10-year probability of fractures and minimal number of patients with high risk of low energy fractures which is potentially due to lower prevalence of fracture clinical risk factors in these regions, the most favorable economic situation and better provision of citizens with the free healthcare associated with multiple government programs. Consequently, this might be indicative of the fact that the economic conditions of each particular region, along with climate or geography, might play a significant role in the risk of fractures.
Despite the identified differences between the regions, certain similarities were also observed. Overall, 10-year probability of MF and HF was increasing with age regardless of sex and was higher in female patients in all cities.
Current TIT used in Russia has been found to have low prognostic value as the majority of patients with the history of low-energy fractures (i.e., individuals with a known high risk of fractures that require medical intervention) were assigned into a low fracture risk category according to the Figure 1 above.
Regional variability of 10-year probability of fractures and prevalence of clinical risk factors indicate the need for primary study and monitoring of the risk factors in different regions of Russia in order to manage the risk of fractures and improve preventive care considering the specific characteristics of each particular region. Further research is required using pharmacoeconomic analysis in order to increase the accuracy in determination of the therapeutic intervention threshold values applicable in Russia.
Acknowledgement
The authors are grateful to the regional study coordinators: EV Indukaeva1, GV Tolparov2, YI Grinstein3, AY Efanov4, VA Il’in5, NV Kulakova6, SV Nedogoda7, SV Romanchuk8
1Institute for Complex problems of Cardiovascular Diseases Siberian Branch Russian Academy of Medical Sciences, Kemerovo, Russia
2North Ossetian State University, Vladikavkaz, Russia
3Krasnoyarks State Medical University, Krasnoyarsk, Russia
4Tyumen State Medical University, Tyumen, Russia
5Institute of Social and Economic Development of the Territories, Russian Academy of Sciences, Vologda, Russia
6Pacific State Medical University, Vladivostok, Russia
7Volgograd State Medical University, Volgograd, Russia
8Regional Cardiocentre, Ivanovo, Russia
Conflicts of interest
Irina Skripnikova, Margarita Myagkova, Svetlana Shalnova, Alexander Deev, and Oxana Drapkina declare that they have no conflict of interest.
Compliance with ethical standards
Ethical approval
All procedures performed in studies involving human participants were in accordance with the ethical standards of the institutional and/or national research committee and with the 1964 Helsinki declaration and its later amendments or comparable ethical standards.
Informed consent
Informed consent was obtained from all individual participants included in the study.
References
- Lesnyak OM. Audit of the state of the problem of osteoporosis in Eastern Europe and Central Asia 2010. Inter. Osteoporosis Foundation (IOF). (2011).
- Lesnyak O, Ershova O, Belova K et al. Epidemiology of fracture in the Russian Federation and the development of a FRAX model. Arch. Osteoporos. 7 (1-2), 67–73 (2012).
- Kanis JA, McCloskey E, Johansson H et al. European guidance for the diagnosis and management of osteoporosis in postmenopausal women. Osteoporosis. Int. 24(1), 23–57 (2013).
- Kling JM, Clarke BL, Sandhu NP. Osteoporosis Prevention, screening, and treatment: a review. J. Womens. Health. (Larchmt). 23(7), 563–572 (2014).
- Cranney A, Jamal SA, Tsang JF et al. Low bone mineral density and fracture burden in postmenopausal women. Can. Med. Assoc. J. 177(6), 575–580 (2007).
- Wainwright SA, Marshall LM, Ensrud KE et al. Hip fracture in women without osteoporosis. J. Clin. Endocrinol. Metab. 90(5), 2787–93 (2005).
- Sanders KM, Nicholson GC, Watts JJ et al. Half the burden of fragility fractures in the community occur in women without osteoporosis. When is fracture prevention cost-effective? Bone. 38(5), 694–700 (2006).
- Kanis JA, Johnell O, Oden A et al. FRAX and the assessment of fracture probability in men and women from the UK. Osteoporos. Int. 19(4), 385–397 (2008).
- Kanis JA, Hans D, Cooper C et al. Interpretation and use of FRAX in clinical practice. Osteoporos. Int. 22(9), 2395–2411 (2011).
- Kanis JA, Johnell O, De Laet C et al. International variations in hip fracture probabilities; implications for risk assessment. J. Bone. Miner. Res. 17(7), 1237–1244 (2002).
- Kanis JA on behalf of the World Health Organization Scientific Group. Assessment of osteoporosis at the primary healthcare level. Technical Report. WHO Collaborating Center, University of Sheffield, UK (2008).
- Cauley JA, El-hajj Fuleihan G, Arabi A et al. Official Positions for FRAX® clinical regarding international differences from Joint Official Positions Development Conference of the International Society for Clinical Densitometry and International Osteoporosis Foundation on FRAX®. J. Clin. Densitom. 14(3), 240–62 (2011).
- Levine S, Makin M, Menczel J et al. Incidence of fractures of the proximal end of the femur in Jerusalem: a study of ethnic factors. J. Bone. Joint. Surg. 52A, 1193–1202 (1970).
- Lesnyak O, Ershova O, Belova K et al. Epidemiology of osteoporotic fractures in the Russian Federation and the Russian model of FRAX. Osteoporosis and Osteopathy. 3, 3–8 (2014).
- Mikhailov E, Benevolenskaya L, Anikin S. The frequency of major osteoporotic fractures localizations among the urban population in Russia. Rheumatology Science and Practice J. 3, 75 (2001).
- Skripnikova I, Guryev A, Shalnova S et al. The prevalence of clinical factors used for risk assessment of osteoporotic fractures. Rus. J. Prev. Med. 19(5), 32–40 (2016).
- Nikitinskaya O, Toroptsova N. Prevalence of clinical risk factors for osteoporotic fractures and osteoporosis of the distal forearm in residents of five cities of the Privolzhsk Federal District. Sovr. Med. 5(1), 42–46 (2017).
- Borgstrom F, Johnell O, Kanis JA et al. At what hip fracture risk is it cost-effective to treat? International intervention thresholds for the treatment of osteoporosis. Osteoporos. Int. 17(10), 1459–1471 (2006).
- Kanis JA, Borgstrom F, Zethraeus N et al. Intervention thresholds for osteoporosis in the UK. Bone. 36(1), 22–32 (2005).
- Kanis JA, McCloskey E, Johansson H et al. Case finding for the management of osteoporosis with FRAX-assessment and intervention thresholds for the UK. Osteoporos. Int. 19(10), 1395–1408 (2008).
- https://www.wiley.com/en-us/Survey+Sampling-p-9780471109495
- ECVD-RF Study Committee. Epidemiology of cardiovascular diseases in various regions of Russia- Rationale and design of the study. Rus. J. Prev. Med. 6, 25–34 (2013).
- https://www.sheffield.ac.uk/FRAX/tool.jsp?country=22
- Strom O, Borgstrom F, Kanis JA et al. Osteoporosis: burden, health care provision and opportunities in the EU: a report prepared in collaboration with the International Osteoporosis Foundation (IOF) and the European Federation of Pharmaceutical Industry Association (EFPIA). Arch. Osteoporos. 6, 59–155 (2011).
- Nikitinskaya O, Toroptsova N. Assessment of fractures risk using FRAX® model (Retrospective 10-year study). Almanac. Clin. Med. 32, 50–55 (2014).
- https://www.fedstat.ru/indicator/42928
- http://www.gks.ru/wps/wcm/connect/rosstat_main/rosstat/ru/statistics/population/level
- http://www.ffoms.ru/system-oms/territorial-funds
