Research Article - Neuropsychiatry (2018) Volume 8, Issue 2
Different Patterns of Glucose Hypometabolism Underlie Functional Decline in Frontotemporal Dementia and Alzheimer’s Disease: FDG-PET Study
- *Corresponding Author:
- Tetsu Hirosawa
Department of Psychiatry and Neurobiology, Graduate School of Medical Science Kanazawa University, Kanazawa, Japan
Tel: +81-76-265-2304
Fax: +81-76-234-4254
Abstract
Abstract
Objective: Functional decline in daily life is a common difficulty among patients with dementia. Nevertheless, little is known about the neural correlates of functional decline. We hypothesized that functional impairment is associated with metabolic abnormalities in distinct regions in cases of Alzheimer’s disease (AD) and frontotemporal dementia (FTD).
Methods: After 49 patients with AD, 13 patients with FTD, and 21 normal participants underwent a [18F] fluorodeoxyglucose (FDG)-positron emission tomography scan, we evaluated the relations between functional decline measured using Functional Assessment Staging (FAST) and regional cerebral glucose metabolism from voxel-based analyses.
Keywords
Alzheimer’s disease; Frontotemporal dementia; [18F] Fluorodeoxyglucose-positron emission tomography scan, Functional decline
Introduction
Dementia, characterized by progressive impairment of cognition involving memory and at least one other cognitive domain (language, visuospatial, executive function) [1], reportedly affects 47 million people worldwide and costs an estimated 818 billion dollars annually [2]. Its high prevalence, progressive nature, and extensive requirements for care and social support all combine to make the disease a public health crisis.
Dementia can result from several diseases. In elderly patients (≥ 65 years old), Alzheimer disease (AD) is the most common cause of dementia [3], but in younger patients (< 65 years old), frontotemporal dementia (FTD) is also a common cause of dementia, occurring with similar frequency to that of AD [4]. Actually, AD is characterized by memory impairment, whereas FTD is characterized by prominent changes in social behavior and personality as well as aphasia accompanied by frontal and/or temporal lobe degeneration [5].
Regional brain glucose hypo-metabolism, known as a biomarker for dementia syndrome, can be measured using [18F]fluorodeoxyglucose ([18F] FDG) PET, which is regarded as a reliable tool for diagnosing dementia [6] because spatial patterns of brain glucose hypo-metabolism are specific for each type of dementia, reflecting underlying regional synaptic dysfunction [7]. Particularly, ([18F])FDG-PET is useful to differentiate AD from FTD: AD causes hypometabolism predominantly in posterior regions [8]. By contrast, FTD causes hypometabolism predominantly in anterior regions [9].
Functional impairment, another important aspect of dementia syndrome, can be more important than cognitive dysfunction itself because severe functional impairment directly engenders intensive need for care and support. Especially, it plays a key role in the assessment of FTD because, as described above, it is characterized by impairment in social function. Nevertheless, few studies have specifically examined functional impairment in FTD.
Although studies have been few, they have consistently demonstrated dementia’s devastating effects on functional capability. For example, Rosen et al. and Mioshi et al. have reported that functional impairment in FTD is more severe than that typically seen in cases of AD independent of cognitive dysfunction [10,11]. Furthermore, Rascovsky et al. reported that the progression of functional decline occurs more rapidly and more severely in patients with FTD than in patients with AD [12].
Despite the strong effects of functional disability on patients with FTD and their caregivers, its biological underpinnings have only rarely been addressed. Only two reports of the relevant literature describe studies investigating the neural correlates of functional disability in FTD. From one study, Chow et al. found correlation between thalamic atrophy and functional disability using structural MRI [13]. In the other study, Mioshi et al. demonstrated that specific frontal-thalamic areas are associated with activities of daily living (ADL) performance in FTD, although widespread cortical atrophy was found for AD, again, using structural magnetic resonance imaging (MRI) [14]. Nevertheless, by its nature, structural MRI cannot assess brain function. It evaluates cerebral atrophy, a nonspecific result of neuronal damage. Atrophy does not necessarily represent actual brain function [15].
This study was conducted to examine the association between the severity of functional disability and regional brain dysfunction assessed using [18F]FDG-PET. The important motivating hypothesis for this study is that functional impairment is associated with metabolic abnormalities in distinct regions in AD and FTD.
Method
▪ Participants
From Hamamatsu Medical Center, 83 elderly people were recruited, including 21 healthy controls, 49 patients diagnosed with AD, and 13 patients diagnosed with front-temporal dementia (FTD). The diagnosis of AD was based on criteria of the National Institute of Neurological and Communicative Disorders and Stroke – Alzheimer’s disease and Related Disorders Association (NINCDS/ADRDA) [16] and the Diagnostic and Statistical Manual of Mental Disorders – IV (DSM-IV) [1]. For diagnosis of FTD, the Lund and Manchester criteria were used [17]. The existence of schizophrenia, mood disorder, and anxiety disorder was ruled out. Of these patients, 13 were taking a stable dose of cholinesterase inhibitor medication. Functional disability was measured using FAST [18]. The Mini Mental State Examination (MMSE) was also applied for assessment [19].
The Ethics Committee of Hamamatsu Medical Center approved this study. Written informed consent was obtained from all participants before enrollment.
▪ MRI scanning
Because PET analysis examines the whole brain structure for each participant, all participants underwent three-dimensional MRI using a static magnet (0.3 T MRP7000AD; Hitachi Ltd., Tokyo, Japan) with the following acquisition parameters: three-dimensional mode sampling, repetition time (TR)/echo time (TE) (200/23), 75° flip angle, 2-mm slice thickness with no gap, and 256 × 256 matrices. The MRI measures and a mobile PET gantry allowed us to reconstruct PET images parallel to the intercommissural (ACPC) line without reslicing [20].
▪ PET scan and image data acquisition
PET imaging allowed us to visualize the glucose metabolism and amyloid deposition in the living human brain. All participants underwent PET measurement immediately after threedimensional MRI. We used a high-resolution brain PET scanner (SHR12000; Hamamatsu Photonics K.K., Hamamatsu, Japan) [21]. After head fixation using a thermoplastic face mask, we applied a 10-min transmission scan. Then, 40 serial PET scans (time frames: 12 × 10, 18 × 60, and 10 × 300 s) were performed for 70 min after injection of 5 MBq [11C]Pittsburgh compound B(PIB)/kg. Later, a static 15-min PET scan was performed 45 min after injection of 1.2 MBq/ kg dose of [18F]-FDG. To evaluate the glucose metabolism, a semiquantitative ratio index of [18F]-FDG was calculated as the standardized uptake value ratio (SUVR) [22]. The obtained [18F]-FDG SUVR parametric images were used for voxel-wise analyses. To assess amyloid deposition, binding potentials of [11C]-PIB were estimated as SUVR [23]. [11C]PIB-SUVR in the precuneus was quantified using the cerebellum as a reference (value of 1000 in the cerebellum).
▪ Statistical Analysis
Chi-square tests were used to analyze group differences in sex and the use of anticholineregic drugs. Because the age and education history were approximately normally distributed for each group, one-way ANOVA was applied to determine group differences with subsequent Turkey post hoc tests if necessary. However, the MMSE scores were at the ceiling; the FAST scores were at the floor in the healthy control group (HC). In addition, [11C]PIB-SUVR in the precuneus was not normally distributed. Therefore, we used a nonparametric approach. Kruskal–Wallis H test was applied to verify group differences, followed by Mann–Whitney U post hoc tests if needed. Statistical significance was inferred for < .05 for all analyses other than post hoc analysis. For post hoc analysis, statistical significance was inferred for < .016 after Bonferroni correction.
SPM8 was used for voxel-wise analysis. For the SPM analysis, because of the exploratory nature of this study, we chose whole-brain analysis rather than region of interest (ROI) analysis. All [18F]FDG-SUVR parametric images were first normalized to the MNI space and were smoothed with an isotropic Gaussian kernel of 8 mm. For AD participants together with HC participants (n = 70) and FTD participants together with HC participants (n = 34), correlation analyses were applied between results of the FAST scores and [18F]FDG-SUVR. Voxel-based correlations were computed using a regression model with the statistical threshold set at < .05 family wise error (FWE) corrected for peak height.
Results
▪ Participants
We found a significant difference between FAST scores obtained under different conditions (H(2) = 46.52, p = .001). Post-hoc analysis results indicate that the FAST scores were significantly higher for AD and FTD groups than for the HC group. Similarly, we found a significant difference between the MMSE scores obtained under different conditions (H(2) = 47.56, p = .001). Post-hoc analysis results indicate that the MMSE scores were significantly higher for AD and FTD than HC. In addition, the MMSE scores were significantly higher for AD group than for FTD. Results are presented in Table 1.
| Intergroup Comparison | |||||||
|---|---|---|---|---|---|---|---|
| HC | AD | FTD | p (H) values | HC vs. AD | HC vs. FTD | AD vs. FTD | |
| n | 21 | 49 | 13 | ||||
| Age | 67.9 (7.4) | 67.5 (8.5) | 63.9 (6.9) | 0.30* | |||
| Education | 10.8 (2.3) | 11.7 (2.4) | 11.2 (2.6) | 0.20* | |||
| Sex (Female/Male) | 13/8 | 28/21 | 6/7 | 0.66# | |||
| ChE-I | 0 | 10 | 3 | 0.07# | |||
| FAST | 1.0 (0.0) | 4.0 (1.0) | 3.9 (1.2) | < 0.05$ | <0.016& | <0.016& | 0.84& |
| MMSE | 28.9 (1.3) | 18.2 (5.1) | 21.8 (5.2) | < 0.05$ | <0.016& | <0.016& | <0.016& |
| 11C-PiB SUVRs | 1.35 (0.3) | 2.20 (0.3) | 1.27 (1.6) | < 0.05$ | <0.016& | 0.37& | <0.016& |
[11C]PiB-SUVR in the precuneus were provided as a ratio using the cerebellum as a reference. Values are given as mean (standard deviation).
* One-way ANOVA
# Chi-square test
$ Kruskal–Wallis H test
& Mann–Whitney U-test
HC, healthy controls; AD, Alzheimer disease; FTD, frontotemporal dementia; ChE-I, cholinesterase inhibitor; FAST, functional assessment staging; MMSE, mini mental state examination
Table 1: Characteristics of participants.
▪ Voxel-based correlations analysis between [18F]FDG-SUVR parametric images and FAST scores in AD and control participants (n =70)
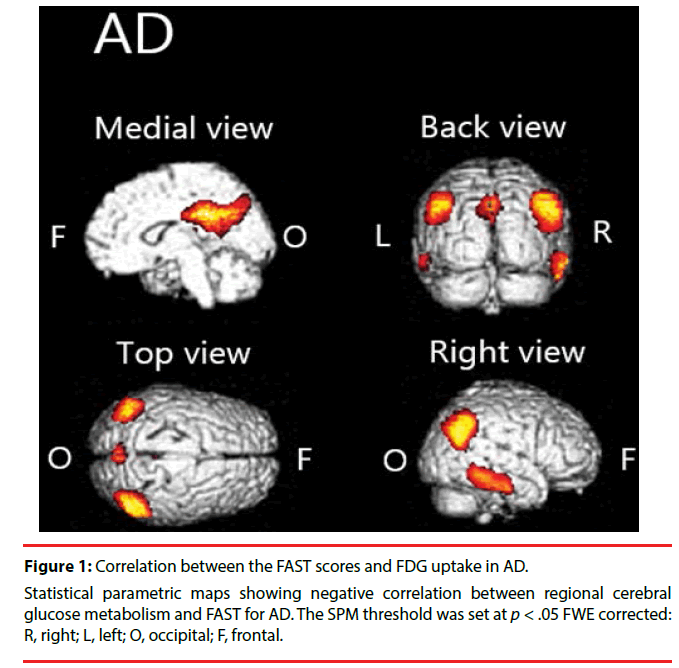
We found significant negative correlation between [18F] FDG-SUVR and FAST scores in the cingulate cortex, temporal cortex, and parietal cortex in AD (Figure 1, Table 2).
Figure 1: Correlation between the FAST scores and FDG uptake in AD.
Statistical parametric maps showing negative correlation between regional cerebral glucose metabolism and FAST for AD. The SPM threshold was set at p < .05 FWE corrected: R, right; L, left; O, occipital; F, frontal.
| Cluster size | x | y | z | Localization | Hemisphere | Z score |
|---|---|---|---|---|---|---|
| 3116 | 6 | -40 | 32 | cingulate gyrus | R | 10< |
| -2 | -40 | 36 | cingulate gyrus | L | 7.53 | |
| -2 | -54 | 28 | posterior cingulate | L | 7.06 | |
| 1401 | 60 | -38 | -20 | inferior temporal gyrus | R | 6.91 |
| 58 | -20 | -24 | sub-gyral | R | 6.14 | |
| 2115 | 50 | -60 | 46 | inferior parietal lobule | R | 6.77 |
| 50 | -66 | 38 | angular gyrus | R | 6.70 | |
| 44 | -74 | 42 | precuneus | R | 5.88 | |
| 1374 | -40 | -68 | 40 | angular gyrus | L | 5.89 |
| 203 | -56 | -44 | -12 | middle temporal gyrus | L | 5.18 |
| 19 | 38 | -32 | -14 | sub-gyral | R | 4.59 |
Cluster sizes and anatomical locations of peak voxels in each cluster were provided. Coordinates (x, y, z, in millimeters) refer to a MNI standard stereotactical space in SPM.
(threshold p < .05 FWE corrected) R, right; L, left
Table 2: Brain areas with negative correlation between regional cerebral glucose metabolism and FAST in AD.
▪ Voxel-based correlations between [18F] FDG-SUVR parametric images and FAST scores in FTD and control participants (n =34)
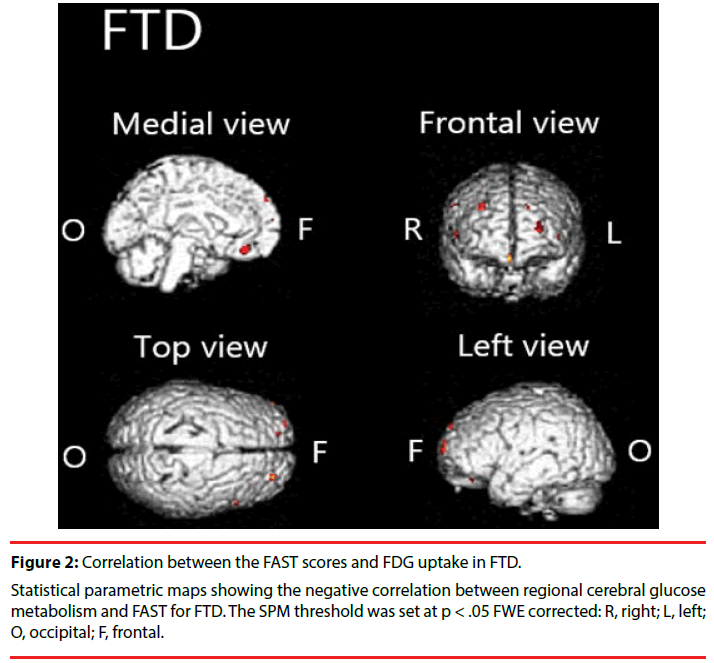
We found significant negative correlation between [18F]FDG-SUVR and the FAST scores in the frontal cortex, left anterior cingulate cortex and right claustrum in FTD (Figure 2, Table 3).
| Cluster size | x | y | z | Localization | Hemisphere | Z score |
|---|---|---|---|---|---|---|
| 24 | -24 | 66 | 14 | superior frontal gyrus | L | 4.90 |
| 7 | 58 | 20 | 40 | middle frontal gyrus | R | 4.84 |
| 9 | 54 | 46 | 10 | middle frontal gyrus | R | 4.82 |
| 15 | -2 | 38 | -16 | anterior cingulate | L | 4.75 |
| 6 | -14 | 58 | 38 | superior frontal gyrus | L | 4.67 |
| 4 | -44 | 54 | 6 | middle frontal gyrus | L | 4.56 |
| 7 | 34 | 18 | -10 | claustrum | R | 4.55 |
| 1 | -42 | 58 | 4 | middle frontal gyrus | L | 4.47 |
Cluster sizes and anatomical locations of peak voxels in each cluster were provided. Coordinates (x, y, z, in millimeters) refer to an MNI standard stereotactical space in SPM.
(threshold p < .05 FWE corrected) R, right; L, left
Table 3: Brain areas with negative correlation between regional cerebral glucose metabolism and FAST in FTD.
Discussion
We demonstrated that hypometabolism in disease-specific regions is related to functional impairment in patients with AD or FTD. Particularly in patients with AD, we found significant negative correlations between FAST scores and [18F]FDG uptake in the parietal cortex, temporal cortex, cingulate cortex, and precuneus. In patients with FTD, we found significant negative correlation in the frontal cortex, anterior cingulate cortex, and claustrum.
In patients with AD, we found negative correlation between FAST and [18F]FDG uptake over widely various regions. Specifically, the FAST scores are negatively correlated with [18F] FDG uptake in the parietal cortex, temporal cortex, cingulate cortex, and precuneus. This finding is largely congruent with those of earlier studies. For example, Salmon et al. found negative correlation between instrumental activities of daily living (IADL) score and brain metabolism in inferior parietal, inferior temporal, and superior occipital cortices in patients with AD [24]. Furthermore, lesions in the parietal area are known to cause Gerstmann syndrome: finger tap agnosia, alexia, acalculia, agraphia, and left– right confusion [25]. Of course, those symptoms interfere with everyday life activities. Similarly, cortical atrophy in the temporal area is known to be associated with apathy in individuals with mild cognitive impairment (MCI) [26]. Apathy is predictive of impaired everyday functioning in AD [27]. The precuneus is involved in various functions such as attention and memory [28], which are known to play crucially important roles in everyday functioning [29,30]. Focal damage to the posterior cingulate cortex is known to cause impaired spatial cognition [31]. It might directly engender functional decline. Taken together, for patients with AD, one can infer that diffuse pathologic changes in the brain might combine to impair their functional capability.
In patients with FTD, we found negative correlation between FAST and [18F]FDG uptake in a limited region (in the frontal cortex, anterior cingulated, and claustrum) compared to the AD group. Although it has been hypothesized that prominent functional decline in patients with FTD is a result of executive dysfunction resulting from frontal lobe damage [32-34], the biological underpinnings have not been studied sufficiently. This report is the first to describe a relation between frontal lobe dysfunction and functional decline in FTD. Results show negative correlations in the anterior cingulate and claustrum. It is particularly interesting that the Von Economo neurons (VENs), large bipolar neurons richly represented in these regions [35,36], are known to be specifically and highly degenerated in patients with FTD [37]. In addition, degeneration of VENs has been shown to be associated with impairment of self-awareness [37,38]. Given that regional brain hypometabolism reflects local synaptic dysfunction, a relation might be observed between the degeneration of VENs and functional decline via impairment of self-awareness (e.g., neglect of hygiene).
Our study has some limitations. First, although FAST is the most widely used instrument to measure functional decline, it was designed initially for AD studies, not for FTD studies. For that reason, the reliability of FAST for measuring functional decline in individuals with FTD is not known. Second, the FTD sample size was small.
Conclusion
Brain regions associated with functional decline are widespread in patients with AD and are selective in those with FTD. This difference presents some clinical implications because the underlying pathology is always considered when clinicians assess treatment options. For example, for FTD, because of the specific pathology of the functional decline, more specifically tailored interventions might work. In addition, this study provided new evidence supporting the hypothesis that the neuronal correlates of functional decline vary among types of dementia.
Competing Interests
The authors have no biomedical financial interest or potential conflict of interest.
Acknowledgments
Authors Mitsuru Kikuchi designed the study and wrote the protocol. Authors Mitsuru Kikuchi and Yoshio Minabe conducted general supervision of the research. Authors Tatsuru Kitamura and Yasuomi Ouchi revised the manuscript and advised the authors on statistical methods and writing manuscript. Authors Tetsu Hirosawa, Mina Fukai, and Shoryoku Hino performed statistical analyses. Authors Masamichi Yokokura, Etsuji Yoshikawa, and Tomoyasu Bunai performed brain imaging. Author Mina Fukai wrote the first draft of the manuscript. All authors contributed to and approved the final manuscript
This research is supported by the Center of Innovation Program from Japan Science and Technology Agency, JST.
References
- American Psychiatric Association, Functions of the Committee on industrial psychiatry. Ind. Med. Surg20(2), 67-68 (1951).
- Livingston G, Sommerlad A, Orgeta V, et al. Dementia prevention, intervention, and care. Lancet (2017).
- Ballard C, Gauthier S, Corbett A, et al. Alzheimer’s disease. Lancet 377(9770), 1019-1031 (2011).
- Mercy L, Hodges JR, Dawson K, et al. Incidence of early onset dementias in Cambridgeshire, United Kingdom. Neurology 71(19), 1496-1499 (2008).
- Rascovsky K, Hodges JR, Knopman D, et al. Sensitivity of revised diagnostic criteria for the behavioural variant of frontotemporal dementia. Brain 134(Pt 9), 2456-2477 (2011).
- Jack CR, Jr., Albert MS, Knopman DS, et al. Introduction to the recommendations from the National Institute on Aging-Alzheimer's Association workgroups on diagnostic guidelines for Alzheimer’s disease. Alzheimers. Dement7(3), 257-262 (2011).
- Shivamurthy VK, Tahari AK, Marcus C, Subramaniam RM. Brain FDG PET and the diagnosis of dementia. Am. J. Roentgenol204(1), W76-85 (2015).
- Minoshima S, Giordani B, Berent S, et al. Metabolic reduction in the posterior cingulate cortex in very early Alzheimer’s disease. Ann. Neurol42(1), 85-94 (1997).
- Ishii K, Sakamoto S, Sasaki M, et al. Cerebral glucose metabolism in patients with frontotemporal dementia. J. Nucl. Med 39(11), 1875-1878 (1998).
- Mioshi E, Hodges JR. Rate of change of functional abilities in frontotemporal dementia. Dement. Geriatr. Cogn. Disord. 28(5), 419-426 (2009).
- Rosen HJ, Narvaez JM, Hallam B, et al. Neuropsychological and functional measures of severity in Alzheimer disease, frontotemporal dementia, and semantic dementia. Alzheimer. Dis. Assoc. Disord. 18(4), 202-207 (2004).
- Rascovsky K, Salmon DP, Lipton AM, et al. Rate of progression differs in frontotemporal dementia and Alzheimer disease. Neurology 65(3), 397-403 (2005).
- Chow TW, Izenberg A, Binns MA, et al. Magnetic resonance imaging in frontotemporal dementia shows subcortical atrophy. Dement. Geriatr. Cogn. Disord26(1), 79-88 (2008).
- Mioshi E, Hodges JR, Hornberger M. Neural correlates of activities of daily living in frontotemporal dementia. J. Geriatr. Psychiatry Neurol 26(1), 51-57 (2013).
- Johnson KA, Fox NC, Sperling RA, et al. Brain imaging in Alzheimer disease. Cold. Spring. Harb. Perspect. Med 2(4), a006213 (2012).
- McKhann G, Drachman D, Folstein M, et al. Clinical diagnosis of Alzheimer’s disease: report of the NINCDS-ADRDA Work Group under the auspices of Department of Health and Human Services Task Force on Alzheimer’s disease. Neurology 34(7), 939-944 (1984).
- Neary D, Snowden JS, Gustafson L, et al. Frontotemporal lobar degeneration: a consensus on clinical diagnostic criteria. Neurology 51(6), 1546-1554 (1998).
- Reisberg B. Functional assessment staging (FAST). Psychopharmacol. Bull24(4), 653-659 (1988).
- Folstein MF, Folstein SE, McHugh PR. "Mini-mental state". A practical method for grading the cognitive state of patients for the clinician. J. Psychiatr. Res 12(3), 189-198 (1975).
- Ouchi Y, Okada H, Yoshikawa E, et al. Absolute changes in regional cerebral blood flow in association with upright posture in humans: an orthostatic PET study. J. Nucl. Med 42(5), 707-712 (2001).
- Ouchi Y, Yoshikawa E, Okada H, et al. Alterations in binding site density of dopamine transporter in the striatum, orbitofrontal cortex, and amygdala in early Parkinson’s disease: compartment analysis for beta-CFT binding with positron emission tomography. Ann. Neurol. 45(5), 601-610 (1999).
- Ouchi Y, Yoshikawa E, Futatsubashi M, Yagi S, U`eki T, Nakamura K. Altered brain serotonin transporter and associated glucose metabolism in Alzheimer disease. J. Nucl. Med. 50(8), 1260-1266 (2009).
- Yokokura M, Mori N, Yagi S, et al. In vivo changes in microglial activation and amyloid deposits in brain regions with hypometabolism in Alzheimer’s disease. Eur. J. Nucl. Med. Mol. Imaging 38(2), 343-51 (2011).
- Salmon E, Lespagnard S, Marique P, et al. Cerebral metabolic correlates of four dementia scales in Alzheimer’s disease. J. Neurol 252(3), 283-290 (2005).
- Mayer E, Martory MD, Pegna AJ, et al. A pure case of Gerstmann syndrome with a subangular lesion. Brain 122(Pt 6), 1107-1120 (1999).
- Guercio BJ, Donovan NJ, Ward A, et al. Apathy is associated with lower inferior temporal cortical thickness in mild cognitive impairment and normal elderly individuals. J. Neuropsychiatry. Clin.Neurosci27(1), e22-27 (2015).
- Boyle PA, Malloy PF, Salloway S, et al. Executive dysfunction and apathy predict functional impairment in Alzheimer disease. Am. J. Geriatr. Psychiatry 11(2), 214-221 (2003).
- Laureys S, Antoine S, Boly M, et al. Brain function in the vegetative state. Acta. Neurol. Belg. 102(4), 177-185 (2002).
- Brown PJ, Devanand DP, Liu X, et al. Alzheimer’s disease Neuroimaging I. Functional impairment in elderly patients with mild cognitive impairment and mild Alzheimer disease. Arch. Gen. Psychiatry 68(6), 617-626 (2011).
- Stoeckel LE, Stewart CC, Griffith HR, et al. MRI volume of the medial frontal cortex predicts financial capacity in patients with mild Alzheimer’s disease. Brain. Imaging. Behav7(3), 282-292 (2013).
- Takahashi N, Kawamura M, Shiota J, et al. Pure topographic disorientation due to right retrosplenial lesion. Neurology 49(2), 464-469 (1997).
- Josephs KA, Whitwell JL, Weigand SD, et al. Predicting functional decline in behavioural variant frontotemporal dementia. Brain 134(Pt 2), 432-448 (2011).
- Mioshi E, Kipps CM, Hodges JR. Activities of daily living in behavioral variant frontotemporal dementia: differences in caregiver and performance-based assessments. Alzheimer. Dis. Assoc. Disord23(1), 70-76 (2009).
- Moheb N, Mendez MF, Kremen SA, et al. Executive Dysfunction and Behavioral Symptoms Are Associated with Deficits in Instrumental Activities of Daily Living in Frontotemporal Dementia. Dement. Geriatr. Cogn. Disord 43(1-2), 89-99 (2017).
- Nimchinsky EA, Vogt BA, Morrison JH, et al. Spindle neurons of the human anterior cingulate cortex. J. Comp. Neurol 355(1), 27-37 (1995).
- Williamson P. Are anticorrelated networks in the brain relevant to schizophrenia? Schizophr. Bull. 33(4), 994-1003 (2007).
- Seeley WW, Carlin DA, Allman JM, et al. Early frontotemporal dementia targets neurons unique to apes and humans. Ann. Neurol 60(6), 660-667 (2006).
- Cauda F, Geminiani GC, Vercelli A. Evolutionary appearance of von Economo's neurons in the mammalian cerebral cortex. Front. Hum. Neurosci. 8(1), 104 (2014).
