Research Article - Imaging in Medicine (2018) Volume 10, Issue 5
The Role Of ARFI And APRI In Diagnosis Of Liver Fibrosis On Patients With Common Chronic Liver Diseases
Tran Thi Khanh Tuong†1 & Nguyen Minh Duc*†21Department of Internal Medicine, Pham Ngoc Thach University of Medicine, Ho Chi Minh City, Vietnam
2Department of Radiology, Pham Ngoc Thach University of Medicine, Ho Chi Minh City, Vietnam
†These authors are contributed equally.
- Corresponding Author:
- Nguyen Minh Duc
2Department of Radiology
Pham Ngoc Thach University of Medicine, Ho Chi Minh City
Vietnam
E-mail: bsnguyenminhduc@pnt.edu.vn
Abstract
Objective: This study aimed to investigate the value of liver fibrosis assessment by ARFI and APRI on patients with common chronic liver diseases.
Materials and methods: There were 119 patients with chronic hepatitis B and/or C, alcoholic liver disease and non-alcoholic steatohepatitis in this prospective study. All of the patients underwent a liver biopsy for histopathological assessment of liver fibrosis, ARFI and APRI calculation. The results of ARFI and APRI were compared to the histological fibrosis degree.
Results: Histopathology of liver fibrosis was evaluated by Metavir score: F0: 9 cases, F1: 57 cases, F2: 23 cases, F3: 19 cases and F4: 11 cases. Shear wave velocity (SWV) significantly correlated with the fibrosis stage (Spearman rho: 0.69, p<0.0001). The area under the ROC curves (AUROCs) for diagnosis of ≥ F2 and ≥ F3 were 0.86 (95% CI: 0.79-0.93) and 0.88 (95% CI: 0.80-0.96), respectively. The cut-off values of SWV for ≥ F2 and ≥ F3 were 1.29 m/s (Se 79.25%, Sp 89.36%, PPV 85.7% and NPV 84.3%) and ≥ 1.36 m/s (Se 96.67%, Sp 86.52%, PPV 70.7%, NPV 98.7%), respectively. APRI significantly correlated with the fibrosis stage (Spearman rho: 0.35, p < 0.0001). AUROCs for diagnosis of ≥ F2 and ≥ F3 were 0.7 (95% CI: 0.56-0.79) and 0.7 (95% CI: 0.85-0.81), respectively. The cut-off values of APRI for diagnosis of ≥ F2 and ≥ F3 were ≥ 0.569 (Se 50.94%, Sp 88.33%, PPV 71.1% and NPV 67.9%) and ≥ 1.163 (Se 40%, Sp 96.63%, PPV 80%, NPV 82.7%), respectively.
Conclusions: This study manifested the role of ARFI and APRI as efficacious methods for assessing liver fibrosis on patients with common chronic liver diseases. Increasing SWV and APRI correlates with higher degree of liver fibrosis. ARFI was significantly better than APRI in evaluating the degree of liver fibrosis.
Keywords
liver fibrosis ■ liver stiffness ■ chronic hepatic disease ■ acoustic radiation force impulse imaging (ARFI) ■ aspartate aminotransferase to platelet ratio index (APRI)
Introduction
Prevalence of chronic liver disease is increasingly elevated all over the world not only in Europe but also in Asia due to the growing prevalence of Non-Alcoholic Fatty Liver Disease (NAFLD), whereas the prevalence of alcoholic chronic liver disease and HBV, HCV infection have been worsened in Asia [1]. Prevalence of HCV is rather high in Vietnam, up to 6.1%; further, Vietnam is also in the epidemic area of HBV [2]. Besides, the elevation of diabetes, obesity and metabolic syndrome in the Asian Pacific region results in raising prevalence of NAFLD [3].
Most of chronic liver diseases will induce liver fibrosis and eventually cirrhosis and/or liver cancer. In practice, the degree of liver fibrosis is an important factor that affects the treatment and prognosis of patients with chronic hepatitis. Until now, liver biopsy is still regarded as the gold standard of liver fibrosis. Nonetheless, this invasive method is not suitable for continuous observation of liver fibrosis. At present, there are two kinds of commonly non-invasive measurements for detecting liver fibrosis: acoustic radiation force impulse (ARFI) and the AST/PLT (aspartate aminotransferase/platelet) ratio index (APRI). Among these tests, APRI is the most simple calculation formula but shows effective performance based on serum platelet and AST level [4,5]. Meanwhile, ARFI evaluates liver stiffness non-invasively, from which shear wave velocity (SWV) was measured. In the article, we aimed to investigate the role of ARFI and APRI in the diagnosis of liver fibrosis on patients with common chronic liver disease correlation with histopathology.
Materials and Methods
Institutional review board approved this prospective study. There were 119 patients (mean age: 47.24 ± 13.38 and mean BMI: 23.72 ± 2.75) with chronic hepatitis B and/ or C, alcoholic liver disease and non-alcoholic steatohepatitis undergone a liver biopsy for histopathological assessment of liver fibrosis, ARFI and APRI calculation.
Inclusion criteria: Patients older than 18 y olds were diagnosed by chronic liver disease due to one or more than one of the 4 following causes: HBV, HCV, alcoholic liver disease and NAFLD at gastroenterology department, People’s Hospital 115. The detailed definitions of these diseases were displayed elsewhere [6,7].
Exclusion criteria: Patients did not agree to participate in this study; patients did not agree to experience liver biopsy; patients had contraindication with liver biopsy; acute exacerbation of chronic liver disease with ALT and AST level elevated 10 times more than normal range; another cause of chronic liver disease out of the four mentioned causes; biopsy sample contained <6 portal spaces; successful number of SWV recorded <10 times; and IQR/ med was <30% [8]. Liver biopsy was performed under the guidance of Siemens ACUSON S2000 ultrasound machine. APRI formula was introduced in a study done by Wai et al. [5]:
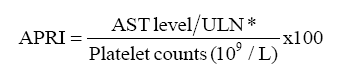
We used automatic machine gun called Bard with the depth of 22 mm and needle diameter of 1.8 mm for biopsy purpose. Liver tissues were stained by Hematoxylin and eosin (HE), Periodic Acid–Schiff (PAS) and Trichrome (FIGURE 1). Tissue sample was analyzed by 18 y experience histo-pathologist.

Continuous variables were expressed as mean values and standard deviation. The correlation of two continuous variables was carried out by Spearman correlation rho. ROC analysis manifested sensitivity, specificity, PPV v/s NPV according to the best SWV cut-off value. A two-sided p values less than 0.05 (p<0.05) was defined as the level of significance. Statistical analysis was performed using STATA-12 software.
Results
■ Baseline characteristics
Causes of chronic liver disease were 57 cases of NAFLD (47.9%), 40 cases of HBV (33.62%) and/or HCV and 22 cases of alcoholic liver disease (18.49%). Liver biopsy was performed in 119/127 cases with successful rate is 93.7% (8 cases were excluded due to number of portal spaces <6). Average portal space: 7.11 ± 2.05 (6- 16). According to Metavir score, n (%) of F0, F1, F2, F3, and F4 degree of liver fibrosis were 9 (7.56%); 57 (4.9%); 23 (19.33%); 19 (15.97%) and 11 (9.24%); respectively FIGURES 2, 3 and TABLES 1, 2.

Figure 2: (A) F1 liver fibrosis with SWV of 1.32 m/s; (B) HE; (C) PAS; (D) Trichrome.

Figure 3: (A) F4 liver fibrosis with SWV of 1.55 m/s; (B) HE; (C) PAS; (D) Trichrome.
| Test | Mean | Sd | Spearman rho |
|---|---|---|---|
| Hb (g/dl) | 13,65 | 1,92 | NA |
| Leucocyte(106 /L) | 7.545 | 2.025 | NA |
| Platelet (109 /L) | 249.03 | 100.76 | -0,39* |
| Glycemia (mg/dl) | 108.89 | 57.21 | NA |
| Cholesterol (mg/dl) | 202.48 | 51.70 | NA |
| HDLc (mg/dl) | 41.74 | 12.19 | NA |
| LDLc (mg/dl) | 123.32 | 34.05 | NA |
| Triglyceride (mg/dl) | 196.89 | 149.29 | NA |
| AST (U/l) | 59.75 | 40.42 | 0,2* |
| ALT (U/l) | 50.29 | 37.71 | -0,15 |
| ALP (U/l) | 80.53 | 45.31 | NA |
| GGT (U/l) | 165.48 | 286.78 | NA |
| Bilirubin (mg/dl) | 0.88 | 0.65 | 0,13 |
| INR | 0.99 | 0.08 | 0,22* |
| Albumin (g/dl) | 4.26 | 0.62 | - 0,19* |
| APRI | 0.59 | 0.51 | 0.35* |
| SWV (m/s) | 1.41 | 0.54 | 0.69* |
| * Statistically significant (p<0.05; Spearman correlation test) | |||
Table 1: Correlation between tests and degree of liver fibrosis.
| Degree of fibrosis | Cut-off | Sensitivity | Specificity | PPV | NPV | AUC | |
|---|---|---|---|---|---|---|---|
| APRI | Significant (F ≥ 2) | 0.569 | 50.94 | 83.33 | 71.1 | 67.9 | 0.7 |
| Severe (F ≥ 3) | 1.163 | 40.0 | 96.63 | 80.0 | 82.7 | 0.7 | |
| ARFI | Significant (F ≥ 2) | 1.29 | 79.25 | 89.73 | 85.7 | 84.3 | 0.86 |
| Severe (F ≥ 3) | 1.36 | 96.67 | 86.52 | 70.7 | 98.7 | 0.93 |
Table 2: Role of APRI, ARFI in the degree diagnosis of liver fibrosis.
Discussion
Successful rate of ARFI in this study was 100%. ARFI was an advantage technique in comparison with transient elastography via Fibroscan machine since Fibroscan could not be carried out in patients with ascite and narrow intercostal spaces. In this study, SWV had significant correlation with degree of liver fibrosis (rho=0.63; p<0.05). SWV increased in concordance with worsened level of liver fibrosis according to Metavir score which was fully in agreement with previous studies [9]. In addition, we also observed significant correlation between APRI and degree of liver fibrosis on histopathology (rho=0.35; p<0.05). In a study by Li et al. on chronic HCV patients, the results showed significant correlation between APRI and live fibrosis stage (rho=0.478; p<0.001). Thus, our results were in line with this study [10].
In this study, AUROC of ARFI was higher than that of APRI in diagnosis of significant liver fibrosis (0.86 v/s 0.7) and severe liver fibrosis (0.93 v/s 0.7) (FIGURES 4 and 5). There are currently some non-invasive methods in liver fibrosis assessment composed of Fibroscan and ARFI. When compared Fibroscan with ARFI, Bota et al. confirmed that there was no significant difference between two methods [11]. Our cut-off values for significant and severe fibrosis were 1.29 and 1.36, respectively, lower than that cut-off values in a study by Friedrich-Rust et al. (1.34 for F ≥ 2 and 1.55 for F ≥ 3) [12] and Nierhoff et al. (1.35 for F ≥ 2 and 1.61 for F ≥ 3) [13]. Furthermore, in a study by Tachi et al. on only 176 hepatitis C patients, the results manifested that the decline in mean SWV of 1.60 ± 0.63 m/s is related to moderate or severe inflammation of the liver [14]. Our findings different from these studies might be due to a lower rate of severe liver fibrosis in our population in comparison with those in the studies by Friedrich-Rust et al. and Nierhoff et al. In addition, in this present study, the population was comprised of chronic hepatitis B and/or C, alcoholic liver disease and non-alcoholic steatohepatitis; therefore, the mean SWV was significantly different to Tachi et al. findings. In another study by Tachi et al. on 336 hepatitis C patients, the findings showed that the optimum cut-off SWV for F ≥ 2 and F ≥ 3 was 1.26 m/s and 1.31 m/s, respectively. Our results were consistent with these results [15].

Figure 4: ROC curve for diagnosis of significant liver fibrosis (F ≥ 2).

Figure 5: ROC curve for diagnosis of severe liver fibrosis (F ≥ 3).
In Vietnam, there were 3 centers facilitated ARFI in assessment of liver fibrosis. Nevertheless, each center utilized different reference values of SWV in classifying liver fibrosis stages (FIGURE 6). Ho Chi Minh Medic Center applied cut-off values calculated from another previous study [16]. Hue Medic Center and Ho Chi Minh university medical center used cut-off values retrieved from a research by Sporea el al. [17]. In comparison with the study from Ho Chi Minh Medic Center, our reference values for diagnosis of F2 and F3 were fully consistent.

Figure 6: Reference values of SWV for classification of liver fibrosis in Vietnam.
There are some limitations in this present study. Firstly, the population was not very large. Secondly, we admit that reversibility of fibrosis is crucial in patient with liver cirrhosis. Finally, prospective large scale data and longterm follow-up studies are essential to evaluate the clinical course after treatment. A continuous surveillance of population with persisting histological necro-inflammatory activity is still crucial in further studies.
Conclusion
This study manifested the role of ARFI and APRI as efficacious methods for assessing liver fibrosis on patients with chronic hepatitis. Increasing SWV and APRI correlates with higher degree of liver fibrosis. ARFI was significantly better than APRI in evaluating the degree of liver fibrosis.
Disclosure Statement
Tran Thi Khanh Tuong and Nguyen Minh Duc contributed equally to this article. All authors read and approved manuscript. The authors of this manuscript declare no conflict of interest.
References
- Blachier M, Leleu H, Peck-Radosavljevic M et al. The burden of liver disease in Europe: a review of available epidemiological data. J. Hepatol. 58: 593-608, (2013).
- Nguyen LH, Nguyen MH. Systematic review: Asian patients with chronic hepatitis C infection. Aliment. Pharmacol. Ther. 37: 921-936, (2013).
- Amarapurkar DN, Hashimoto E, Lesmana LA et al. How common is non-alcoholic fatty liver disease in the Asia-Pacific region and are there local differences?. J. Gastroenterol. Hepatol. 22: 788-793, (2007).
- Chou R, Wasson N. Blood tests to diagnose fibrosis or cirrhosis in patients with chronic hepatitis C virus infection: a systematic review. Ann. Intern. Med. 158: 807-20, (2013).
- Wai CT, Greenson JK, Fontana RJ et al. A simple noninvasive index can predict both significant fibrosis and cirrhosis in patients with chronic hepatitis C. Hepatology. 38: 518-26, (2003).
- Chalasani N, Younossi Z, Lavine JE, et al. The Diagnosis and Management of Non-Alcoholic Fatty Liver Disease: Practice Guideline by the American Association for the Study of Liver Diseases, American College of Gastroenterology, and the American Gastroenterological Association. Hepatology. 55: 2005-23 (2012).
- European Association for the Study of Liver. EASL Clinical Practical Guidelines: Management of Alcoholic Liver Disease. J. Hepatol. 57: 399-420, (2012).
- Bota S, Sporea I, Sirli R et al. Factors associated with the impossibility to obtain reliable liver stiffness measurements by means of Acoustic Radiation Force Impulse (ARFI) elastography-analysis of a cohort of 1,031 subjects. Eur. J. Radiol. 83: 268-272, (2014).
- Goertz RS, Sturm J, Pfeifer L et al. ARFI cut-off values and significance of standard deviation for liver fibrosis staging in patients with chronic liver disease. Ann. Hepatol. 12: 935-941, (2013).
- Li SM, Li GX, Fu DM et al. Liver fibrosis evaluation by ARFI and APRI in chronic hepatitis C. World. J. Gastroenterol. 20: 9528-9533, (2014).
- Bota S, Herkner H, Sporea I et al. Meta-analysis: ARFI elastography versus transient elastography for the evaluation of liver fibrosis. Liver. Int. 33: 1138-1147, (2013).
- Friedrich-Rust M, Nierhoff J, Lupsor M et al. Performance of Acoustic Radiation Force Impulse imaging for the staging of liver fibrosis: A pooled meta-analysis. J. Viral. Hepat. 19: 212-219, (2012).
- Nierhoff J, Chávez Ortiz AA, Herrmann E et al. The efficiency of acoustic radiation force impulse imaging for the staging of liver fibrosis: a meta-analysis. Eur. Radiol. 23: 3040-3053, (2013).
- Tachi Y, Hirai T, Kojima Y et al. Liver stiffness reduction correlates with histological characteristics of hepatitis C patients with sustained virological response. Liver. Int. 38: 59-67, (2018).
- Tachi Y, Hirai T, Kojima Y et al. Liver stiffness measurement using acoustic radiation force impulse elastography in hepatitis C virus-infected patients with a sustained virological response. Aliment. Pharmacol. Ther. 44: 346-55, (2016).
- Le L. Comparison of liver stiffness values by Virtual Touch ARFI and Fibroscan TE in Large Sample Study of 554 Cases. Eur. Radiol. 23: 1-14, (2013).
- Sporea I, Sirli R, Popescu A et al. Acoustic Radiation Force Impulse (ARFI) - A new modality for the evaluation of liver fibrosis. Med. Ultrason. 12: 26-31, (2010).


