Research Article - Diabetes Management (2018) Volume 8, Issue 4
Short-term efficacy of incretin-related drugs among Asian patients monitored by glucose area under the curve calculated without blood sampling
- *Corresponding Author:
- Keisuke Kosugi
Kosugi Medical Clinic
Osaka, Japan
E-mail: info@kosugi-naika.com
Abstract
Objectives: To maximize the benefit of diabetes treatment, appropriate monitoring of the effect and modification of therapy plan is crucial. Among existing indices, only few are known to be suitable for the evaluation of short-term drug efficacy, such as on a weekly basis. In this paper, a novel, minimally invasive system of measuring glucose area under the curve (AUC) using minimally invasive interstitial fluid extraction technology (MIET) was evaluated for realization of the effective 1-week treatment using incretin-related drugs.
Materials and Methods: Twenty inpatients with type 2 diabetes were administered a 75 g oral glucose tolerance test (OGTT). Incretin-related drugs (one of the followings; Exenatide, Liraglutide, Alogliptin, or Lixisenatide) were administered for the following 4-7 days, followed by another OGTT to evaluate response. Plasma glucose (PG) levels were measured every 30 min for 2 h to calculate reference AUC. Interstitial fluid glucose AUC was simultaneously measured using MIET.
Results: A significant correlation among AUCs predicted by MIET (IG-AUC) and the reference AUCs calculated using PG levels (PG-AUC) were observed both before and after medication (r=0.89). Both IG-AUC and PG-AUC were significantly reduced by medication, and peak glucose levels were significantly correlated with IG-AUC regardless of peak time (r=0.87).
Conclusions: There was a clear benefit of one week treatment of incretins for glycemic control. The efficacy of medication reflected by glucose AUC can be evaluated by MIET. Therefore, MIET could contribute to the optimization of therapy by monitoring short-term changes in glucose tolerance without blood sampling.
Keywords
glucose area under the curve, drug efficacy, short-term monitoring, minimally invasive, interstitial fluid, incretin-related drugs
Introduction
The number of type 2 diabetes patients is increasing worldwide [1] and suitable treatment should be identified in each case considering both the patients’ quality of life (QOL) and the economic burden. Evidence of differences in the development of diabetes has also been increasing.
For example, insulin secretory defect appears more important in Asian than in Caucasian patients [2-4]. To effectively treat patients with different states of glucose intolerance, multiple drug choices and evaluation methods are essential. During this decade, new classes of drugs get to be widely used, such as glucagon like peptide-1 (GLP-1) analogues, dipeptidyl peptidase-4 (DPP-4) inhibitors, and sodium glucose co-transporter 2 (SGLT2) inhibitors. Although treatment options have been increased, still only few indices are available to validate short-term effectiveness of such new medications. Glycosylated hemoglobin (HbA1c) is widely used but is unsuitable for differentiating short-term effectiveness because it reflects average glucose levels over 2-3 months. The oral glucose tolerance test (OGTT) and self-monitoring blood glucose (SMBG) can be used to measure postprandial glucose excursion. However, both require multiple blood sampling, which may be painful and stressful for both patients and clinicians. Simple, less invasive assays for the evaluation of medication efficacy would be useful. Glucose AUC reflects postprandial glucose fluctuation and can be a suitable index for the short-term monitoring of drug effectiveness [5,6]. We have developed a glucose area under the curve (AUC) monitoring system using minimally invasive interstitial fluid extraction technology (MIET), and have reported the accuracy of AUC measurement using MIET [7-9] and its use to screening for glucose intolerance [10,11]. Our MIET system measures glucose AUC without blood sampling, which potentially contribute to the convenient monitoring [7,8,10]. In this study, we investigated the usefulness of MIET to evaluate the short-term efficacy of incretinrelated agents. Glucose tolerance was evaluated simultaneously using reference glucose AUC and MIET, before and after administration of incretin-related drugs for approximately 1 week.
Materials and Methods
▪ Subjects
Twenty inpatients with type 2 diabetes were enrolled and their clinical characteristics are shown in Table 1. The study was performed in accordance with the latest version of the ethical principles of the latest version of Declaration of Helsinki. The ethics committee of Osaka Police Hospital, Osaka, Japan approved the study protocol, and all participants gave their written informed consent.
| Gender (M/F) | 15/5 |
| Age (years) | 55.05 ± 12.59 |
| HbA1c (%) | 9.81 ± 2.07 |
| Medications | |
| Exenatide | 13 |
| Liraglutide | 4 |
| Lixisenatide | 1 |
| Alogliptin | 1 |
| IRI during 1st OGTT (mU/mL) | |
| 0 min | 5.87 ± 3.97 |
| 30 min | 18.63 ± 12.58 |
| 60 min | 32.85 ± 29.02 |
| 90 min | 30.92 ± 23.16 |
| 120 min | 35.98 ± 26.66 |
| IRI during 2nd OGTT (mU/mL) | |
| 0 min | 9.48 ± 5.01 |
| 30 min | 35.28 ± 27.66 |
| 60 min | 55.76 ± 34.66 |
| 90 min | 62.14 ± 42.94 |
| 120 min | 53.06 ± 39.98 |
Table 1. Clinical characteristics of the study subjects. Values are presented as mean ± standard deviation or number.
▪ Clinical evaluation protocol
Participants underwent 75 g OGTT after 1 week of intensive insulin therapy for removal of glucotoxicity. An incretin-related drug (one of the followings; Exenatide (Byetta®, Astrazeneca, UK) 5 μg × 2/day, Liraglutide (Victoza®, Novo Nordisk, Denmark) 0.9 mg/day, Alogliptin (Nesina®, Takeda Pharmaceutical, Japan) 25 mg/ day, or Lixisenatide (Lyxumia®, Sanofi, France) 20 μg/day) was administered subsequently for 4-7 days, followed by another OGTT to evaluate response. Immediately following each OGTT, participants completed a questionnaire on MIET. After glucose loading (TRELAN®-G75; Ajinomoto Pharma, Japan), plasma glucose (PG) levels were measured every 30 min for 2 h to calculate PG-AUC. Interstitial fluid glucose AUC (IG-AUC) was measured using MIET simultaneously with the OGTT. For MIET measurements, collection sites were wiped with an antiseptic; microneedle arrays were then stamped at two sites using a microneedle applicator, and two hydrogel patches were placed at each pretreated area. One patch absorbed interstitial fluid (ISF); the other monitored sweat levels. Before the final PG level measurement, the hydrogel patches were collected to analyze ISF composition. Venous blood samples were collected for measurement of PG and insulin levels. PG, insulin and HbA1c levels were measured using a conventional clinical laboratory system that was routinely calibrated.
▪MIET apparatus and materials
Details of the MIET apparatus have been previously described [10,12]. Briefly, polycarbonate microneedle arrays and an applicator for stamping were used for pretreatment to enhance ISF extraction. Patches with a polyvinyl alcohol hydrogel and adhesive tape were used for ISF collection at the pretreated area. The reagents for glucose analysis were glucose oxidase (GOD), mutarotase, peroxidase, ascorbic acid oxidase, and fluorescent dye (Amplex Red).
▪ Procedures for glucose and sodium ion analysis
A detailed description of the procedures for obtaining glucose and sodium ion levels collected in hydrogels has been previously described [7- 9]. Briefly, hydrogels were separated from the adhesive tape and immersed in distilled water to extract glucose and sodium. Glucose level was measured using the GOD method, and sodium ion level was measured with an ion-selective electrode.
▪ Data analysis
Reference PG-AUCs were calculated by trapezoidal approximation of glucose levels measured every 30 min. PG at x min was termed as Glu (x), and the 2-h reference PG-AUC was calculated as follows:
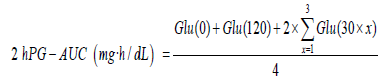
Details of the methods used for data analysis and calculating IG-AUC have been previously described [7,9].
Results
▪ AUC measurement by MIET
Each of the 20 participants was assayed twice, i.e., before and after the administration of the incretin-related drug with two samples in each assay for a total of 80 expected samples. However, two samples were excluded from the analysis because the OGTT was canceled in one participant following withdrawal of the drug. One of the remaining 78 samples was excluded because adhesion between skin and hydrogel patch was disturbed. Four additional samples with MIET errors (Na+ sweat/Na+ ISF >0.95) indicating sweat contamination deteriorated MIET performance were excluded. A total of 73 samples (93.6%) were analyzed. The accuracy of AUC measurement by MIET is shown in Figure 1 as the correlation between PG-AUC and IG-AUC. IG-AUC was significantly correlated with PG-AUC both before and after incretin-related therapy (r=0.89). The reproducibility, or coefficient of variation (CV) between two MIET values in each measurement was 4.5%.

Figure 1. The performance of AUC measurement. Correlation of IG-AUC and PG-AUC values. The best-fitting (thick), y=x (thin) and y=x ± 20% (dashed) lines are shown.
▪ Change of plasma glucose and AUC by medication
To understand the whole glucose excursion, we compared glucose AUC during the OGTTs before and after medication. To estimate the effectiveness of medication, post-challenge glucose excursion was the major factor to be evaluated. We also investigated the possible use of IG-AUC to estimate the efficacy of the medications. As shown in Figure 2A and 2B, the medications significantly improved plasma glucose at each measurement during the OGTT excepting for 0 min. This was reflected by significant improvement of the PG-AUC. IG-AUC measured by MIET also reflected the effect of medication. Consistent with the improvement in plasma glucose levels, peak glucose concentration occurred earlier after medication than before (Figure 2C). Moreover, the degree of improvement shown by the IG-AUC was significantly correlated with that shown by the PG-AUC (Figure 3A and 3B).

Figure 2. Change of blood glucose and AUC by medication. Plasma glucose curves (A) and glucose AUC (B) obtained during OGTTs before and after medication. Data are mean ± SD. (C) Frequency of peak glucose concentration measurement versus time of measurement during OGTT. *p<0.01.

Figure 3. Percentage improvement of AUC. Correlation between the degree of improvement estimated by IG-AUC and PG-AUC. Difference of AUC before and after medication (A) and the percentage difference of AUC (B) are shown. Best-fitting (solid) and y=x (dashed) lines are shown.
▪ Estimation of peak plasma glucose
In addition to the whole glucose excursion, another aspect of the post-challenge glucose profile is glucose fluctuation reflected to peak glucose concentration. We evaluated estimation of peak glucose levels using the glucose AUC even though the peak concentration was shifted to an earlier time by the medications, as shown in Figure 2. Figure 4 shows the correlation between AUC and peak plasma glucose. Both PG-AUC (r=0.97, Figure 4A) and IG-AUC (r=0.87, Figure 4B) were significantly correlated with peak plasma glucose.

Figure 4. Correlation between peak PG levels and AUC. Correlation of peak PG levels and IG-AUC (A) or PG-AUC (B).
▪ Participant questionnaire
Finally, we evaluated the favorable/ unfavorable attributes of MIET using a questionnaire. All participants completed the questionnaire except one with a cancelled OGTT. The results of a questionnaire (Figure 5) confirmed that most patients felt little or no discomfort (Figure 5A) during and experienced little erythema (Figure 5B) after the MIET measurements.

Figure 5. Patients’ questionnaire on MIET. Patient responses to MIET questionnaires concerning the comfort of gel patches (A) and erythema after (B) MIET assays.
Discussion
In this study, it was shown that MIET could measure short-term change of glucose tolerance. As existing indices, such as HbA1c, reflect longer periods of glycemic status, MIET could address another point from existing methods.
▪ Evaluation of medication effectiveness using MIET
Many studies of treatment efficacy used HbA1c as an index of glucose level, regardless of the used medication [13-15]. Most of these studies evaluated long-term efficacy of drugs, that is, 6 months to approximately 1 year. Although evaluation of long-term efficacy is important because diabetes is a chronic disease, evaluation of short-term effectiveness is also necessary in order to optimize diabetes management. Glucose profiles after glucose loading could reflect the current glycemic status, but a series of multiple blood sampling may be painful and burdensome for patients. MIET offers simple and convenient measurement of glucose AUC without blood sampling. In this study, medication improved mean BG–AUC from 533.8 mg h/dL to 363.7 mg h/dL in average. Other studies reported that 3 days of Sitagliptin [16] or Teneligliptin [17] treatment reduced BGAUC from approximately 450 mg h/dL to 350 mg h/dL. Considering the differences between GLP-1 analogues and DPP-4 inhibitors, in addition to the difference of treatment periods, it seems reasonable that our results show a larger decrease in BG-AUC [18,19]. For all 73 samples, the measurement error (one SD of IG-AUC/ BG-AUC value) was ± 11.3%. Since the mean decrease of BG-AUC was approximately 30%, MIET could be applicable to the evaluation of AUC improvement. In this study, IG-AUC was used to monitor current glycemic status, and could be useful for the evaluation of treatment efficacy. Distinguishing the class effect from the effectiveness of a specific agent, and investigating applicability to other hypoglycemic drugs, are topics for future research.
▪ Estimation of peak glucose using AUC
Much work indicates that post-challenge or postprandial glucose levels are associated with the occurrence of cardiovascular events [20,21].
Assuming that glucose levels peak 1 or 2 h after meals, peak glucose could predict risk of cardiovascular events in T2DM patients [22,23]. The time at which glucose concentration peaks might differ among patients, and it is difficult to determine the time at which peak concentration is reached. Using the AUC may be advantageous, as it is strongly correlated with peak glucose values independent of the time of peak concentration (Figure 4). The study results indicate that monitoring AUC might allow more effective use of drugs, especially those that reduce postprandial glucose levels, such as α-glucosidase inhibitors, glinides, and short-acting GLP-1 analogues. Both PG-AUC and IG-AUC showed possibility to estimate peak plasma glucose; obtaining PG-AUC requires multiple blood samples. Therefore, measuring IG-AUC using MIET is potentially more useful for monitoring as reflecting overall glucose rise including peak glucose, compared with simple peak glucose level whose time is different among patients. Another aspect of peak glucose levels is glucose variability. Glucose variability is thought to affect the prognosis of diabetes patients [24,25]. Postprandial glucose excursion is the primary component of glucose rise, and could be reflected in the OGTT response. Since the contribution of postprandial glucose rise to total glucose variability could vary among patients depending on their glycemic status or medication, evaluating the usefulness of IG-AUC as an index of glycemic variability is a focus of our future research.
▪ Further applications for the evaluation of medication effectiveness
Large studies have indicated that not only hyperglycemia but hypoglycemia could contribute to adverse events [26,27]. Recently, novel drugs have become available that help avoid hypoglycemia while achieving target blood glucose levels. These include incretin-related drugs, which exert a glucose-lowering effect that depends on blood glucose levels, and sodium/ glucose cotransporter 2 (SGLT2) inhibitors, which are recently more and more widely used because they are effective in not only blood glucose management but also body weight management [28,29].
As SGLT2 inhibitors increase urinary glucose excretion, some indices are unusable in patients taking them. For example, serum 1, 5-anhydroglucitol (1, 5-AG) is an index known to reflect postprandial hyperglycemia over the previous few days. If blood glucose level increases, then the 1, 5-AG concentration decreases because glucose competes with 1, 5-AG for renal reabsorption. Since SGLT2 inhibitors increase urine glucose excretion, monitoring postprandial hyperglycemia with 1, 5-AG is difficult in patients using SGLT2 inhibitors. If MIET can be applicable to the patients using SGLT2 inhibitors, MIET could contribute to the management of SGLT2 inhibitors, which needs a further study.
Study Limitations
The sample size was not powered to compare the responses to each class of tested incretin-related agents; further study is required to distinguish the class effect from the efficacy of specific agents. Moreover, the performance observed at several periods after glucose loading should be compared to determine the optimal time for obtaining the AUC.
Conclusion
The results of the present study suggest that MIET can provide simple AUC measurements to monitor short-term changes in glucose tolerance by incretin-related drugs, indicating that MIET could contribute to the optimization of therapy.
Acknowledgement
This study was performed by the Minimally Invasive Interstitial Fluid Extraction Technology (MIET) study group, and was supported by Sysmex Corporation, Japan. It was presented in part at the 49th European Association for the Study of Diabetes, the 22nd International Diabetes Federation World Diabetes Congress, and the 13rd Annual Meeting of the Japan Association of Diabetes Informatics.
Disclosure Statement
K. Kosugi, K. Sakamoto, K. Yoshiuchi received research funding from Sysmex. T. Sato, S. Okada, Y. Ohnishi, H. Koga, K. Tokunaga, and C. Suminaka are employees of Sysmex. No other potential conflicts of interest relevant to this article are reported.
References
- Diabetes Atlas, 7th edition. International Diabetes Federation, 2015
- Cho Y. Incretin physiology and pathophysiology from an Asian perspective. J. Diabetes. Investig. 6(5), 495-507 (2015).
- Moller J, Pedersen M, Tanaka H, et al. Body composition is the main determinant for the difference in type 2 diabetes pathophysiology between Japanese and Caucasians. Diabetes. Care. 37(3), 796-804 (2014).
- Tan V, Lee Y, Venkataraman K, et al. Ethnic differences in insulin sensitivity and beta-cell function among Asian men. Nutr. Diabetes. 5(7): e173 (2015).
- Cozma L, Luzio S, Dunseath G, et al. Comparison of the effects of three insulinotropic drugs on plasma insulin levels after a standard meal. Diabetes. Care. 25(8), 1271-1276 (2002).
- Tanimoto M, Kanazawa A, Hirose T, et al. Comparison of sitagliptin with nateglinide on postprandial glucose and related hormones in drug-naïve Japanese patients with type 2 diabetes mellitus: A pilot study. J. Diabetes. Investig. 6(5), 560-566 (2015).
- Sato T, Okada S, Hagino K, et al. A novel technique of glucose area under the curve monitoring with interstitial fluid. Diabetes. Technol. Ther. 13(12), 1194-200 (2011).
- Sakaguchi K, Hirota Y, Hashimoto N, et al. A minimally invasive system for glucose area under the curve measurement using interstitial fluid extraction technology; evaluation of the accuracy and usefulness with oral glucose tolerance tests in subject with and without diabetes. Diabetes. Technol. Ther. 14(6), 485-91 (2012).
- Sakaguchi K, Hirota Y, Hashimoto N, et al. Evaluation of a minimally invasive system for measuring glucose area under the curve during oral glucose tolerance tests: usefulness of sweat monitoring for precise measurement. J. Diabetes. Sci. Technol. 7(3), 678-688 (2013).
- Sakamoto K, Kubo F, Yoshiuchi K, et al. Usefulness of a novel system for measuring glucose area under the curve while screening for glucose intolerance in outpatients. J Diabetes Investig 4(6), 552-559 (2013).
- Sakaguchi K, Takeda K, Maeda M, et al. Glucose area under the curve during oral glucose tolerance test as an index of glucose intolerance. Diabetol. Int. 7(1), 53-58 (2016).
- Watanabe T, Hagino K, Sato T. Evaluation of the effect of polymeric microneedle arrays of varying geometries in combination with a high-velocity applicator on skin permeability and irritation. Biomed Microdevices 16(4), 591-597 (2014).
- Dicker D. DPP-4 inhibitors: impact on glycemic control and cardiovascular risk factors. Diabetes. Care. 34(Suppl2), S276-278 (2011)
- Nauck M, Stewart M, Perkins C, et al. Efficacy and safety of once-weekly GLP-1 receptor agonist albiglutide (HARMONY 2): 52 week primary endpoint results from a randomised, placebo-controlled trial in patients with type 2 diabetes mellitus inadequately controlled with diet and exercise. Diabetologia 59(2), 266-274 (2016).
- Haas B, Eckstein N, Pfeifer V, et al. Efficacy, safety and regulatory status of SGLT2 inhibitors: focus on canagliflozin. Nutr. Diabetes. 4(11), e143 (2014)
- Murai K, Katsuno T, Miyagawa J, et al. Very short-term effects of the dipeptidyl peptidase-4 inhibitor sitagliptin on the secretion of insulin, glucagon, and incretin hormones in Japanese patients with type 2 diabetes mellitus: analysis of meal tolerance test data. Drugs. R. D. 14(4), 301-308 (2014).
- Tsuchimochi W, Ueno H, Yamashita E, et al. Teneligliptin improves glycemic control with the reduction of postprandial insulin requirement in Japanese diabetic patients. Endocr. J. 62(1), 13-20 (2015).
- De Fronzo R, Okerson T, Viswanathan P, et al. Effects of exenatide versus sitagliptin on postprandial glucose, insulin and glucagon secretion, gastric emptying, and caloric intake: a randomized, cross-over study. Curr. Med. Res. Opin. 24(10), 2943-2952 (2008).
- Amolds S, Dellweg S, Clair L, et al. Further improvement in postprandial glucose control with addition of exenatide or sitagliptin to combination therapy with insulin glargine and metformin: a proof-of-concept study. Diabetes. Care. 33(7), 1509-1515 (2010).
- Tominaga M, Eguchi H, Manaka H, et al. Impaired glucose tolerance is a risk factor for cardiovascular disease, but not impaired fasting glucose. The Funagata Diabetes Study. Diabetes. Care. 22(6), 920-924(1999).
- DECODE Study Group. Glucose tolerance and cardiovascular mortality: comparison of fasting and 2-hour diagnostic criteria. Arch. Intern. Med. 161(3), 397-405 (2001).
- Hanafeld M, Fischer S, Julius U, et al. Risk factors for myocardial infarction and death in newly detected NIDDM: the Diabetes Intervention Study. 11-year follow-up. Diabetologia. 39(12), 1577-1583 (1996).
- Cavarot F, Petrelli A, Traversa M, et al. Postprandial blood glucose is a stronger predictor of cardiovascular events than fasting blood glucose in type 2 diabetes mellitus, particularly in women: lessons from the San Luigi Gonzaga Diabetes Study. J .Clin. Endocrinol. Metab. 91(3): 813-9 (2006).
- Smith-Palmer J, Brandle M, Trevisan R, et al. Assessment of the association between glycemic variability and diabetes-related complications in type 1 and type 2 diabetes. Diabetes. Res. Clin. Pract. 105(3), 273-284 (2014).
- Jung HS. Clinical implications of glucose variability: chronic complications of diabetes. Endocrinol. Metab. 30(2), 167-74 (2015).
- Zoungas S, Patel A, Chalmers J, et al. Severe hypoglycemia and risks of vascular events and death. N. Engl. J. Med. 363(15), 1410-1418 (2010).
- Seaquist E, Miller M, Bonds D, et al. Mortality in the ACCORD Study. Diabetes. Care. 35(2), 409-414 (2012).
- Retnakaran R, Qi Y, Goran MI, et al. Effects of canagliflozin on body weight and body composition in patients with type 2 diabetes over 104 weeks. Postgrad. Med. 128(4), 371-380 (2016).
- Ome M, Fenici P, Lomon I, et al. A systematic review and mixed-treatment comparison of dapagliflozin with existing anti-diabetes treatments for those with type 2 diabetes mellitus inadequately controlled by sulfonylurea monotherapy. Diabetol. Metab. Syndr. 6(1), 73 (2014).