Review Article - Interventional Cardiology (2009) Volume 1, Issue 2
Role of fractional and coronary flow reserve in clinical decision making in intermediate coronary lesions
- Corresponding Author:
- Martijn Meuwissen
Department of Cardiology, Academic Medical Center
Meibergdreef 9, 1105 AZ, Amsterdam, The Netherlands
Tel: +31 205 665 403
Fax: +31 206 962 609
E-mail: m.meuwissen@amc.uva.nl
Abstract
Keywords
angina pectoris, coronary artery disease, coronary flow, microcirculation, percutaneous coronary intervention
Rationale for assessment of coronary physiology
While coronary angiography is used as the gold standard for documentation of the presence and extent of coronary artery disease, it has its limitations in assessing the functional significance of coronary stenoses [1,2]. Even experienced operators show only moderate results in evaluating the hemodynamic severity of particular stenoses by visual estimation [3]. These limitations of coronary angiography have been consistently documented by functional evaluation using exercise testing or anatomic analysis using intravascular ultrasound [1,2]. Pathological studies have shown that the development of most coronary plaques and stenoses starts with so-called positive remodeling, the compensatory enlargement of the outer wall of the artery [4], but will subsequently compromise the vessel lumen. These atherosclerotic plaques will only be detectable on coronary angiography when they have reached a cross-sectional area corresponding to half of the vessel area [2]. Moreover, the atherosclerotic involvement of a diffusely diseased vessel may be underestimated by angiography that only visualizes the vessel lumen. Besides the lack of information of the vessel wall, coronary angiography is a 2D imaging technique and generally requires two orthogonal projections for satisfactory visual assessment. Image foreshortening, angulation, tortuosity, vessel overlap and calcifications may hamper adequate geometric evaluation. Even when the geometric dimensions of a stenosis are quantified by computer-assisted analysis, the translation of anatomic lumen reduction to hemodynamic stenosis severity is not straightforward, since functional severity depends on coronary hemodynamics. The poor functional predictive accuracy of coronary angiographic parameters is particularly evident in intermediate coronary lesions (IL; i.e., lesions with 40–70% diameter stenosis) (Figure 1) [5,6]. This poor relation between anatomical and functional severity of coronary stenoses was also shown by new and promising noninvasive techniques using multidetector computed tomography coronary angiography [7,8]. IL are frequently encountered in diagnostic coronary angiography, especially in patients with multivessel coronary artery disease (MVD) [9], who currently comprise the largest group of patients admitted to the cardiac catheterization laboratory for percutaneous coronary intervention (PCI).

Figure 1: Scatter plots of coronary (A) and fractional flow reserve (B) versus diameter stenosis showing the discrepancy between the angiographic and the physiological severity of coronary lesions. A wide range of measurements of coronary flow reserve and fractional flow reserve are observed for intermediate coronary lesions (i.e., 40–70% diameter stenosis [gray areas]).
Although the enhanced safety of PCI owing to better delivery system technology and (drugeluting) coronary stents has improved shortand long-term patency, complications still occur. In view of these early (procedural) and late (restenosis) complications of PCI, adequate selection of hemodynamically compromising lesions is mandatory [10–16]. The development of PCI guidewires equipped with miniaturized sensors at the tip allows assessment of functional coronary lesion severity in the cardiac catheterization laboratory. The parameters derived from intracoronary flow and pressure can be used for ad hoc clinical decision making. This review will discuss the role of coronary physiological measurements in clinical decision making in the cardiac catheterization laboratory.
Physiology of the coronary circulation
In healthy conditions, coronary blood f low is well adapted to the metabolic needs of the heart [17]. Since oxygen extraction is almost maximal in the coronary system, coronary flow needs to increase in response to an increase in myocardial oxygen demand.
Coronary blood flow is locally controlled at the organ level. The coronary circulation can be conceptually divided into the epicardial conductance vessels and the intramural vessels, (i.e., arteries and arterioles down to the capillary level that comprise the microcirculation). Hemodynamically, blood flow through the vascular system is governed by Ohm’s law, which states that flow is equal to the pressure gradient divided by the sum of resistances between the input and output of the vessel. Vascular resistance to blood flow can be described by the law of Hagen and Poiseuille, which implies that the resistance is proportional to the vessel length and blood viscosity and inversely proportional to the fourth power of the diameter. This provides the coronary circulation with a powerful mechanism for blood flow regulation by altering smooth muscle tone (e.g., a 30% reduction in vessel diameter results in a fourfold increase in resistance). All coronary arterial vessels with diameters less than 400 μm contribute to flow control [18]. Dilation of these resistance vessels can increase myocardial blood flow up to sixfold to meet enhanced demand [19,20].
In the absence of an epicardial stenosis, maximum flow in humans should rise to at least approximately three-times above that of resting flow [21] and was reported to reach approximately 4.5-times the resting level in healthy men [22]. This reserve capacity, calculated as the ratio of maximum to resting coronary blood flow, is called coronary flow reserve (CFR) [23,24].
The diagram shown in Figure 2 illustrates this concept by means of the relationship between coronary arterial input pressure and flow. In the presence of vessel tone, the pressure–flow relationship is characterized by a central flat portion that represents autoregulation (i.e., little change of flow with change of pressure). The maximal flow without tone is predominantly a function of the total cross-sectional area of the microvascular resistance (MR) vessels, which in turn depends on the prevailing distending pressure [25]. The pressure–flow relationship at maximal vasodilation is therefore straight at physiological pressures, with a convex portion at the lower end (not shown in this diagram) that intercepts the pressure axis at a positive value slightly higher than right atrial pressure. The vertical line indicates the CFR. Note that CFR depends on perfusion pressure. It can be reduced by an increased baseline flow (e.g., owing to increased heart rate), a decreased maximal flow (e.g., owing to decreased diastolic perfusion time in tachycardia, left ventricular hypertrophy [LVH], increased blood viscosity or small vessel disease) and a rightward shift of the maximal pressure–flow line (e.g., owing to increased extravascular mechanical forces, as in elevated left ventricular end-diastolic pressure or LVH). A summary of the various factors that can reduce CFR was published by Hoffman [26]. The existence of functional collateral vessels induces a rise of the pressure intercept (altered concave portion at low perfusion pressures) without changing the slope at pressures above 40 mmHg. This effect and its influence on coronary MR were recently discussed by Spaan and coworkers [25].

Figure 2: Coronary pressure–flow relationship. Coronary arterial input pressure and blood flow are shown at baseline (autoregulation, with control) and at maximal vasodilation (control absent). Dotted lines represent the normal circulation and solid lines reflect the changes in the presence of an epicardial stenosis, when maximal flow becomes progressively lower with increasing input pressure and the autoregulatory range is compromised. Consequently, CFRN (solid arrows) is larger than CFRS (dashed arrows). FFR represents the ratio of maximal flow without a stenosis to that with a stenosis.
CFRN: Coronary flow reserve without a stenosis; CFRS: Coronary flow reserve with a stenosis; FFR: Fractional flow reserve.
The concept of CFR as a physiological measure of coronary stenosis severity was developed in the 1970s by Gould and coworkers [23,27]. Wilson et al. introduced the Doppler-based coronary flow velocity reserve as a surrogate for CFR [28]. Measuring flow velocity has the advantage of it being remarkably constant along the major epicardial vessels, whereas volume flow depends on the perfused mass of myocardium and diminishes with each branch point [29,30].
The luminal narrowing caused by a stenosis in an epicardial conductance vessel represents an additional resistance to blood flow (Figure 3). This resistance can be overcome at rest by compensatory vasodilation, and autoregulated flow only decreases near complete occlusion when the vasodilatory capacity is exhausted (see Figure 2, solid line). This compensatory mechanism to maintain baseline flow, however, also diminishes the ability to dilate further in response to increased myocardial demand and leads to a reduction of maximal flow. Coronary revascularization is indicated when stenosis severity has reached a level of impaired coronary flow that can no longer meet oxygen demand. This will first be noticeable during exercise. The effect of a stenosis on the coronary pressure–flow relationship at maximal vasodilation is also depicted in Figure 2 (solid line), which in this case is characterized by a curvilinear relationship owing to the nonlinear pressure loss induced by the stenosis, as explained below.

Figure 3: Effect of a coronary stenosis on downstream perfusion pressure. Total pressure loss across the stenosis (ΔP) is equal to the sum of frictional (Poiseuille) losses along the lesion and losses due to convective acceleration (Bernoulli) at the throat that are expended at the exit due to flow separation and recirculation eddies (exit losses). Frictional losses are linearly correlated to flow, Q, and exit losses increase with the square of the flow as ΔP = AQ + BQ2 . The loss coefficients A and B are a function of stenosis geometry and rheological properties of blood (viscosity and density). Insert: The diseased coronary circulation illustrated by a lumped electrical analog, with SR in series with a variable MR. The graphical representation of this equation results in a quadratic relationship, where the curvilinear shape demonstrates the presence of nonlinear exit losses. When no stenosis is present, the second term is zero and the curve becomes a straight line (with a positive slope that depends on the diameter of the vessel; law of Poiseuille). MR: Microvascular resistance; SR: Stenosis resistance.
The trans-stenotic pressure gradient (DP) caused by diameter reduction is the sum of frictional (Poiseuille) losses along the throat of the lesion, losses due to convective acceleration (Bernoulli) and flow separation at the exit of the lesion (Figure 3). This can be described by a quadratic relationship
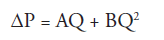
where Q represents flow (or flow velocity) and A and B are the viscous and expansion loss coefficients, respectively, that depend on the rheological properties of blood and on the detailed geometry of the stenosis, with a dominant influence of the inverse fourth power of the minimum stenosis diameter in both terms [31]. The resulting nonlinear pressure drop–flow relationship uniquely characterizes the hemodynamic severity of a particular stenosis [32–34].
Figure 4 depicts the link between the physiological and hemodynamic severity of a coronary stenosis. The pressure drop–velocity relationships for three stenoses of different hemodynamic severity are shown, with stenosis A being the most severe and stenosis C representing a mild lesion. Obviously, the pressure drop across a given epicardial stenosis depends on flow, hence it is not only determined by anatomic stenosis severity, but also by the dilatory capacity of the resistance vessels. As depicted by the white (baseline) and black (hyperemia) symbols in Figure 4, stenoses B and C would yield the same CFR, despite different hemodynamic severity. In addition, microvascular disease (e.g., in cardiac hypertrophy or diabetes) may limit maximal achievable flow, while resulting in a lower hyperemic pressure gradient for the same coronary stenosis (Figure 4 stenosis A, gray circle). Conversely, sinus tachycardia induces a higher baseline flow (Figure 4 stenosis C, gray square) and hence may decrease CFR without a change in hyperemic pressure gradient.

Figure 4: Pressure drop–flow velocity curves of three stenoses with different severity, illustrating the importance of combined measurements. The pressure drop–flow relationship uniquely describes the hemodynamic characteristics of a given stenosis. The steeper the curve, the more severe the stenosis. With a reduction in MR, flow increases from baseline (white symbols) to maximal flow (black symbols) along each curve, which is associated with a quadratic increase in pressure gradient. Assuming an aortic pressure of 100 mmHg and a baseline velocity of 15 cm/s (white symbols), cut-off values for FFR and CFR are indicated by horizontal and vertical lines, respectively. A change in MR affects FFR and CFR in opposite directions. An increase in hyperemic MR (e.g., due to microvascular disease) reduces maximal blood flow and hence pressure gradient across the stenosis (gray circle of stenosis A), thereby increasing FFR to a nonischemic value. A change in baseline resistance (due to higher demand, for example by tachycardia) will result in a higher baseline flow (gray square of stenosis C) and, consequently, a lower CFR (below the ischemic threshold). Note that at maximal hyperemia for stenosis B (black triangle), FFR and CFR have discordant values with respect to their respective ischemic threshold. CFR: Coronary flow reserve; FFR: Fractional flow reserve; MR: Microvascular resistance.
The fact that the limiting influence of a stenosis is accentuated at elevated flow rates led Young et al. to propose in 1977 the ratio of maximal flow in the presence of the stenosis (Qms) to maximal flow without the stenosis (Qmo) as a useful index to characterize the effect of a stenosis as [32]:

where Pa = aortic pressure. This ratio was later reintroduced as ‘relative maximal flow’ by Gould et al. to describe the impact of a coronary stenosis in dogs [27]. This notion was subsequently extended by Pijls and coworkers to the concept of fractional flow reserve (FFR) that provided the theoretical framework to estimate the maximal myocardial flow ratio, including possible collateral flow, from pressure measurements alone [35]. FFR is defined at maximum hyperemia as the ratio of distal coronary pressure (Pd) minus coronary venous pressure (Pv) to aortic pressure minus coronary venous pressure. Implicit in this derivation is the assumption that coronary MR in the maximally dilated vascular bed is constant. However, downstream perfusion pressure is likely to be markedly reduced in the presence of a stenosis that will in turn increase MR in the distensible vessels without tone comprising the myocardial vascular bed at maximal vasodilation [36]. These and other caveats have been described by Hoffman [26] and Siebes et al. [37]. The result of a discrepancy in minimal MR due to different perfusion pressures will be that the pressure ratio is higher than the maximal flow ratio.
Considering the simple model of the coronary circulation depicted in Figure 3, the total resistance of the diseased coronary circulation is determined by two resistances in series (Figure 3): a proximal epicardial stenosis resistance (SR) and a downstream variable MR. FFR can be expressed in terms of these resistances as:
FFR = MR/(SR + MR)
All measurements evaluated at maximal vasodilation. Figure 5 depicts the dependence of the pressure ratio Pd/Pa on flow velocity for different stenosis severities. With increasing flow velocity after a bolus of adenosine, Pd/Pa decreases in a nonlinear fashion due to the quadratic increase in stenosis pressure gradient. FFR is evaluated at the maximal velocity (or minimal MR) that can be achieved for a particular microvascular bed. As outlined above, minimal MR depends on external hemodynamic conditions and on the dilatory capacity of the microvascular bed. A change in minimal MR affects both FFR and CFR, although in opposite directions, as illustrated in Figure 4. A higher hyperemic flow will decrease FFR, but increase CFR. This can result in discordant outcomes for these clinical indices, as shown in the example of stenosis B (low MR) and stenosis C for a high MR.

Figure 5: Coronary flow velocity and the ratio of distal pressure to aortic pressure measured in four stenoses of different severity in patients during the increase in flow velocity above baseline flow induced by adenosine injection. These data illustrate how fractional flow reserve (FFR) = Pd/Pa decreases and coronary flow reserve (CFR) = vmax/vbase increases with the reduction in microvascular resistance (MR). For mild stenoses, small variations in minimal MR have very little effect on FFR compared with CFR. Conversely, a change in minimal MR in case of a severe stenosis has a large influence on FFR, while CFR is hardly affected. Pd/Pa: Distal pressure:aortic pressure ratio; v: Coronary flow velocity.
Variability in MR exists not only between patients, but also between different vascular territories within one heart [38–40]. Transmural and temporal heterogeneity of myocardial blood flow renders the subendocardium more susceptible to ischemia [41] and represents an additional complication in the interpretation of functional parameters that are essentially based on lumped resistance models. Also, as discussed above, MR in the vasodilated microvascular bed depends on perfusion pressure, and a positive relation between coronary lesion severity and MR was observed [39]. Conversely, restoration of distal distending pressure after PCI immediately reduced hyperemic MR (HMR) to values similar to that of the normal reference vessel [42], thereby contributing to the beneficial effect of PCI with respect to coronary perfusion.
The interaction between coronary blood flow, stenosis pressure gradient and coronary MR must be kept in mind in clinical practice when using intracoronary-derived physiological parameters such as CFR or FFR for clinical decision making.
Clinical assessment of functional coronary lesion severity
The development of PCI guidewires equipped with miniaturized pressure and/or flow velocity sensors has led to the introduction of intracoronary hemodynamic measurements in the catheterization laboratory [34,43–45].
▪ Technique of flow velocity & pressure measurements
Accurate acquisition and interpretation of signals are mandatory for optimal assessment of coronary physiology. Intercoronary pressure measurements can be obtained with the PrimeWire™ or ComboWire® (Volcano Corp., CA, USA) or with the PressureWire™ (St Jude Medical, MN, USA) that incorporate a pressure sensor at the tip or 1.5 or 3 cm proximal to the tip of the wire. Before crossing the coronary lesion of interest, the sensor output must be zeroed outside the patient and thereafter equalized to the aortic pressure in the guiding catheter at the ostium of the coronary artery. It is important to be aware of pitfalls in interpretation, such as pseudostenosis created by the guiding catheter (catheter obstruction, damping or spasm), catheter malaposition (insufficiemt hyperemia) and pressure sensor drift. To rule out the latter, a control with the pressure wire in the guiding catheter must be performed [46]. When serial lesions or a diffusely diseased vessel are evaluated, a continuous pressure recording during a slow pullback can provide useful information. The axial distribution of changes in pressure (gradual or stepdown) along the coronary vessel can then be observed during maximum hyperemia. For this, a long-acting hyperemic agent is mandatory (see below and Table 1) [47].

Table 1: Pharmacologic agents for inducing hyperemia.
Coronary flow velocity can be assessed using a FloWire® or a ComboWire (Volcano Corp.), both equipped with a Doppler sensor at the tip. The Doppler sensor should be advanced at least 2 cm beyond the stenosis to avoid poststenotic flow disturbance. After recording resting (baseline) flow velocity, maximum flow velocity can be achieved by different hyperemic stimuli (see below and Table 1). Adequate assessment of flow velocity is more difficult compared with pressure measurement, and may result in insufficient quality in approximately 10% of patients [45]. Wire positions and orientation should be carefully varied to achieve an optimal tracking of the velocity signal [6]. The main advantage of Doppler-based velocity measurement is the continuous recording of instantaneous changes in velocity (i.e., changes in the pulsatile velocity waveform can be followed throughout interventions that alter coronary blood flow).
A recent alternative is based on the principle of thermodilution and uses bolus injections of saline at room temperature [48]. The temperature sensitivity of the pressure sensor (PressureWire) can then be applied to measure the mean transit time. The ratio of mean transit times obtained at rest to that obtained at maximal hyperemia is then an indirect measure of CFR [45]. Optimal assessment depends on several technical aspects. The pressure sensor must be positioned at a stable position distal to the stenosis of interest and more than 6 cm downstream of the injection site. Room temperature saline must be quickly injected in the coronary artery, without influencing the coronary flow. Overestimation also occurs when large side branches exist between the infusion site and the stenosis of interest. A steady-state hyperemia is mandatory, although the associated decline in blood pressure may influence the results. These factors may contribute to the average 20% over-estimation of Doppler-derived CFR by this thermodilution-based method, which is greatest at clinically relevant values [49]. Technical success rates of 87% have been described [45]. This method has recently been extended to obtain absolute blood flow by slow continuous infusion of cold saline [50]. However, also with this approach, only average values over several seconds can be obtained, which remains a limitation of thermodilution- based methods.
▪ Pharmacologic hyperemic agents
Maximal hyperemia is essential in the assessment of most parameters of functional coronary stenosis severity. However, in the assessment of SR it is less crucial, since pressure gradient and flow change in the same direction. Prior to intercoronary pressure and flow assessment, intercoronary nitroglycerine (0.1–0.2 mg) should be administered to reduce epicardial vessel tone and to minimize vasomotion. Various agents can be used for maximal vasodilatation of the coronary resistance vessels and resulting maximal hyperemia. In clinical practice, adenosine is most often used either by intercoronary or intravenous infusion. Other hyperemic agents include papavarine, dobutamine and ATP (Table 1) [6,46,51–55].
▪ Fractional flow reserve
At present, the most frequently used physiological index is the pressure-based myocardial FFR. By definition, Pa = Pd when there is no stenosis and FFR is equal to 1. An FFR value of less than 0.75 indicates functional significance of coronary severity causing myocardial ischemia [56]. In clinical practice, the calculation of FFR is simplified by neglecting the right atrial pressure because it is small compared with the aortic pressure [35,57], although this introduces overestimation of the maximal flow ratio for more severe stenoses [58] and can lead to misclassification of these lesions as insignificant [59]. Intracoronary pressure is easy to measure and applicable in diffuse disease and ostial, bifurcation and main stem lesions [6,47,60,61]. FFR has been presented as a lesion-specific index that is not affected by changes in external hemodynamic conditions [35,62]. However, FFR may be influenced by microvascular disease (LVH, hypertension or diabetes) or the presence of serial stenoses or diffuse coronary disease [38,46,47,63]. Furthermore, age and changes in aortic pressure or heart rate were shown to alter the FFR value [37,42,52,64–66]. In clinical practice FFR has a high diagnostic and prognostic power and has proven its value in numerous studies [6].
▪ Coronary flow (velocity) reserve
Doppler velocity-based coronary indices include CFR, and relative CFR (RCFR). CFR depends on both baseline and hyperemic flow, which makes it more dependent on hemodynamic conditions and therefore is less stenosis-specific compared with FFR. An elevated baseline flow due to microcirculatory disease or an increased resting oxygen demand, for example in tachycardia, LVH, hypertension, aortic stenosis, diabetes or acute myocardial infarction, decreases CFR by definition [26,38,62,67–71]. Similar to FFR, CFR can also be altered by a reduced hyperemic flow due to microcirculatory disorders. This has been noticed in patients with hypertrophic cardiomyopathy, diabetes and acute coronary syndromes (ACSs) [67,69,70,72–74]. Endothelial dysfunction with decreased vasodilation may also decrease maximal flow and thus CFR, as was observed in patients who smoked or had diabetes and hypertension [75–77]. Finally, age negatively influences CFR. A CFR value of less than 2.0 is used to identify coronary lesions causing myocardial ischemia. In order to reduce the dependence on hemodynamic conditions, the RCFR was introduced. The RCFR is defined as the ratio of CFR measured in the coronary artery with a stenosis divided by the CFR in a normal reference artery. The concept of RCFR assumes homogeneity of MR and requires assessment of CFR in two vessels. Moreover, an angiographically ‘normal’ reference coronary artery could be diffusely diseased and may not be ‘normal’ at all [26,47]. RCFR is, however, less dependent on hemodynamic conditions. By definition, the normal value of RCFR is 1 and a value less than 0.65–0.75 is associated with myocardial ischemia.
Thermodilution-based CFR (CFRthermo) was first described in 2001 [45,48]. As outlined above, CFRthermo is assessed from the mean transit time at rest compared with the mean transit time at maximal hyperemia. Essentially, the CFRthermo has to deal with similar disadvantages as Doppler CFR, such as dependency on baseline and hemodynamic conditions. However, in vivo validation showed a fairly good correlation with Doppler-derived CFR. No phasic signals can be measured as with a Doppler velocity wire. Furthermore, the assessment of adequate thermodilution signals is cumbersome and time-consuming. No direct validation with noninvasive stress testing has been performed yet.
▪ Clinical parameters derived from combined pressure & flow
It has long been recognized that intracoronary flow and pressure provide complementary information in assessing functional coronary lesion severity [31,34,63,65]. Each stenosis has its own unique pressure drop–flow relationship, which describes its hemodynamic severity. Pioneering work from Gould et al. in the 1970s laid the foundation for combined flow and pressure evaluation of coronary stenoses [33,78]. Measures of coronary conductance based on the instantaneous hyperemic velocity–pressure relationship were reported to improve the functional assessment of stenosis severity [79–81]. However, the data analysis was cumbersome to perform and did not ultimately reach clinical acceptance.
Advances in wire technology led to the ability to simultaneously assess pressure and flow velocity [34,38,82,83] or pressure and temperature [45,48] distal to any coronary stenosis. This progress in technology allows the discrimination between the resistance caused by an epicardial stenosis and the resistance of microcirculation. Furthermore, combined translesional intracoronary pressure and flow measurements elucidated the complementary information of coronary pressure or flow‑derived functional parameters.
An index of SR defined as the translesional pressure gradient divided by flow during maximal hyperemia (HSR) improved the diagnostic accuracy, particularly in those patients with discordant results between CFR and FFR [84]. HSR is stenosis-specific, independent of baseline flow and is less dependent on maximal vasodilatation. There is low variability in assessment and the measured data also yield FFR and CFR. By definition, the normal value of HSR is 0. A HSR value greater than 0.80 mmHg •cm-1 •s indicates a coronary narrowing causing myocardial ischemia [84]. However, the combined measurement performed with two wires (pressure and flow velocity) was shown to reduce the diagnostic accuracy of the derived parameters and was associated with overestimation of the hemodynamically assessed lesion severity [85]. This underscores the advantage of a dualsensor- equipped guidewire for the evaluation of stenosis severity by combined pressure and velocity measurements.
Diagnostic performance of FFR, CFR & HSR
As mentioned above, there are strong correlations between physiological parameters and noninvasive stress testing for myocardial ischemia. Sensitivity and specificity range between 70 and 100%. Physiologic thresholds for myocardial ischemia for FFR vary between 0.66 and 0.78 (Table 2). Overall accuracy for myocardial ischemia is 81% with a best cut-off value of 0.74 [56,57,61,86–106]. Accuracy with noninvasive testing is highest in single-vessel disease (81–97%) and somewhat lower in MVD, in regions of myocardial infarction, in restenosis or in saphenous vein graft lesions (60–92%). However, almost all of these validation studies were performed in patients with stable angina pectoris.

Table 2: Comparison of noninvasive stress test results and fractional flow reserve in different patient populations.
Ischemic thresholds for CFR may vary between 1.7 and 2.1 (Table 3) [84,90,91,107–120]. Overall accuracy for myocardial ischemia is 81% with a best cut-off value of 1.9. Similar to FFR, accuracy compared with noninvasive testing is also highest in single-vessel disease (75–96%) and slightly lower in MVD and saphenous vein graft lesions (75–83%).

Table 3: Comparison of noninvasive stress test results and coronary flow reserve in different patient populations.
Thresholds indicating myocardial ischemia for RCFR range from 0.60 to 0.75 (Table 4) [91,115,117,118,120]. Overall accuracy for myocardial ischemia is 75% with a best cut-off value of 1.9 and is significantly lower compared with FFR and CFR [65].

Table 4: Comparison of noninvasive stress test results and relative coronary flow reserve in different patient populations.
Validation of HSR yielded a cut-off value for ischemia at 0.8 mmHg •cm-1 •s [84]. Overall accuracy for myocardial ischemia is 87%.
Prognostic performance of FFR & CFR after deferral of PCI
Deferral of PCI for IL that were hemodynamically nonsignificant based on either FFR or CFR is associated with a low major adverse cardiovascular event (MACE) rate (Tables 5 & 6) [100,121–138]. In addition to future revascularizations, FFR may predict mortality and myocardial infarction [139]. In most FFR studies a ‘defer’ value of 0.75 was used. Cardiac death occurs in approximately 0.5% of patients per year. Patients with ACS, diabetes mellitus, intermediate left mainstem lesion or MVD have a worse prognosis [140,141]. Total MACE defined as the combined end point of cardiac death, myocardial infarction, hospital admission for ACS and recoronary intervention (PCI or coronary artery bypass graft [CABG]) varies between 0 and 23% per year, with a mean of 6% per year. Also, total MACE is increased in patients with (recent) ACS, diabetes mellitus, left mainstem lesions and MVD [142–146]. Furthermore, a gradual increase in MACE incidence was noted with decreasing FFR [128,147]. In the so-called ‘gray zone’ between 0.75 and 0.80, MACE rate was between 11 and 23% [128,147]. By contrast, in low-risk patients, an IL showing a FFR higher than 0.80 is associated with a very low risk for future cardiac events [128]. Recent studies show that FFR-guided multivessel intervention (PCI or CABG) is associated with a lower MACE rate compared with angiography-driven revascularization [148–150]. Furthermore, the FAME study also showed reduced costs, fewer stents and less contrast used, and did not prolong the procedure while resulting in a similar (if not better) functional status.

Table 5: Outcome results after deferring angioplasty for intermediate coronary lesions showing a nonischemic fractional flow reserve.

Table 6: Outcome results after deferring angioplasty for intermediate coronary lesions showing a nonischemic coronary flow reserve.
Fractional flow reserve-guided coronary revascularization by PCI also showed comparable survival results with CABG [150–152].
These results encourage the routine use of intracoronary physiology to guide multivessel revascularization.
Deferral of PCI for IL by using CFR shows similar results in comparison with FFR. MACE rate was between 4 and 9% per year and was dominated by revascularizations. Cardiac death occurs in 0–2% per year. Furthermore, a gradual increase in MACE incidence was noted with decreasing CFR [128]. These studies also show that up to 5 years of follow-up, a low MACE rate per year occurs [126,128,153–156].
No prognostic studies have been performed with RCFR and CFRthermo.
There are limited data on the use of combined intracoronary flow and pressure [84,128]. These studies demonstrated that the direct assessment of HSR resulted not only in a better diagnostic assessment of myocardial ischemia and an improved result following PCI [34,42], but also in a better prognosis after deferral of PCI in IL. Furthermore, HSR was shown to be superior, particularly in patients with coronary lesions displaying discordant results between FFR and CFR, who comprise more than a quarter of patients with IL. These patients were associated with a significantly higher MACE rate and can only be identified when both pressure and flow are measured. It may be of clinical relevance to identify these patients, since deferral of PCI is associated with a worse clinical outcome compared with patients with lesions displaying both nonischemic values of FFR and CFR [128].
Further applications of intracoronary hemodynamics in clinical research
Besides the diagnostic and prognostic assessment, intracoronary hemodynamics is also valuable in the evaluation of other conditions and treatment outcomes. Numerous studies have been performed regarding physiology-guided PCI. Table 7 shows a brief overview of the decision values for FFR, CFR and RCFR after balloon angioplasty and coronary stenting. Intracoronary pressure and flow-derived parameters and profiles also have prognostic value after acute myocardial infarction [70,157]. The extent of collateral circulation can be quantified [158–164]. This may be important for risk stratification since patients with hemodynamically important collateral vessels have an improved prognosis. Moreover, endothelial and microvascular function can be studied.

Table 7: Clinical decision-making criteria.
Recent progress has been made in the assessment of coronary MR with the use of coronary guidewires. A thermodilution-derived index of MR (IMR) and a velocity-based HMR have been used [42,165]. Both require the simultaneous assessment of distal coronary pressure. In normal reference vessels IMR = 20–25 U [166] and HMR = 1.8– 2.0 mmHg•cm-1 •s [38,69]. Higher values were associated with microvascular disease. More insight into microvascular disease may be obtained by using these special sensor-tipped guidewires.
Simultaneous measurement of high-fidelity pressure and velocity also opens up new avenues to gain physiological information from the pulsatile nature of these signals that has so far essentially been ignored in clinical applications of coronary hemodynamics. One example is wave intensity analysis to study coronary–cardiac interaction [167–174]. Briefly, with this timedomain method, forward and backward wave travel is analyzed to quantify the amplitude and direction of energy transfer. In a coronary artery, forward waves are generated in the left ventricular cavity and backward waves originate in the intramyocardial vessels via the forces of cardiac contraction and relaxation. The local sum of these concurrently generated waves reflects disturbances or activities on either end of these relatively short vessels that determine the shape of the coronary pressure and flow waveform.
Other new areas of coronary physiology research include the investigation of pharmaco-therapeutics [175,176], evaluation of novel cell therapy [177] and evaluating the performance of new devices in restoring coronary perfusion.
Future perspective
Management of IL (i.e., coronary lesions with a diameter stenosis 40–70%) remains challenging. The currently used physiologic indices FFR and CFR show a high diagnostic and prognostic value and can be easily used in the cardiac catheterization laboratory. Simultaneous assessment of intracoronary pressure and flow velocity may be used to optimize diagnostic and prognostic outcome.
Recent data (FAME study) show a better clinical outcome in low-risk patients with MVD who were randomized between FFR-based versus angiography-based complete revascularization [150]. This physiology-driven strategy reduced the rate of the composite end point of death, myocardial infarction, re-PCI and CABG at 1 year by approximately 30%. The FAME study supports the evolving paradigm of ‘functionally complete revascularization’ (i.e., stenting of only functionally significant coronary lesions). In comparison, the SYNTAX study [151], another recently published study in patients with MVD, showed an overall similar hard (death or myocardial infarction) event rate following PCI and CABG, although the SYNTAX study included more patients with more complex anatomy. The results of the FAME and the SYNTAX trials warrant the conduction of new prospective trials of optimal intracoronary physiology-guided revascularization.
Executive summary
Rationale for assessment of coronary physiology
▪ There is a poor relationship between anatomical and functional severity of coronary stenoses.
Physiology of the coronary circulation
▪ The coronary circulation can be divided into the epicardial conductance vessels and the intramural vessels (i.e., arteries and arterioles down to the capillary level that comprise the microcirculation).
▪ In a normal coronary artery, maximum flow may rise to approximately 4.5-times the resting level. This reserve capacity, calculated as the ratio of maximum to resting coronary blood flow, is called coronary flow reserve (CFR).
▪ Blood flow in the coronary circulation is determined by the driving pressure divided by the sum of the resistances (Ohm’s law).
▪ A stenosis in an epicardial vessel represents an additional resistance to blood flow and reduces CFR as a result.
▪ The hemodynamic severity of a particular stenosis is characterized by a unique nonlinear pressure drop–flow relationship.
Clinical assessment of functional coronary lesion severity
▪ Fractional flow reserve (FFR) is the most frequently used physiological index and is defined as the ratio of mean distal pressure to mean aortic pressure during maximal hyperemia.
▪ An FFR value of less than 0.75 and a CFR value of less than 2.0 indicates a functionally significant coronary severity causing myocardial ischemia.
▪ Hyperemic stenosis resistance (HSR), which is a physiologic parameter based on both intracoronary pressure and flow velocity, showed an improved agreement with noninvasively assessed myocardial ischemia. HSR is defined as the translesional pressure gradient divided by flow during maximal hyperemia. An HSR value greater than 0.80 mmHg •cm-1 •s is indicative for myocardial ischemia.
Diagnostic performance of FFR, CFR & HSR
▪ Overall accuracy with noninvasive stress testing for myocardial ischemia for FFR is 81%, for CFR is 81% and for HSR is 87%.
Prognostic performance of FFR & CFR after deferral of PCI
▪ Deferral of PCI for hemodynamically nonsignificant coronary lesions based on FFR or CFR is associated with a low major adverse cardiovascular event rate of 4–9% per year and is dominated by the need for revascularizations.
Further applications of intracoronary hemodynamics in clinical research
▪ Simultaneous measurement of high-fidelity pressure and velocity also opens up new avenues to gain physiological information from the entire coronary circulation.
Conclusion
▪ Management of intermediate coronary lesions is challenging. The currently used hemodynamic indices FFR and CFR are excellent surrogates for assessment of myocardial ischemia. Moreover, FFR and CFR are useful for clinical decision making in the catheterization laboratory in most cases. However, FFR and CFR are based on either intracoronary pressure or flow and they do not investigate the hemodynamics of the coronary circulation completely. This may sometimes lead to ambiguous outcomes and decisions. Only the use of simultaneously measured intracoronary pressure and flow can unambiguously quantify resistance in epicardial arteries and the microcirculation.
Financial & competing interests disclosure
This work has been supported by the Netherlands Heart Foundation (grant numbers NHS 2000.090, NHS 2006B186, NHS 2006B226) and by the European Community’s Seventh Framework Programme under grant agreement FP7-ICT-2007–224495 (euHeart). The authors have no other relevant affiliations or financial involvement with any organization or entity with a financial interest in or financial conflict with the subject matter or materials discussed in the manuscript apart from those disclosed.
No writing assistance was utilized in the production of this manuscript.
References
Papers of special note have been highlighted as:
▪ of interest
▪▪ of considerable interest
- Topol EJ, Nissen SE: Our preoccupation withcoronary luminology. The dissociationbetween clinical and angiographic findings inischemic heart disease. Circulation 92(8),2333–2342 (1995).
- Mintz GS, Popma JJ, Pichard AD et al.:Limitations of angiography in the assessmentof plaque distribution in coronary arterydisease: a systematic study of target lesioneccentricity in 1446 lesions. Circulation93(5), 924–931 (1996).
- Brueren BR, ten Berg JM, Suttorp MJ et al.:How good are experienced cardiologists atpredicting the hemodynamic severity ofcoronary stenoses when taking fractional flowreserve as the gold standard. Int. J. Cardiovasc.Imaging 18(2), 73–76 (2002).
- Glagov S, Weisenberg E, Zarins CK,Stankunavicius R, Kolettis GJ: Compensatoryenlargement of human atheroscleroticcoronary arteries. N. Engl. J. Med. 316(22),1371–1375 (1987).
- Piek JJ, Boersma E, Di Mario C et al.:Angiographical and Doppler flow-derivedparameters for assessment of coronary lesionseverity and its relation to the results ofexercise electrocardiography. Eur. Heart J. 21,466–474 (2000).
- Kern MJ, Lerman A, Bech J-W et al.:Physiological assessment of coronary arterydisease in the cardiac catheterizationlaboratory: a Scientific Statement from theAmerican Heart Association Committee onDiagnostic and Interventional CardiacCatheterization, Council on ClinicalCardiology. Circulation 114(12), 1321–1341(2006).
- Sarno G, Decraemer I, Vanhoenacker PKet al.: On the inappropriateness ofnoninvasive multidetector computedtomography coronary angiography to triggercoronary revascularization: a comparison withinvasive angiography. 2(6), 550–557 (2009).
- Meijboom WB, Van Mieghem CAG,van Pelt N et al.: Comprehensive assessmentof coronary artery stenoses: computedtomography coronary angiography versusconventional coronary angiography andcorrelation with fractional flow reserve inpatients with stable angina. J. Am. Coll.Cardiol. 52(8), 636–643 (2008).
- Windecker S, Meier B: Intervention incoronary artery disease. Heart 83(4), 481–490(2000).
- Essed CE, Van den Brand M, Becker AE:Transluminal coronary angioplasty and earlyrestenosis. Fibrocellular occlusion after walllaceration. Br. Heart J. 49(4), 393–396(1983).
- Serruys PW, Luijten HE, Beatt KJ et al.:Incidence of restenosis after successfulcoronary angioplasty: a time-relatedphenomenon. A quantitative angiographicstudy in 342 consecutive patients at 1, 2, 3,and 4 months. Circulation 77(2), 361–371(1988).
- Kuntz RE, Baim DS: Defining coronaryrestenosis. Newer clinical and angiographicparadigms. Circulation 88(3), 1310–1323(1993).
- Levine GN, Chodos AP, Loscalzo J:Restenosis following coronary angioplasty:clinical presentations and therapeuticoptions. Clin. Cardiol. 18(12), 693–703(1995).
- Nobuyoshi M, Kimura T, Nosaka H et al.:Restenosis after successful percutaneoustransluminal coronary angioplasty: serialangiographic follow-up of 229 patients.J. Am. Coll. Cardiol. 12(3), 616–623(1988).
- Lowe HC, Oesterle SN, Khachigian LM:Coronary in-stent restenosis: current statusand future strategies. J. Am. Coll. Cardiol.39(2), 183–193 (2002).
- Morice M-C, Serruys PW, Sousa JEet al.: A randomized comparison of asirolimus-eluting stent with a standardstent for coronary revascularization. N. Engl.J. Med. 346(23), 1773–1780 (2002).
- Mosher P, Ross J Jr, McFate PA, Shaw RF:Control of coronary blood flow by anautoregulatory mechanism. Circ. Res. 14(3),250–259 (1964).
- Chilian WM, Layne SM, Klausner EC,Eastham CL, Marcus ML: Redistribution ofcoronary microvascular resistance producedby dipyridamole. Am. J. Physiol. 256(2 Pt 2),H383–H390 (1989).
- Hoffman JIE, Spaan JAE: Pressure-flowrelations in coronary circulation. Physiol. Rev.70(2), 331–390 (1990).
- Spaan JAE, Kolyva C, van den Wijngaard JPet al.: Coronary structure and perfusion inhealth and disease. Philos. Transact. A Math.Phys. Eng. Sci. 366(1878), 3137–3153 (2008).
- Kern MJ, Bach RG, Mechem CJ et al.:Variations in normal coronary vasodilatoryreserve stratified by artery, gender, hearttransplantation and coronary artery disease.J. Am. Coll. Cardiol. 28(5), 1154–1160(1996).
- Windecker S, Allemann Y, Billinger M et al.:Effect of endurance training on coronaryartery size and function in healthy men: aninvasive followup study. Am. J. Physiol.Heart Circ. Physiol. 282(6), H2216–H2223(2002).
- Gould KL, Lipscomb K, Hamilton GW:Physiologic basis for assessing criticalcoronary stenosis. Am. J. Cardiol. 33, 87–94(1974).
- Hoffman JIE: Maximal coronary flow andthe concept of coronary vascular reserve.Circulation 70, 153–159 (1984).
- Spaan JAE, Piek JJ, Hoffman JIE, Siebes M:Physiological basis of clinically used coronaryhemodynamic indices. Circulation 113(3),446–455 (2006).
- Hoffman JIE: Problems of coronary flowreserve. Ann. Biomed. Eng. 28(8), 884–896(2000).
- Gould KL, Kirkeeide RL, Buchi M:Coronary flow reserve as a physiologicmeasure of stenosis severity. J. Am. Coll.Cardiol. 15(2), 459–474 (1990).
- Wilson R, Marcus M, White C: Predictionof the physiologic significance of coronaryarterial lesions by quantitative lesiongeometry in patients with limited coronaryartery disease. Circulation 75(4), 723–732(1987).
- Seiler C, Kirkeeide RL, Gould KL: Basicstructure-function relations of the epicardialcoronary vascular tree. Basis of quantitativecoronary arteriography for diffuse coronaryartery disease. Circulation 85(6), 1987–2003(1992).
- Ofili E, Kern M, St Vrain JA et al.:Differential characterization of bloodflow, velocity, and vascular resistancebetween proximal and distal normalepicardial human coronary arteries:analysis by intracoronary Doppler spectralflow velocity. Am. Heart J. 130(1), 37–46(1995).
- Young DF: Fluid mechanics of arterialstenoses. J. Biomech. Eng. 101, 157–175(1979).
- Young DF, Cholvin NR, Kirkeeide RL,Roth AC: Hemodynamics of arterial stenosesat elevated flow rates. Circ. Res. 41(1), 99–107(1977).
- Gould KL: Pressure-flow characteristics ofcoronary stenoses in unsedated dogs at restand during coronary vasodilation. Circ. Res.43(2), 242–253 (1978).
- Siebes M, Verhoeff B-J, Meuwissen M,de Winter RJ, Spaan JAE, Piek JJ:Single-wire pressure and flow velocitymeasurement to quantify coronary stenosishemodynamics and effects of percutaneousinterventions. Circulation 109(6), 756–762(2004).
- Pijls NHJ, van Son JA, Kirkeeide RL,De Bruyne B, Gould KL: Experimental basisof determining maximum coronary,myocardial, and collateral blood flow bypressure measurements for assessingfunctional stenosis severity before and afterpercutaneous transluminal coronaryangioplasty. Circulation 87(4), 1354–1367(1993).
- Hanley FL, Messina LM, Grattan MT,Hoffman JIE: The effect of coronary inflowpressure on coronary vascular resistance in theisolated dog heart. Circ. Res. 54(6), 760–772(1984).
- Siebes M, Chamuleau SAJ, Meuwissen M,Piek JJ, Spaan JAE: Influence ofhemodynamic conditions on fractional flowreserve: parametric analysisof underlyingmodel. Am. J. Physiol. Heart Circ. Physiol.283(4), H1462–H1470 (2002).
- Meuwissen M, Chamuleau SAJ, Siebes Met al.: Role of variability in microvascularresistance on fractional flow reserve andcoronary blood flow velocity reserve inintermediate coronary lesions. Circulation103(2), 184–187 (2001).
- Chamuleau SAJ, Siebes M, Meuwissen M,Koch KT, Spaan JAE, Piek JJ: Associationbetween coronary lesion severity anddistal microvascular resistance in patientswith coronary artery disease. Am. J. Physiol.Heart Circ. Physiol. 285(5), H2194–H2200(2003).
- Chareonthaitawee P, Kaufmann PA,Rimoldi O, Camici PG: Heterogeneity ofresting and hyperemic myocardial blood flowin healthy humans. Cardiovasc. Res. 50(1),151–161 (2001).
- Hoffman JI: Heterogeneity of myocardialblood flow. Basic Res. Cardiol. 90(2), 103–111(1995).
- Verhoeff B-J, Siebes M, Meuwissen M et al.:Influence of percutaneous coronaryintervention on coronary microvascularresistance index. Circulation 111(1), 76–82(2005).
- Abildgaard A, Klow NE: A pressure-recordingguidewire for measuring arterial transstenoticgradients: in vivo validation. Acad. Radiol.2(1), 53–60 (1995).
- Doucette JW, Corl PD, Payne HM et al.:Validation of a Doppler guide wire forintravascular measurement of coronary arteryflow velocity. Circulation 85(5), 1899–1911(1992).
- Pijls NHJ, De Bruyne B, Smith L et al.:Coronary thermodilution to assess flowreserve. Validation in humans. Circulation105, 2482–2486 (2002).
- Pijls NHJ, Kern MJ, Yock PG, De Bruyne B:Practice and potential pitfalls of coronarypressure measurement. Cathet. Cardiovasc.Interv. 49(1), 1–16 (2000).
- De Bruyne B, Hersbach F, Pijls NHJ et al.:Abnormal epicardial coronary resistance inpatients with diffuse atherosclerosis but“normal” coronary angiography. Circulation104(20), 2401–2406 (2001).
- De Bruyne B, Pijls NHJ, Smith L,Wievegg M, Heyndrickx GR: Coronarythermodilution to assess flow reserve:experimental validation. Circulation 104(17),2003–2006 (2001).
- Barbato E, Aarnoudse W, Aengevaeren WRet al.: Validation of coronary flow reservemeasurements by thermodilution in clinicalpractice. Eur. Heart J. 25(3), 219–223 (2004).
- Aarnoudse W, van’t Veer M, Pijls NHJ et al.:Direct volumetric blood flow measurement incoronary arteries by thermodilution. J. Am.Coll. Cardiol. 50(24), 2294–2304 (2007).
- Wilson RF, Wyche K, Christensen BV,Zimmer S, Laxson DD: Effects of adenosineon human coronary arterial circulation.Circulation 82(5), 1595–1606 (1990).
- Kern MJ, Deligonul U, Tatineni S, Serota H,Aguirre F, Hilton TC: Intravenous adenosine:continuous infusion and low dose bolusadministration for determination of coronaryvasodilator reserve in patients with andwithout coronary artery disease. J. Am. Coll.Cardiol. 18(3), 718–729 (1991).
- Bartunek J, Wijns W, Heyndrickx GR,De Bruyne B: Effects of dobutamine oncoronary stenosis physiology and morphology– comparison with intracoronary adenosine.Circulation 100(3), 243–249 (1999).
- Jeremias A, Filardo SD, Whitbourn RJ et al.:Effects of intravenous and intracoronaryadenosine 5´-triphosphate as compared withadenosine on coronary flow and pressuredynamics. Circulation 101(3), 318–323(2000).
- De Bruyne B, Pijls NHJ, Barbato Eet al.: Intracoronary and intravenousadenosine 5´-triphosphate, adenosine,papaverine, and contrast medium toassess fractional flow reserve in humans.Circulation 107, 1877–1883 (2003).
- Pijls NHJ, De Bruyne B, Peels K et al:Measurement of fractional flow reserve toassess the functional severity of coronaryarterystenoses. N. Engl. J. Med. 334(26),1703–1708 (1996).
- Pijls NHJ, Van Gelder B, Van derVoort P et al.: Fractional flow reserve. Auseful index to evaluate the influence of anepicardial coronary stenosis on myocardialblood flow. Circulation 92(11), 3183–3193(1995).
- Siebes M, Spaan JAE, Meuwissen M, Piek JJ:Theoretical evaluation of the influence ofaortic pressure and zero-flow pressure onmyocardial fractional flow reserve. J. Am.Coll. Cardiol. 35(Suppl. A), 92 (2000).
- Perera D, Biggart S, Postema P et al.:Right atrial pressure: can it be ignoredwhen calculating fractional flow reserveand collateral flow index? J. Am. Coll. Cardiol.44(10), 2089–2091 (2004).
- Koo B-K, Kang H-J, Youn T-J et al.:Physiologic assessment of jailed sidebranch lesions using fractional flow reserve.J. Am. Coll. Cardiol. 46(4), 633–637(2005).
- Ziaee A, Parham WA, Herrmann SC,Stewart RE, Lim MJ, Kern MJ: Lack ofrelation between imaging and physiologyin ostial coronary artery narrowings.Am. J. Cardiol. 93(11), 1404–1407(2004).
- De Bruyne B, Bartunek J, Sys SU, Pijls NH,Heyndrickx G, Wijns W: Simultaneouscoronary pressure and flow velocitymeasurements in humans. Feasibility,reproducibility, and hemodynamicdependence of coronary flow velocity reserve,hyperemic flow versus pressure slope index,and fractional flow reserve. Circulation 94(8),1842–1849 (1996).
- Meuwissen M, Siebes M, Spaan JAE,Piek JJ: Rationale of combined intracoronarypressure and flow velocity measurements.Z. Kardiol. 91(Suppl. 3), 108–112 (2002).
- Uren NG, Camici PG, Melin JA et al.:Effect of aging on myocardial perfusionreserve. J. Nuclear Med. 36(11), 2032–2036(1995).
- Meuwissen M, Siebes M, Chamuleau SA,Tijssen JG, Spaan JA, Piek JJ: Intracoronarypressure and flow velocity for hemodynamicevaluation of coronary stenoses. Expert Rev.Cardiovasc. Ther. 1(3), 471–479 (2003).
- Siebes M, Vergroesen I, van Liebergen RAM,Meuwissen M, Piek JJ, Spaan JAE: Effect ofchanges in coronary resistance on fractionalflow reserve. Circulation 102(Suppl. II), 257(2000).
- Krams R, Kofflard MJ, Duncker DJ et al.:Decreased coronary flow reserve inhypertrophic cardiomyopathy is related toremodeling of the coronary microcirculation.Circulation 97(3), 230–233 (1998).
- Czernin J, Muller P, Chan S et al.: Influenceof age and hemodynamics on myocardialblood flow and flow reserve. Circulation88(1), 62–69 (1993).
- Bax M, de Winter RJ, Koch KT,Schotborgh CE, Tijssen JGP, Piek JJ: Timecourse of microvascular resistance of the infarctand noninfarct coronary artery following ananterior wall acute myocardial infarction.Am. J. Cardiol. 97(8), 1131–1136 (2006).
- Bax M, de Winter RJ, Schotborgh CE et al.:Short- and long-term recovery of leftventricular function predicted at the time ofprimary percutaneous coronary interventionin anterior myocardial infarction. J. Am. Coll.Cardiol. 43(4), 534–541 (2004).
- Marcus ML, Doty DB, Hiratzka LF,Wright CB, Eastham CL: Decreased coronaryreserve: a mechanism for angina pectoris inpatients with aortic stenosis and normalcoronary arteries. N. Engl. J. Med. 307(22),1362–1366 (1982).
- Sambuceti G, Marzilli M, Fedele S, Marini C,L’Abbate A: Paradoxical increase inmicrovascular resistance during tachycardiadownstream from a severe stenosis in patientswith coronary artery disease: reversal byangioplasty. Circulation 103(19), 2352–2360(2001).
- Sambuceti G, Marzilli M, Marraccini P et al.:Coronary vasoconstriction during myocardialischemia induced by rises in metabolic demandin patients with coronary artery disease.Circulation 95(12), 2652–2659 (1997).
- Nitenberg A, Ledoux SV, Valensi P,Sachs RG, Attali J-R, Antony I: Impairmentof coronary microvascular dilation in responseto cold pressor – induced sympatheticstimulation in Type 2 diabetic patients withabnormal stress thallium imaging. Diabetes50(5), 1180–1185 (2001).
- Campisi R, Czernin J, Schoder H et al.:Effects of long-term smoking on myocardialblood flow, coronary vasomotion, andvasodilator capacity. Circulation 98(2),119–125 (1998).
- Nahser PJ Jr, Brown RE, Oskarsson H,Winniford MD, Rossen JD: Maximalcoronary flow reserve and metaboliccoronary vasodilation in patients withdiabetes mellitus. Circulation 91(3), 635–640(1995).
- Nitenberg A, Valensi P, Sachs R, Dali M,Aptecar E, Attali JR: Impairment ofcoronary vascular reserve and ACh-inducedcoronary vasodilation in diabetic patientswith angiographically normal coronaryarteries and normal left ventricularsystolic function. Diabetes 42(7), 1017–1025(1993).
- Gould K, Hamilton G, Lipscomb K,Ritchie J, Kennedy J: Method for assessingstress-induced regional malperfusion duringcoronary arteriography. Experimentalvalidation and clinical application. Am. J.Cardiol. 34(5), 557–564 (1974).
- Mancini G, Cleary R, DeBoe S, Moore N,Gallagher K: Instantaneous hyperemicflow-versus-pressure slope index. Microspherevalidation of an alternative to measures ofcoronary reserve. Circulation 84(2), 862–870(1991).
- Mancini GB, McGillem MJ, DeBoe SF,Gallagher KP: The diastolic hyperemic flowversus pressure relation. A new index ofcoronary stenosis severity and flow reserve.Circulation 80(4), 941–950 (1989).
- Di Mario C, Krams R, Gil R,Serruys PW: Slope of the instantaneoushyperemic diastolic coronary flowvelocity–pressure relation. A new indexfor assessment of the physiologicalsignificance of coronary stenosis in humans.Circulation 90(3), 1215–1224 (1994).
- Marques KMJ, Spruijt HJ, Boer C,Westerhof N, Visser CA, Visser FC: Thediastolic flow-pressure gradient relation incoronary stenoses in humans. J. Am. Coll.Cardiol. 39(10), 1630–1636 (2002).
- Marques KMJ, van Eenige MJ,Spruijt HJ et al.: The diastolic flowvelocity–pressure gradient relation anddpv50 to assess the hemodynamicsignificance of coronary stenoses. Am. J.Physiol. Heart Circ. Physiol. 291(6), H2630–H2635 (2006).
- Meuwissen M, Siebes M, Chamuleau SAJet al.: Hyperemic stenosis resistanceindex for evaluation of functional coronarylesion severity. Circulation 106, 441–446(2002).
- Verberne HJ, Meuwissen M, Chamuleau SAJet al.: Effect of simultaneous intracoronaryguidewires on the predictive accuracy offunctional parameters of coronary lesionseverity. Am. J. Physiol. Heart Circ. Physiol.292(5), H2349–H2355 (2007).
- De Bruyne B, Bartunek J, Sys SU,Heyndrickx GR: Relation betweenmyocardial fractional flow reserve calculatedfrom coronary pressure measurements andexercise-induced myocardial ischemia.Circulation 92(1), 39–46 (1995).
- De Bruyne B, Pijls NHJ, Bartunek J et al.:Fractional flow reserve in patients with priormyocardial infarction. Circulation 104(2),157–162 (2001).
- Bartunek J, Van Schuerbeeck E, de Bruyne B:Comparison of exercise electrocardiographyand dobutamine echocardiography withinvasively assessed myocardial fractional flowreserve in evaluation of severity of coronaryarterial narrowing. Am. J. Cardiol. 79(4),478–481 (1997).
- Bartunek J, Marwick TH, Rodrigues ACet al.: Dobutamine-induced wall motionabnormalities: correlations with myocardialfractional flow reserve and quantitativecoronary angiography. J. Am. Coll. Cardiol.27(6), 1429–1436 (1996).
- Abe M, Tomiyama H, Yoshida H, Doba N:Diastolic fractional flow reserve to assess thefunctional severity of moderate coronary arterystenoses: comparison with fractional flowreserve and coronary flow velocity reserve.Circulation 102(19), 2365–2370 (2000).
- Chamuleau SAJ, Meuwissen M,Van Eck‑Smit BLF et al.: Fractional flowreserve, absolute and relative coronary bloodflow velocity reserve in relation to the results oftechnetium‑99m sestamibi single-photonemission computed tomography in patientswith two-vessel coronary artery disease. J. Am.Coll. Cardiol. 37(5), 1316–1322 (2001).
- Caymaz O, Fak A, Tezcan H et al.:Correlation of myocardial fractional flowreserve with thallium‑201 SPECT imaging inintermediate-severity coronary artery lesions.J. Invasive Cardiol. 12(7), 345–350 (2000).
- Fearon W, Takagi A, Jeremias A et al.: Use offractional myocardial flow reserve to assessthe functional significance of intermediatecoronary stenoses. Am. J. Cardiol. 86(9),1013–1014 (2000).
- Jiménez-Navarro M, Alonso-Briales JH,Hernández García MJ, Rodríguez Bailón I,Gómez-Doblas JJ, de Teresa Galván E:Measurement of fractional flow reserve toassess moderately severe coronary lesions:correlation with dobutamine stressechocardiography. J. Interv. Cardiol. 14(5),499–504 (2001).
- Seo JK, Kwan J, Suh JH et al.: Earlydipyridamole stress myocardial SPECT todetect residual stenosis of infarct relatedartery: comparison with coronaryangiography and fractional flow reserve.Korean J. Intern. Med. 17(1), 7–13 (2002).
- Usui Y, Chikamori T, Yanagisawa H et al.:Reliability of pressure-derived myocardialfractional flow reserve in assessing coronaryartery stenosis in patients with previousmyocardial infarction. Am. J. Cardiol. 92(6),699–702 (2003).
- Yanagisawa H, Chikamori T, Tanaka Net al.: Correlation between thallium‑201myocardial perfusion defects and thefunctional severity of coronary artery stenosisas assessed by pressure-derived myocardialfractional flow reserve. Circ. J. 66(12),1105–1109 (2002).
- Morishima T, Chikamori T, Hatano T,Tanaka N, Takazawa K, Yamashina A:Correlation between myocardial uptake oftechnetium‑99m-sestamibi and pressurederivedmyocardial fractional flow reserve.J. Cardiol. 43(4), 155–163 (2004).
- Rieber J, Jung P, Erhard I et al.:Comparison of pressure measurement,dobutamine contrast stress echocardiographyand SPECT for the evaluation of intermediatecoronary stenoses. The COMPRESStrial. Acute Cardiac. Care 6(3), 142–147(2004).
- Kobori Y, Tanaka N, Takazawa K,Yamashina A: Usefulness of fractionalflow reserve in determining the indication oftarget lesion revascularization. CatheterCardiovasc. Interv. 65(3), 355–360 (2005).
- Erhard I, Rieber J, Jung P et al.:The validation of fractional flow reserve inpatients with coronary multivessel disease: acomparison with SPECT and contrastenhanceddobutamine stressechocardiography. Z. Kardiol. 94(5), 321–327(2005).
- Hacker M, Rieber J, Schmid R et al.:Comparison of tc-99m sestamibi SPECTwith fractional flow reserve in patientswith intermediate coronary artery stenoses.J. Nucl. Cardiol. 12(6), 645–654 (2005).
- Ragosta M, Bishop AH, Lipson LC et al.:Comparison between angiography andfractional flow reserve versus single-photonemission computed tomographic myocardialperfusion imaging for determining lesionsignificance in patients with multivesselcoronary disease. Am. J. Cardiol. 99(7),896–902 (2007).
- Aqel R, Zoghbi GJ, Hage F, Dell’Italia L,Iskandrian AE: Hemodynamic evaluation ofcoronary artery bypass graft lesions usingfractional flow reserve. Catheter Cardiovasc.Interv. 72(4), 479–485 (2008).
- Kruger S, Koch KC, Kaumanns Iet al.: Use of fractional flow reserve versusstress perfusion scintigraphy in stentrestenosis. Eur. J. Intern. Med. 16(6),429–431 (2005).
- Samady H, Lepper W, Powers ER et al.:Fractional flow reserve of infarct-relatedarteries identifies reversible defects onnoninvasive myocardial perfusion imagingearly after myocardial infarction. J. Am. Coll.Cardiol. 47(11), 2187–2193 (2006).
- Joye JD, Schulman DS, Lasorda D, Farah T,Donohue BC, Reichek N: IntracoronaryDoppler guide wire versus stress single-photonemission computed tomographic thallium‑201imaging in assessment of intermediatecoronary stenoses. J. Am. Coll. Cardiol. 24(4),940–947 (1994).
- Miller DD, Donohue TJ, Younis LT et al.:Correlation of pharmacological 99mtc-sestamibimyocardial perfusion imaging with poststenoticcoronary flow reserve in patients withangiographically intermediate coronary arterystenoses. Circulation 89(5), 2150–2160 (1994).
- Deychak YA, Segal J, Reiner JS et al.: Dopplerguide wire flow-velocity indexes measureddistal to coronary stenoses associated withreversible thallium perfusion defects.Am. Heart J. 129(2), 219–227 (1995).
- Tron C, Donohue TJ, Bach RG et al.:Comparison of pressure-derived fractionalflow reserve with poststenotic coronary flowvelocity reserve for prediction of stressmyocardial perfusion imaging results.Am. Heart J. 130(4), 723–733 (1995).
- Donohue TJ, Miller DD, Bach RG et al.:Correlation of poststenotic hyperemiccoronary flow velocity and pressure withabnormal stress myocardial perfusion imagingin coronary artery disease. Am. J. Cardiol.77(11), 948–954 (1996).
- Heller LI, Cates C, Popma J et al.: IntracoronaryDoppler assessment of moderate coronary arterydisease: comparison with 201Tl imaging andcoronary angiography. Facts study group.Circulation 96(2), 484–490 (1997).
- Schulman DS, Lasorda D, Farah T, Soukas P,Reichek N, Joye JD: Correlations betweencoronary flow reserve measured with aDoppler guide wire and treadmill exercisetesting. Am. Heart J. 134(1), 99–104 (1997).
- Danzi GB, Pirelli S, Mauri L et al.: Whichvariable of stenosis severity best describes thesignificance of an isolated left anteriordescending coronary artery lesion? Correlationbetween quantitative coronary angiography,intracoronary Doppler measurements and highdose dipyridamole echocardiography. J. Am.Coll. Cardiol. 31(3), 526–533 (1998).
- Verberne HJ, Piek JJ, van Liebergen RAM,Koch KT, Schroeder-Tanka JM,van Royen EA: Functional assessment ofcoronary artery stenosis by Doppler derivedabsolute and relative coronary blood flowvelocity reserve in comparison with Tc-99mMIBI SPECT. Heart 82(4), 509–514 (1999).
- Piek JJ, Boersma E, di Mario C et al.:Angiographical and Doppler flow-derivedparameters for assessment of coronary lesionseverity and its relation to the result of exerciseelectrocardiography. DEBATE study group.Doppler endpoints balloon angioplasty trialEurope. Eur. Heart J. 21(6), 466–474 (2000).
- Duffy SJ, Gelman JS, Peverill RE, GreentreeMA, Harper RW, Meredith IT: Agreementbetween coronary flow velocity reserve andstress echocardiography in intermediateseveritycoronary stenoses. CatheterCardiovasc. Interv. 53(1), 29–38 (2001).
- El-Shafei A, Chiravuri R, Stikovac M et al.:Comparison of relative coronary Doppler flowvelocity reserve to stress myocardial perfusionimaging in patients with coronary arterydisease. Catheter Cardiovasc. Interv. 53(2),193–201 (2001).
- Salm LP, Bax JJ, Jukema JW et al.:Hemodynamic evaluation of saphenous veincoronary artery bypass grafts: relative meritsof Doppler flow velocity and SPECTperfusion imaging. J. Nucl. Cardiol. 12(5),545–552 (2005).
- Voudris V, Avramides D, Koutelou M et al.:Relative coronary flow velocity reserveimproves correlation with stress myocardialperfusion imaging in assessment of coronaryartery stenoses. Chest 124(4), 1266–1274(2003).
- Bech GJW, De Bruyne B, Bonnier HJ et al.:Long-term follow-up after deferral ofpercutaneous transluminal coronaryangioplasty of intermediate stenosis on thebasis of coronary pressure measurement.J. Am. Coll. Cardiol. 31(4), 841–847 (1998).
- Bech GJW, De Bruyne B, Pijls NHJ et al.:Fractional flow reserve to determine theappropriateness of angioplasty in moderatecoronary stenosis: a randomized trial.Circulation 103(24), 2928–2934 (2001).
- Rieber J, Jung P, Koenig A et al.: Five-yearfollow-up in patients after therapy stratificationbased on intracoronary pressure measurement.Am. Heart J. 153(3), 403–409 (2007).
- Rieber J, Jung P, Schiele TM et al.: Safety ofFFR-based treatment strategies: the Munichexperience. Z. Kardiol. 91(15), III115–III119(2002).
- Rieber J, Schiele TM, Koenig A et al.:Long-term safety of therapy stratification inpatients with intermediate coronary lesionsbased on intracoronary pressure measurements.Am. J. Card. 90, 1160–1164 (2002).
- Chamuleau SA, van Eck-Smit BL, Meuwissen M et al.: Long-term prognosticvalue of CFVR and FFR versus perfusionscintigraphy in patients with multivesseldisease. Neth. Heart J. 15(11), 369–374(2007).
- Lavi S, Rihal CS, Yang EH et al.: The effectof drug eluting stents on cardiovascular eventsin patients with intermediate lesions andborderline fractional flow reserve. CatheterCardiovasc. Interv. 70(4), 525–531 (2007).
- Meuwissen M, Chamuleau SAJ, Siebes M et al.: The prognostic value of combinedintracoronary pressure and blood flow velocitymeasurements after deferral of percutaneouscoronary intervention. Catheter. Cardiovasc.Interv. 71(3), 291–297 (2008).
- Chamuleau SAJ, Meuwissen M, Koch KTet al.: Usefulness of fractional flow reserve forrisk stratification of patients with multivesselcoronary artery disease and an intermediatestenosis. Am. J. Cardiol. 89(4), 377–380(2002).
- Ozdemir M, Timurkaynak T, Cemri M et al.:Medium-term follow-up of intermediatecoronary stenoses left unrevascularized basedon myocardial fractional flow reservefindings. Acta Cardiol. 57(5), 335–340(2002).
- Leesar MA,, Abdul-Baki T, Akkus NI,Sharma A, Kannan T, Bolli R: Use offractional flow reserve versus stressperfusion scintigraphy after unstable angina.Effect on duration of hospitalization, cost,procedural characteristics, and clinicaloutcome. J. Am. Coll. Cardiol. 41(7),1115–1121 (2003).
- Legalery P, Schiele F, Seronde MF et al.:One-year outcome of patients submitted toroutine fractional flow reserve assessment todetermine the need for angioplasty. Eur. Heart J. 26(24), 2623–2629 (2005).
- Lopez-Palop R, Pinar E, Lozano I, Saura D,Pico F, Valdes M: Utility of the fractionalflow reserve in the evaluation ofangiographically moderate in-stent restenosis.Eur. Heart J. 25(22), 2040–2047 (2004).
- Jasti V, Ivan E, Yalamanchili V,Wongpraparut N, Leesar MA: Correlationsbetween fractional flow reserve andintravascular ultrasound in patients with anambiguous left main coronary artery stenosis.Circulation 110(18), 2831–2836 (2004).
- Mates M, Hrabos V, Hajek P, Rataj O,Vojacek J: Long-term follow-up afterdeferral of coronary intervention based onmyocardial fractional flow reservemeasurement. Coron. Artery Dis. 16(3),169–174 (2005).
- Berger A, Botman KJ, MacCarthy PA et al.:Long-term clinical outcome after fractionalflow reserve-guided percutaneous coronaryintervention in patients with multivesseldisease. J. Am. Coll. Cardiol. 46(3), 438–442(2005).
- Kruger S, Koch K-C, Kaumanns I,Merx MW, Hanrath P, Hoffmann R:Clinical significance of fractional flowreserve for evaluation of functional lesionseverity in stent restenosis and nativecoronary arteries. Chest 128(3), 1645–1649(2005).
- Verna E, Lattanzio M, Ghiringhelli S,Provasoli S, Caico SI: Performing versusdeferring coronary angioplasty based onfunctional evaluation of vessel stenosis bypressure measurements: a clinical outcomestudy. J. Cardiovasc. Med. (Hagerstown) 7(3),169–175 (2006).
- Pijls NHJ, van Schaardenburgh P,Manoharan G et al.: Percutaneous coronaryintervention of functionally nonsignificantstenosis: 5‑year follow-up of the DEFERstudy. J. Am. Coll. Cardiol. 49(21),2105–2111 (2007).
- Bech GJ, Droste H, Pijls NH et al.: Value offractional flow reserve in making decisionsabout bypass surgery for equivocal left maincoronary artery disease. Heart 86(5), 547–552(2001).
- Lindstaedt M, Yazar A, Germing A et al.:Clinical outcome in patients withintermediate or equivocal left main coronaryartery disease after deferral of surgicalrevascularization on the basis of fractionalflow reserve measurements. Am. Heart J.152(1), 156 E1–E9 (2006).
- Fischer JJ, Wang XQ, Samady H et al.:Outcome of patients with acute coronarysyndromes and moderate coronary lesionsundergoing deferral of revascularizationbased on fractional flow reserve assessment.Catheter Cardiovasc. Interv. 68(4), 544–548(2006).
- Hernandez Garcia MJ, Alonso-Briales JH,Jimenez-Navarro M, Gomez-Doblas JJ,Rodriguez Bailon I, de Teresa Galvan E:Clinical management of patients withcoronary syndromes and negative fractionalflow reserve findings. J. Interv. Cardiol. 14(5),505–509 (2001).
- Domínguez-Franco AJ, Jiménez-Navarro MF,Muñoz-García AJ, Alonso-Briales JH,Hernández-García JM, Galván EdT:Long-term prognosis in diabetic patients inwhom revascularization is deferred followingfractional flow reserve assessment. Rev. Esp.Cardiol. (English Edition) 61(4), 352–359(2008).
- Courtis J, Rodes-Cabau J, Larose E et al.:Usefulness of coronary fractional flow reservemeasurements in guiding clinical decisions inintermediate or equivocal left main coronarystenoses. Am. J. Cardiol. 103(7), 943–949(2009).
- Potvin JM, Rodes-Cabau J, Bertrand OFet al.: Usefulness of fractional flow reservemeasurements to defer revascularization inpatients with stable or unstable anginapectoris, non-ST-elevation and ST-elevationacute myocardial infarction, or atypical chestpain. Am. J. Cardiol. 98(3), 289–297 (2006).
- Courtis J, Rodes-Cabau J, Larose E et al.:Comparison of medical treatment andcoronary revascularization in patients withmoderate coronary lesions and borderlinefractional flow reserve measurements. CatheterCardiovasc. Interv. 71(4), 541–548 (2008).
- Botman KJ, Pijls NH, Bech JW et al.:Percutaneous coronary intervention or bypasssurgery in multivessel disease? A tailoredapproach based on coronary pressuremeasurement. Catheter Cardiovasc. Interv.63(2), 184–191 (2004).
- Wongpraparut N, Yalamanchili V, Pasnoori Vet al.: Thirty-month outcome after fractionalflow reserve-guided versus conventionalmultivessel percutaneous coronary intervention.Am. J. Cardiol. 96(7), 877–884 (2005).
- Tonino PAL, De Bruyne B, Pijls NHJ et al.:Fractional flow reserve versus angiography forguiding percutaneous coronary intervention.N. Engl. J. Med. 360(3), 213–224 (2009).
- Serruys PW, Morice M-C, Kappetein APet al.: Percutaneous coronary interventionversus coronary-artery bypass grafting forsevere coronary artery disease. N. Engl. J.Med. 360(10), 961–972 (2009).
- Brar SS, Gray WA, Nagajothi N et al.:Fractional flow reserve for guiding PCI.N. Engl. J. Med. 360(19), 2024–2027 (2009).
- Kern MJ, Donohue TJ, Aguirre FV et al.:Clinical outcome of deferring angioplasty inpatients with normal translesional pressureflowvelocity measurements. J. Am. Coll.Cardiol. 25(1), 178–187 (1995).
- Ferrari M, Schnell B, Werner GS, Figulla HR:Safety of deferring angioplasty in patientswith normal coronary flow velocity reserve.J. Am. Coll. Cardiol. 33(1), 82–87 (1999).
- Chamuleau SAJ, Tio RA, de Cock CC et al.:Prognostic value of coronary blood flowvelocity and myocardial perfusion inintermediate coronary narrowings andmultivessel disease. J. Am. Coll. Cardiol.39(5), 852–858 (2002).
- Wijpkema JS, Van der Vleuten PA,Jessurun GA, Tio RA: Long-term safety ofintracoronary haemodynamic assessment fordeferral of angioplasty in intermediatecoronary stenoses: a 5‑year follow-up. ActaCardiol. 60(2), 207–211 (2005).
- Kawamoto T, Yoshida K, Akasaka T et al.:Can coronary blood flow velocity patternafter primary percutaneous transluminalcoronary angiography predict recovery ofregional left ventricular function in patientswith acute myocardial infarction? Circulation100(4), 339–345 (1999).
- Piek JJ, Koch KT, van Liebergen R, Peters RJ,David GK: Assessment of collateral flow duringballoon coronary occlusion by intracoronaryblood flow velocity analysis.Cathet. Cardiovasc. Diagn. 35(4), 362–367 (1995).
- Piek JJ, van Liebergen RA, Koch KT,Peters RJ, David GK: Clinical, angiographicand hemodynamic predictors of recruitablecollateral flow assessed during balloonangioplasty coronary occlusion. J. Am. Coll.Cardiol. 29(2), 275–282 (1997).
- Piek JJ, van Liebergen RA, Koch KT,Peters RJ, David GK: Comparison ofcollateral vascular responses in the donor andrecipient coronary artery during transientcoronary occlusion assessed by intracoronaryblood flow velocity analysisin patients. J. Am.Coll. Cardiol. 29(7), 1528–1535 (1997).
- Seiler C, Fleisch M, Billinger M, Meier B:Simultaneous intracoronary velocity- andpressure-derived assessment of adenosineinducedcollateral hemodynamics in patientswith one- to two-vessel coronary arterydisease. J. Am. Coll. Cardiol.. 34(7),1985–1994 (1999).
- Seiler C, Pohl T, Lipp E, Hutter D, Meier B:Regional left ventricular function duringtransient coronary occlusion: relation withcoronary collateral flow. Heart 88(1), 35–42(2002).
- Pijls NH, Bech GJ, el Gamal MI et al.:Quantification of recruitable coronarycollateral blood flow in conscious humans andits potential to predict future ischemic events.J. Am. Coll. Cardiol. 25(7), 1522–1528 (1995).
- Meier P, Gloekler S, Zbinden R et al.:Beneficial effect of recruitable collaterals: a10‑year follow-up study in patients with stablecoronary artery disease undergoingquantitative collateral measurements.Circulation 116(9), 975–983 (2007).
- Fearon WF, Balsam LB, Farouque HMOet al.: Novel index for invasively assessing thecoronary microcirculation. Circulation107(25), 3129–3132 (2003).
- Aarnoudse W, Fearon WF, Manoharan Get al.: Epicardial stenosis severity does notaffect minimal microcirculatory resistance.Circulation 110(15), 2137–2142 (2004).
- Sun YH, Anderson TJ, Parker KH,Tyberg JV: Wave-intensity analysis:a newapproach to coronary hemodynamics. J. Appl.Physiol. 89(4), 1636–1644 (2000).
- Sun YH, Anderson TJ, Parker KH,Tyberg JV: Effects of left ventricularcontractility and coronary vascular resistanceon coronary dynamics. Am. J. Physiol. HeartCirc. Physiol. 286(4), H1590–H1595 (2004).
- Hoffman JI, Chilian WM: Brief commentaryon coronary wave-intensity analysis.J. Appl.Physiol. 89(4), 1633–1635 (2000).
- Kolyva C, Verhoeff B, Piek J, Spaan J,Siebes M: Coronary wave intensity analysisprovides independent evidence for pressuredependenceof minimal coronarymicrovascular resistance in humans.Circulation 112(Suppl. II), II–767 (2005).
- Kolyva C, Spaan JAE, Verhoeff B-J,Piek JJ, Siebes M: Coronary wave intensityin humans: effect of changes inmicrovascular resistance and hemodynamicconditions. J. Biomechanics 39(Suppl. 1),S300 (2006).
- Davies JE, Whinnett ZI, Francis DP et al.:Evidence of a dominant backwardpropagating“suction” wave responsible fordiastolic coronary filling in humans,attenuated in left ventricular hypertrophy.Circulation 113(14), 1768–1778 (2006).
- Parker K: An introduction to wave intensityanalysis.Med. Biol. Eng. Comput. 47(2),175–188 (2009).
- Siebes M, Kolyva C, Verhoeff B-J,Piek J, Spaan J: Potential and limitations ofwave intensity analysisin coronary arteries.Med. Biol. Eng. Comput. 47(2), 233–239(2009).
- Kolyva C, Verhoeff B-J, Spaan JAE,Piek JJ, Siebes M: Increased diastolictime fraction as beneficial adjunct ofa1‑adrenergic receptor blockade afterpercutaneous coronary intervention.Am. J. Physiol. Heart Circ. Physiol. 295(5),H2054–H2060 (2008).
- Piek JJ: Beyond epicardial reperfusion.N. Engl. J. Med. 356(18), 1880–1882 (2007).
- Schirmer SH, Fledderus JO, Bot PTGet al.: Interferon‑b signaling is enhanced inpatients with insufficient coronary collateralartery development and inhibits arteriogenesisin mice. Circ. Res. 102(10), 1286–1294(2008).
▪ Review of physiological stenosis assessment in clinical practice.
▪ Review of coronary microcirculation in relation to clinically used indices.
▪ Basic science for clinicians on issues of microvascular resistance and collateral flow with regard to clinical coronary indices.
▪ Review of conceptual basis for coronary flow reserve.
▪ Combined pressure and flow with a dual-sensor guidewire to assess coronary stenosis and microvascular resistance.
▪ Experimental basis for the model underlying fractional flow reserve.
▪ Analysis of potential pitfalls with respect to the model underlying myocardial fractional flow reserve.
▪ Rationale for the use of combined intracoronary pressure and flow to reduce effect of microvascular resistance in diagnosis of coronary stenosis severity.
▪ Clinical study showing pressure dependence of coronary resistance vessels in humans and impaired autoregulatory capacity after percutaneous coronary intervention.
▪ Results of the FAME study showing superiority of physiological stenosis assessment to guide percutaneous coronary intervention.