Perspective Article - Imaging in Medicine (2011) Volume 3, Issue 2
Radiation dosimetry in CT: the role of the manufacturer
Walter Huda*
Department of Radiology& Radiological Science, 96 Jonathan Lucas St, MSC 323, Charleston SC 29425-3230, USA
- *Corresponding Author:
- Walter Huda
Department of Radiology &
Radiological Science, 96 Jonathan
Lucas St, MSC 323, Charleston
SC 29425-3230, USA
Tel.: +1 843 792 5977
Fax: +1 843 792 2642
E-mail: huda@musc.edu
Abstract
This article provides an overview of CT dose indices (CTDIs) currently used to quantify the amount of radiation used to perform clinical CT examinations. The manner in which CTDI metrics can be used to estimate the amount of radiation received by any given patient undergoing a CT examination is explained. The role of the manufacturer in providing information on the amount of radiation used to perform CT scans, as well as the corresponding patient doses, is addressed. Manufacturers have specific obligations to provide data on the quantity and quality of the x-ray radiation that is incident on patients, and should also be required to indicate whether this amount is reasonable, taking into account patient characteristics (i.e., size) and the imaging task. Manufacturers could also develop software that would provide conversion factors to enable operators to translate CT output into patient doses. Technological advances in CT scanners, and specifically cone beam CT which use wide x-ray beams, will require modification or replacement of current CTDI metrics. Alternatives to current CTDI metrics are described, and manufacturers need to assess their suitability for specifying the amount of radiation emitted by CT scanners in clinical examinations.
Keywords
CT dose index; dose–length product; effective dose; imaging vendors; organ dose; radiation; volume CT dose index
In 2006, the average medical radiation effective dose to which the US population was exposed was estimated at approximately 3 mSv per year [1]. Compared to the 1980s, this per capita medical radiation dose value has increased by approximately 600%, and is now comparable to the annual exposure from natural background radiation. Medical imaging using ionizing radiation is recognized as providing valuable diagnostic information that offers substantial benefits to most patients [2]. Exposure to radiation, however, is currently believed to carry a small risk of carcinogenesis [3,4]. Consequently, those responsible for medical imaging must ensure that patient medical examinations have benefits that exceed the radiation risks [5]. Imaging practitioners also need to adopt the As Low As Reasonably Achievable (ALARA) principle, which means that no more radiation should be used than needed for obtaining diagnostic information in a radiological examination [5]. The direct corollary of these requirements is that imaging practitioners must understand how much radiation is being used in any radiological examination, how much radiation is absorbed by patients, as well as the corresponding radiological risks [6].
CT is the largest contributor to population medical doses, and in the USA, this imaging modality alone was reported to account for approximately 50% of the per capita medical dose in 2006 [1]. Current CT scanners use dosimetry metrics based on the CT dose index (CTDI) [7]. CTDI data quantify the amount of radiation that is used to perform a given CT examination, and are related to patient doses by means of generic ‘dose/CTDI’ conversion factors [8]. All dose/CTDI conversion factors need to take into account the characteristics of the x-ray beam, as well as the body region and size of the patient being irradiated [9,10]. Organ and effective doses, in turn, can be used to quantify any radiation risks to patients [6]. Radiation risks are especially important in CT imaging because these are required to identify indicated examinations where patient benefits are greater than the corresponding risks. Furthermore, awareness of patient risks is likely to encourage operators to follow the ALARA principle with respect to their patients [11].
In this article, an overview of CTDI dose metrics is provided, together with an outline of how CTDI dose metrics are related to the amount of radiation received by any given patient undergoing a CT examination. The role and responsibilities of the manufacturers in providing information on the amount of radiation used to perform CT scans, as well as the corresponding patient doses, are addressed. Technological advances in CT scanners and, specifically, conebeam CT [12], which uses wide x-ray beams, will require the replacement or modifications of CTDI metrics. Alternatives to current CTDI metrics are discussed, and manufacturers will need to assess their suitability for specifying the amount of radiation emitted by CT scanners in clinical examinations, and how these can be related to patient doses.
CT dosimetry
CT dose index
The amount of radiation used in CT examinations is quantified using the CTDI [7,13]. Most CTDIs are currently measured using a 100-mmlong pencil-shaped ionization chamber (i.e., CTDI100) that integrates radiation intensity profiles in the direction perpendicular to the imaging plane [14,15]. CTDIs are normally obtained for a single rotation of the x-ray tube, and are expressed as air kerma (AK; mGy). Measurements obtained at the CT isocenter, in the absence of any phantom, are known as CTDIair. Most CTDI measurements are made in one of two phantom sizes that are normally referred to as the head (16-cm diameter) and body (32-cm diameter). Phantom measurements are generally obtained in the periphery and center of a given phantom that help ensure that the effects of beam-shaping filters are taken into account. The weighted CTDI (CTDIw) is defined as a third of the central CTDI and two-thirds of the peripheral CTDI [16]. For fixed techniques and CT x-ray beam filtrations, CTDIw in a 32-cm (body) phantom will be approximately half the corresponding value in a 16-cm (head) phantom [17].
Many CT examinations are performed in helical scanning, characterized by the CT pitch that is obtained by dividing the distance traveled by the patient table per x-ray tube rotation by the nominal x-ray beam width at the CT isocenter. A pitch of unity results in a pattern of energy deposition similar to that associated with contiguous axial scanning. By comparison, CT pitch values that are greater than 1 will reduce patient doses, and vice versa. The volume CTDI (CTDIvol) is defined as CTDIw divided by CT pitch, and provides an estimate of the average phantom dose for a complete helical scan [18]. CTDIvol depends on the choice of x-ray techniques (kV, mAs) and CT pitch, but is independent of patient characteristics.
The volume CTDI is termed as the CT beam intensity, because its value is independent of scan length. On a CT scanner operated in helical mode for fixed techniques (i.e., kV, mAs and pitch), use of a scan length of 10 cm would generate exactly the same CTDIvol value as selection of a scan length of 100 cm, even though the latter generally deposit approximately ten-times more energy into the patient. Multiplying CTDIvol by the corresponding scan length generates the dose–length product (DLP). The DLP parameter thus accounts for both radiation intensity (i.e., CTDIvol) and scan length in the CT examination, and are also provided on the CT console at the completion of each patient scan. Table 1 provides an overview of current CTDI dose metrics, which are an important tool for monitoring and optimizing patient doses in diagnostic radiology [19].
Patient doses
For a CT scan of length (L), starting in the midthigh region, the normalized absorbed dose to an organ (D’organ[L]) is defined as the organ dose divided by the corresponding CTDIvol [20]. Figure 1 shows an example of the normalized absorbed dose to the liver as a function of scan length for an averaged-sized adult patient weighing a nominal 70 kg. For this size patient, the liver dose will be 1.45 × CTDIvol for a whole-body scan because the liver dose is approximately 45% higher than the CTDIvol on current CT scanners [21,101]. The liver dose for a normal-sized adult scanned from L1 to L2 may then be obtained using the formula:
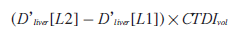
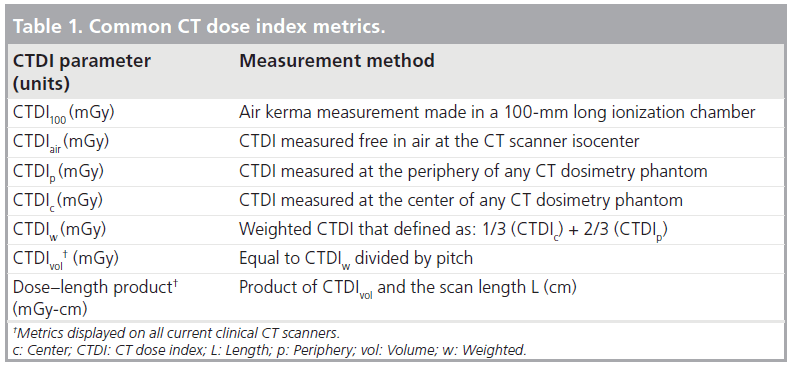

Figure 1.Liver dose normalized by the corresponding volume CT dose index for a GE VCT scanner operated at 120 kV, generated using the ImPACT CT Patient Dosimetry Calculator. Scans commence at the upper thigh region and end at the top of the head.
where CTDIvol is the value used to perform the specified clinical examination. This methodology can be used to obtain organ doses of any scan length, but the resultant organ doses are only valid for individuals whose physical characteristics are comparable to the 70-kg anthropomorphic phantom used by the ImPACT Patient CT Dosimetry Calculator to generate D’liver(L) [21,101]. Organ doses derived in this manner can be used to estimate the likelihood of a deterministic effect, as well as the organ stochastic risk [3,4].
The effective dose (E) is generally recognized as a parameter that is directly related to the patient stochastic risk [6], and permits direct comparisons to be made for different types of radiation exposure [22–24]. Values of DLP can be used to estimate patient effective doses [9,25]. Figure 2 shows how the E/DLP conversion factor varies along the long patient axis z and show the locations of radiosensitive organs, such as the thyroid (z = ~72 cm) and the breasts (z = ~52 cm). Calculations were performed for a GE VCT operated at 120 kV, with effective doses computed using International Commission on Radiological Protection (ICRP) Publication 103 tissue-weighting factors. Values of E/DLP in Figure 2 are provided for CT output (CTDIvol and DLP) measured in 32- and 16-cm diameter phantoms. When a 32-cm phantom is replaced by a 16-cm phantom, DLP data are approximately doubled, and E/DLP conversion factors will be approximately halved, and patient doses (always) remain unchanged. As with organ doses, the E/DLP conversion factors are only valid for adult patients of approximately 70 kg, and may need to undergo minor modifications to take into account the effects of automatic exposure control systems currently used on most commercial CT scanners [26,27].

Figure 2.Effective dose/dose–length product for a normal-sized adult patient as a function of patient (phantom) scan location obtained using the ImPACT CT Patient Dosimetry Calculator. DLP: Dose–length product; E: Effective dose.
When the radiation used to perform a given CT examination (i.e., CTDIvol and DLP) remains constant, organ and effective doses are reduced with increasing patient size, and vice versa [8,28]. The patient mass in a CT slice may be estimated from the cross-sectional area, and the corresponding average Hounsfield Unit (HU) value, assuming that the HU value is proportional to physical density [29]. This latter approximation is reasonable because at the high photon energies encountered in CT, most interactions are Compton scatter where the probability of an interaction is directly proportional to patient physical density. Modeling of patients (as a mass equivalent cylinders of water) allows relative doses (as a function of water cylinder diameter) to be used to estimate how organ and effective doses vary with patient size [30]. The relative dose Dr is defined as the ratio of the dose in a cylinder of water that is equivalent to a patient of a specified size divided by the corresponding dose in a cylinder that is equivalent to a standard individual (e.g., ImPACT anthropomorphic phantom). Figure 3 shows values of Dr that were obtained in this manner and are applicable for cardiac and chest CT examinations [10,20]. Data in Figure 3 show relative doses Dr as function of weight, as well as anteroposterior (AP) dimension, where a normal-sized adult has an AP chest dimension of 22.5 cm. More sophisticated approaches to CT dosimetry are now available that utilize voxelized phantoms derived from CT images [27,31,32].
Patient risks
Radiation risks can be conveniently categorized as being deterministic and stochastic [3]. Deterministic risks have a threshold below which the risk does not occur, and above which the risks become more likely to occur with increasing dose. In addition, deterministic effect severity often increases with increasing dose. Examples of deterministic effects include cataract induction, epilation and skin burns. The threshold dose for deterministic effects in medical imaging is generally taken to be 2 Gy [33]. Although deterministic effects have occurred in high-dose procedures, such as perfusion CT imaging [34], they are expected to be rare when examinations are performed by individuals who are well trained in medical imaging and radiation dosimetry [35].

Figure 3.Relative dose (Dr) versus patient size, where the latter is expressed as: (A) patient weight (kg); (B) chest anteroposterior dimension. AP: Anteroposterior.
Stochastic effects include carcinogenesis and the induction of genetic effects in the offspring of irradiated individuals [36]. The latter are presently deemed to be of minor importance in medical imaging, and the principal radiation risk for patients undergoing CT examinations is therefore the possible induction of cancer. Risks associated with lower levels of radiation are periodically reviewed by leading scientific organizations, including the ICRP [3], the US National Academy of Sciences Committee on the Biological Effects of Ionizing Radiation (BEIR) [4], and the UN Scientific Committee on the Effects of Atomic Radiation (UNSCEAR) [37]. For practical radiation protection purposes, these scientific bodies recommend that the carcinogenic radiation risk is taken to be directly proportional to the absorbed radiation dose, with no threshold dose below which the risk could be taken to be zero. Figure 4 shows risk estimates published in BEIR VII for uniform whole-body doses of 100 mGy (i.e., effective doses of 100 mSv) that show how radiation risks vary with age and sex [4].
Manufacturer role
Essential data
In any radiological examination, it is imperative that the manufacturer provides definitive data that characterizes both the quantity and quality of the radiation beam that is incident on the patient. For example, in a chest x-ray, it would be appropriate to provide data on the AK, and the corresponding kerma area product (KAP), that is incident on the patient to characterize the ‘quantity’. A half value layer (mm Al), with additional data on relevant parameters (i.e., x-ray tube voltage, waveform ripple and inherent/ added filtration), should also be provided, to charcterise ‘quality’. Knowledge of the quantity/ quality of radiation incident on the patient is the sine qua non for any assessment of the pattern of energy deposition in patients, the corresponding organ doses and any possible patient risks [38].
In CT, the x-ray beam intensity is currently characterized by CTDIvol, and the total amount of radiation used to perform any examination is quantified by the DLP. A 16-cm diameter acrylic phantom is used to quantify CT output in head examinations, and a 32-cm phantom for body examinations. However, for many examinations it is unclear as to whether the dose refers to the ‘head’ or the ‘body’. Cervical spines, for example, may use a body or head protocol [39]. Pediatric body scans, whole-body adult scans and extremities are additional areas where there could be ambiguities regarding which phantom was used to quantify CTDIvol and DLP. It is, therefore, imperative that manufacturers always specify the phantom size for any value of CTDIvol and DLP that is provided to the operator.
The x-ray tube voltage is one of the most important determinants of the x-ray beam quality, and is generally available in any CT scan. However, most CT scanners can also modify both the added filtration and/or the beam-shaping filter that is used for a given examination. Operators often have very little understanding of the type of filtration that is used for any given mode of operation. This state of affairs is unfortunate because each vendor has different rules on filter choices that depend on the type of scan being performed. Factors that can influence the choice of filtration include the scanned region, patient size or whether the individual is a pediatric patient [39]. In addition, little information is provided on the resultant beam quality (i.e., half-value layer) either on the central x-ray beam axis, or across the x-ray fan beam, taking into account the characteristics of the beam-shaping filter. Given that x-ray beam quality has been shown to affect dose conversion factors in medical imaging [40,41], including CT [25], this area merits additional effort by manufacturers and researchers.
Desired data
In a CT examination, key dose quantities (i.e., CTDIvol and DLP) can be provided to the operators prior to the initiation of any radiation exposure, as well as at the completion of each scan. It would also be desirable to provide operators with explicit information as to how these radiation values compare with similar types of examination. Comparisons could refer to similar examinations performed on the same CT scanner using historical data that is readily available on modern computer-controlled imaging equipment. However, the appropriate amount of radiation will also depend on patient size and the specific imaging task.
Patient size
Over the last decade, CT protocols have increasingly accounted for patient physical characteristics [42], which can be readily obtained from the patient (e.g., weight and height), or directly from the CT images (e.g., AP dimension). In particular, CT scanners are increasingly using automatic exposure control that explicitly takes into account the size of the patient. Determining how much radiation should be used to perform a CT examination must always involve consideration of the patient size.
Imaging task
The amount of radiation used in CT examinations must also consider the diagnostic task. It is now established that any scientific measure of image quality needs to explicitly account for the detection task [43]. For example, the quantity and quality of radiation used in CT examinations will clearly depend on whether iodinated contrast material has been administered to the patient.
Radiation protection philosophy for medical imaging utilizes the concept of a diagnostic reference level (DRL) [44]. Consider a survey of routine head CT examinations performed in the USA that demonstrates a distribution of CTDIvol values. The 75th percentile value of this distribution of CTDIvol values could be used as a threshold value (i.e., DRL). Facilities that use more radiation would be expected to investigate (any) reason for needing to use higher radiation intensities.
The American College of Radiology (ACR) CT accreditation program uses CTDIvol values listed in Table 2 for adult and pediatric CT examinations [45]. Exceeding the ACR DRL value results in a formal notification of this fact to the applicant, and may also result in a failure of the accreditation application (Table 2). It is also worth noting that using too little radiation can also result in suboptimal image quality and adversely affect diagnostic performance that may result in more patient detriment than would overexposure. Ideally, there would be an expected range of CTDIvol for each CT examination, with alerts provided when selected parameters results in values that fall outside of this standard range.
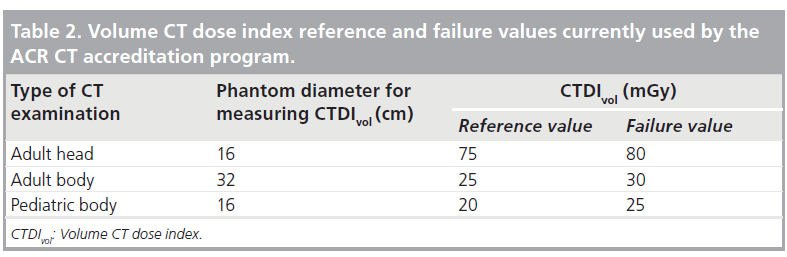

Figure 4.Radiation risks of all cancer induction provided in BEIR VII assuming a uniform whole-body dose of 100 mGy, which corresponds to an effective dose of 100 mSv. BEIR: Biological Effects of Ionizing Radiation.
Optional data
Data for CTDIvol and DLP, together with information on x-ray beam quality, can be used to obtain estimates of patient organ and effective doses (see previous sections). The operator should be formally responsible for converting CT output data into patient doses (and risk). Only the operator knows the way the patient is being scanned and the body region being investigated, as well as the physical patient characteristics that all impact on patient doses. However, the important patient characteristics that impact on dose conversion factors, such as scanned region and patient characteristics (e.g., size) are readily available at the operators console. Vendors are thus capable of developing user-friendly software tools to help operators convert the essential data that is incident on patients into corresponding data on the patient organ/effective doses, as well as the corresponding radiation risks. We provide illustrative examples of absolute and relative dose/CTDI conversion factors that are currently available in the scientific literature, or that may be generated from popular CT dosimetry software packages [46,47,101].
Absolute doses
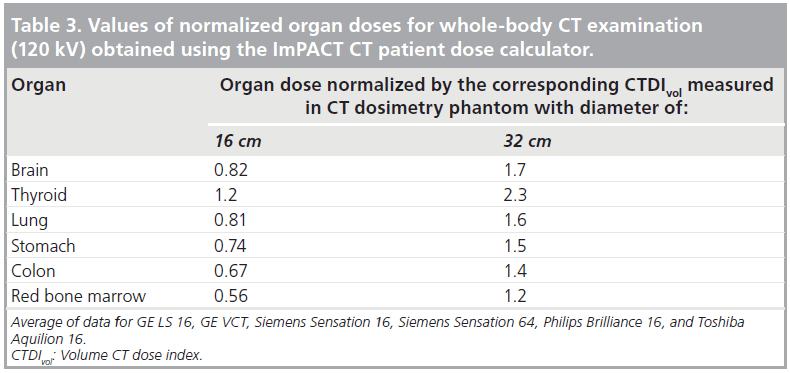
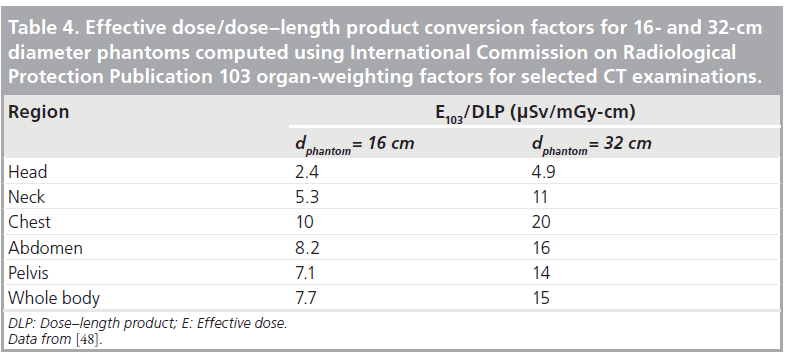
Table 3 shows representative ratios of organ dose to CTDIvol for whole-body scans in a normal sized adult [101]. Table 4 shows the E/DLP conversion factors for this scanner for normal sized adults undergoing a range of CT examinations, and where the regional variations depicted in Figure 2 have been averaged out [9,48].
Relative doses
Figure 5 shows relative effective dose as a function of age, a constant incident radiation intensity (DLP) obtained using E/DLP data published by Deak et al. [25]. Data shown in Figure 5 are taken as an average over five age groups, ranging from newborns to adults. Figure 6 shows how the choice of x-ray tube voltage affects E/DLP factors in head and body examinations based on recent data provided by Deak et al. [25]. Assuming a constant DLP, x-ray tube voltage appears to be of little importance for adult E/DLP values, but increase modestly as patient age decreases.

Figure 5.Relative effective dose as a function of age assuming a constant incident radiation intensity and scan length (i.e., fixed dose-length product). DLP: Dose–length product. Adapted from data from [25].

Figure 6.Effective dose/dose–length product factors as a function of x-ray tube voltage that have been normalized to unity at 120 kV. (A) Head examinations are averages over data for head (brain) and neck examinations. (B) Body examinations are averages of chest, abdomen and pelvis. DLP: Dose–length product; E: Effective dose. Adapted from data from [25].

Figure 7.Air kerma values measured free in air on a Siemens Sensation 16 CT scanner showing: (A) relative air kerma as a function of the radial distance (r) from the CT isocenter; (B) average air kerma within the specified radial distance
CT dose-conversion factors available in the scientific literature are often based on data generated on single slice scanners introduced into clinical practice over 20 years ago [101], or limited to a single vendor [46]. Since manufacturers are the only ones who currently possess the important quantitative data on beam quality for CT x-ray beams, they must be involved in quantifying how conversion factors are influenced by x-ray beam characteristics, including x-ray quantity and quality. Of particular note is that this requires investigation of the influence of x-ray tube voltage (and ripple), beam filtrations (intrinsic and added), and beam shaping filter(s), whose characteristics are generally (only) known to CT vendors. One option would be for vendors to explicitly take on the responsibility of generating dose/CTDI conversion factors. The other possibility is for vendors to make available the required CT output data (i.e., quantity and quality) to the medical imaging community, who could then use these CT output data to generate appropriate dose/CTDI conversion factors.
Current alternatives to CTDI
Problem
Use of wide beams in multidetector CT (MDCT) can underestimate phantom doses when CTDI are measured with one rotation of the x-ray tube, and the resultant dose profile is integrated using a pencil ionization chamber with a length of only 100 mm. It has been shown that the equilibrium dose may be underestimated by 20% in the center of a body phantom, and by approximately 10% in the center of a head phantom for a MDCT with a beam width of 20 mm [49]. Since CT beam widths can now exceed the length of the standard 100‑mm ionization chamber, the approach to CT dosimetry that has been employed for the last 30 years requires urgent review.
There is currently no consensus regarding the most appropriate dosimetry scheme to replace current CTDI metrics. Proposed alternatives, that range from minor modifications to radical replacements, are briefly outlined below. Manufacturers are an important stakeholder in the ongoing debate on the future of CT dosimetry, and need to play an active role to ensure that any scheme is accurate and practical. In addition, it is important that CT dosimetry methods can also be implemented in a clinical setting to meet the patient dosimetry needs of the imaging community.
Modifying CTDI
The x-ray beam collimation (width) for a MDCT can be represented as W, which is the product of the nominal detector width and the number of detector elements along the long patient (z) axis. For values of W that are less than 40 mm, the standard definition and measurement of CTDI100 would be used. For values of W that are greater than 40 mm, CTDI100 would be determined using [50]:
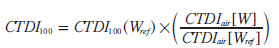
where CTDI100(Wref ) is the CTDI measured in the normal manner using a reference beam width (e.g., 40 mm). CTDIair are the free-inair measurements of CTDI obtained using a 30-cm-long pencil chamber and measured for the (large) beam width W (i.e., CTDIair[W]), as well as for the reference beam width Wref (i.e., CTDIair[Wref ]).
This approach preserves the conventional approach to CT dosimetry, and would only require operators to acquire a 30-cm-long pencil chamber. The advantage of such a scheme would be ease of measurement, as well as continuity with the traditional approach to CT dosimetry. It is recognized that this approach would continue to underestimate the equilibrium dose [49] as discussed in the next section.
Equilibrium dose
Dixon et al. proposed measurement of a new quantity, the equilibrium dose [49,51]. Measurement of the equilibrium dose requires the replacement of the pencil ionization chamber by a small volume ionization chamber, and scanning long phantoms to ensure that dose equilibrium has been established at the location of the ionization chamber [52]. Measured values of the equilibrium dose can be 75% higher than CTDI on the central axis, and 22% higher on the peripheral axis [53]. The ‘dose equilibrium’ concept has a solid physics rationale, and has been investigated experimentally and by the use of the Monte Carlo simulation [53–56]. Nonetheless, the introduction of the equilibrium dose for CT dosimetry has several shortcomings, including:
• Practical: measurement of equilibrium dose requires the use of CT dosimetry phantoms that are longer than the 15-cm long CTDI phantoms that are currently used. The weight and physical stability of such phantoms poses obvious problems;
• Operational: introduction of the equilibrium dose would make comparisons with traditional dose metrics (i.e., CTDIvol and DLP) problematic;
• Theoretical: the primary objective of ‘CTDI’ metrics is to quantify CT scanner output, rather than any kind of absorbed dose per se. In conventional radiography and fluoroscopy, for example x-ray tube output is obtained using measurements made ‘free in air’ rather than based in phantoms.
Kerma area product
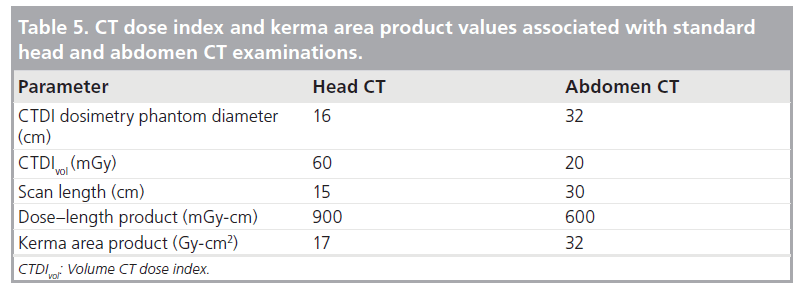
Each projection in CT corresponds to an image dataset that is obtained at one angular position of the x-ray tube. A single CT projection is therefore no different to a radiograph or short fluoroscopy exposure [57]. Therefore, in principle, the KAP for a single CT projection could be determined in exactly the same manner as is currently used in radiography or fluoroscopy. The resultant KAP for a complete CT examination would be obtained by adding up the individual KAP values for each projection in the complete CT scan. Huda and Ogden recently modeled a commercial CT scanner geometry and used ellipses to simulate patient heads and abdomens to compute values of KAP in CT [58].
Table 5 provides a summary of the key dose metrics expressed using the traditional CTDIvol and DLP indicators, as well as the corresponding KAP values [59]. It is notable that the KAP values demonstrate that more radiation is incident in body CT scans than in head CT scans, which is not evident from inspection of either CTDIvol or DLP because these latter indices are measured in different-sized phantoms. In addition, CT KAP values can be compared directly with those associated with head and chest radiographic examinations (~1 Gy-cm2 for head and chest examinations), abdominal radiographic examinations (~5 Gy-cm2), average barium fluoroscopic studies (~20 Gy-cm2) and interventional studies (~100 Gy-cm2) [60].
The concept of KAP in CT is very attractive, and should be straightforward to implement by imaging vendors. Using KAP in CT would unify patient dosimetry in CT with current practice in projection radiography and f luoroscopy. Nonetheless, the KAP concept has one significant limitation, in that all patient dose-conversion factors based on AK will be dependent on the x-ray beam quality. In adult chest radiography, for example, the E/KAP conversion factor for PA projections in adults is 59 μSv/Gy-cm2 at 50 kV (2-mm Al filtration) but increases to 230 μSv/Gy-cm2 at 120 kV (5-mm Al filtration) [61]. In practice, this means the quantity of radiation incident on any patient (i.e., KAP) cannot be fully understood unless the corresponding x-ray beam quality is explicitly taken into account.
Future perspective
A scheme for CT dosimetry that is based on average AK values in a specified field of view, KCT(FOV) is described below and its use for estimating patient organ and effective doses is illustrated.
KCT(FOV)
Measurements of CTDIair(r) as a function of the distance r from the CT isocenter have been presented for a Siemens Sensation 16 scanner operated in body mode [62]. Measurements were made at the isocenter and then at 2-cm increments to a distance of 25 cm from the isocenter and are shown in Figure 7A. Measured values of CTDIair(r) were then fitted to a third order polynomial and were used to calculate the average CTDIair(r) (i.e., the average CTDIair from zero to r). For an average AK denoted as KCT(FOV), FOV is the diameter (cm) of the scanned region, which is twice that of the r values shown in Figure 7.
Figure 7B shows how the average AK varies with FOV. Data in Figure 7B show that KCT(25) is equal to 0.82 × CTDIair, KCT(35) is equal to 0.70 × CTDIair, and KCT(45) is equal to 0.60 × CTDIair [62]. It is notable that the KCT(FOV) metric is more effective at characterizing the effect of the beam shaping filter than current CTDI measurements. For a FOV of 32 cm, corresponding to the size of the body CT phantom, the average AK shown in Figure 7B is based on eight (radial) samples, and may be compared with only two (radial) samples used in determining CTDI.
Organ doses
Table 6 shows the ratio of the organ dose to the average AK KCT(FOV) for three FOV values ranging from 25 to 45 cm, generated using organ doses in the ImPACT spreadsheet [101]. Data shown in Table 6 were obtained for a wholebody scan on a Siemens Sensation 16 CT scanner operated with the body filter. These data were obtained at 120 kV, and are only valid for a whole-body scan in a 70-kg adult patient. For partial body scans, and for patients with different sizes, appropriate correction factors are readily available, as discussed previously. Therefore, data shown in Table 6 offers organ dose-conversion factors for any sized patient undergoing any type of scan and are based on the average AK with the scanned volume (i.e., KCT[FOV]).
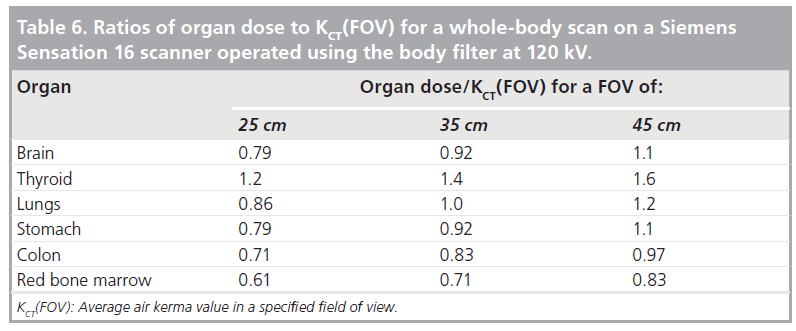
Data in Table 6 are analogous to those provided in Table 3 and, thus, provide continuity with current approaches to CT dosimetry. Since all (organ dose)/(KCT[FOV]) values shown in Table 6 are of the order of unity, they also offer an intuitive interpretation of measured CT output parameter KCT(FOV).
Effective doses
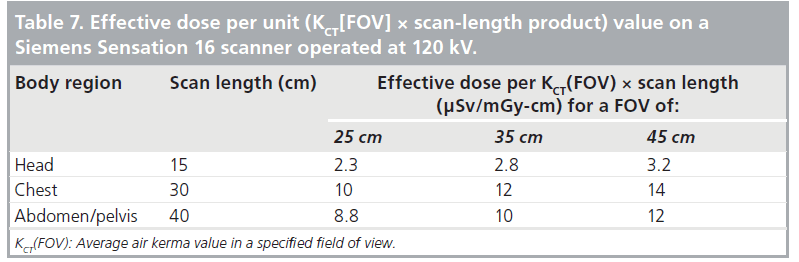
For a CT examination with an average CT scanner output KCT(FOV) in a region defined by a scan length L, it is possible to define an ‘AK-length’ product using the quantity KCT(FOV) × L. Table 7 shows conversion factors of effective dose-per-unit AK-length product value for FOV ranging from 25 to 45 cm. The units of the conversion factors are μSv/mGycm. Unlike E/DLP, conversion factors in Table 7 for head and body scans are inherently commensurate, and show that for constant incident radiation intensity, the body of any patient is approximately four-times more sensitive than the head.
Data shown in Table 7 are qualitatively similar to the E/DLP conversion factors used in clinical practice and illustrated in Table 4. As such, these conversion factors will be familiar to the CT medical imaging community, and have values that are comparable to those in current usage. The qualitative and quantitative similarity of data shown in Table 7 to current E/DLP (i.e., k-factors) conversion factors [9,25,63] would facilitate their introduction in clinical practice.
KCT(FOV) benefits
Use of KCT(FOV) to quantify CT output is analogous to the current CTDIvol and DLP metrics, except that AK values are obtained ‘free in air’, and do not use a phantom. Although this approach is new, extant data in the literature permits the generation of approximate dose conversion factors that can be used for most CT scanners in use today (Tables 6 & 7), including cone-beam CT scanners. The benefits of this CT dosimetry scheme include:
• Quantification of the amount of radiation that is incident on the patient in a simple and unambiguous manner, without the use of any phantom;
• An intuitive framework that enables operators to convert CT x-ray tube outputs into corresponding patient organ and effective doses;
• Provision of a direct link with the dose metrics (CTDIvol and DLP) that, hitherto, have been used in CT imaging.
Manufacturers are an important stakeholder in CT dosimetry, and will therefore need to evaluate the practical utility of using KCT(FOV) to quantify CT scanner output, the dependence of dose conversion factors on beam quality and CT filtration, as well the overall accuracy for estimating patient doses.
Conclusion
In this article, current CTDI metrics have been explained, and the manner in which they can be used to quantify patient organ and effective doses described. Manufacturers must provide data on the quantity and quality of the x-ray radiation that is incident on patients. In addition, it is also appropriate for manufacturers to identify whether the selected amount of radiation is reasonable for a specific patient and a well-defined imaging task. Manufacturers could help the imaging community by providing conversion factors to translate CT output to the corresponding patient doses.
Technological advances in CT scanners, and specifically cone-beam CT scanners that use wide x-ray beams, will require the replacement or modifications of CTDI metrics. Several published alternatives to current CTDI metrics have been described and their respective strengths and weaknesses identified. A novel approach to CT dosimetry, based on KCT(FOV), is proposed. Typical patient organ dose and effective dose conversion factors are provided, which can be used for current cone-beam CT scanners where traditional CTDI metrics are impractical.
Manufacturers need to assess the suitability of all new proposals for specifying the amount of radiation emitted by CT scanners in clinical examinations. Of particular importance is a need for manufacturers to address the importance of the x-ray beam output (quantity and quality) associated with CT dose-conversion factors because they are the only stakeholder with explicit knowledge of the radiation characteristics of any given CT scanner.
Acknowledgements
The author would like to acknowledge technical assistance of Wenjun He who helped to generate part of the results used in this paper.
Financial & competing interests disclosure
The author has no relevant affiliations or financial involvement with any organization or entity with a financial interest in or financial conflict with the subject matter or materials discussed in the manuscript. This includes employment, consultancies, honoraria, stock ownership or options, expert testimony, grants or patents received or pending, or royalties.
No writing assistance was utilized in the production of this manuscript.
Papers of special note have been highlighted as:
* of interest
References
- National Council on Radiation Protection and Measurements: Ionizing Radiation Exposure of the Population of the United States. NCRP Report 160. NCRP, USA (2009). & Definitive source of information of population radiation exposures in the USA in 2006.
- Mccollough CH, Guimaraes L, Fletcher JG: In defense of body CT. AJR Am. J. Roentgenol. 193(1), 28–39 (2009). & Addresses the important issue of both risks and benefits of CT.
- The 2007 Recommendations of the International Commission on Radiological Protection. ICRP publication 103. Ann. ICRP 37(2–4), 1–332 (2007). & Definitive text on current radiation protection philosophy.
- Committee on the Biological Effects of Ionizing Radiation: Health Effects of Exposure to Low Levels of Ionizing Radiations: Time for Reassessment? National Research Council, USA (2005). & Definitive text on current radiation risk estimates.
- ICRP: Radiation protection in medicine. ICRP Publication 105. Ann. ICRP 37(6), 1 (2007).
- Huda W, Schoepf UJ, Abro JA, Mah E, Costello P: Radiation-related cancer risks in a clinical patient population undergoing cardiac CT. AJR Am. J. Roentgenol. 196(2), W159–W165 (2011). & Quantifies patient-specific radiation risks in cardiac CT, and shows how these can be derived from estimates of effective dose.
- Mcnitt-Gray MF: AAPM/RSNA physics tutorial for residents: topics in CT. Radiation dose in CT. Radiographics 22(6), 1541 (2002).
- Huda W, Rowlett WT, Schoepf UJ: Radiation dose at cardiac computed tomography: facts and fiction. J. Thorac. Imaging 25(3), 204 (2010).
- Huda W, Ogden KM, Khorasani MR: Converting dose–length product to effective dose at CT. Radiology 248(3), 995 (2008).
- Huda W, Tipnis S, Sterzik A, Schoepf UJ: Computing effective dose in cardiac CT. Phys. Med. Biol. 55(13), 3675 (2010).
- International Commission on Radiological Protection: Managing Patient Dose in Computed Tomography. ICRP, ON, Canada 30 (2000).
- He W, Huda W, Magill D, Tavrides E, Yao H: Patient doses and projection angle in cone beam CT. Med. Phys. 37(5), 2359–2368 (2010).
- Nagel HD: Radiation Exposure in Computed Tomography. CTB Publications, Hamburg, Germany (2002). & Discusses the wealth of data on CT dose indices.
- Bauhs JA, Vrieze TJ, Primak AN, Bruesewitz MR, Mccollough CH: CT dosimetry: comparison of measurement techniques and devices. Radiographics 28(1), 245 (2008).
- Shope TB, Gagne RM, Johnson GC: A method for describing the doses delivered by transmission x-ray computed tomography. Med. Phys. 8(4), 488–495 (1981).
- Leitz W: Computed tomography dose assessment – a practical approach. Rad. Prot. Dosimetry 57, 377–380 (1995).
- Elojeimy S, Tipnis S, Huda W: Relationship between radiographic techniques (kilovolt and milliampere-second) and CTDIVOL. Rad. Prot. Dosimetry 141(1), 43 (2010).
- Ie-Cc: International standard of IEC 60601–2-44 Ed2 Amendment 1: Medical electrical equipment. Part 2-44: particular requirements for the safety of x-ray equipment for computed tomography IEC Standard 60601-2-44 (2003).
- Huda W, Mettler FA: Volume CT dose index and dose–length product displayed during CT: what good are they? Radiology 258(1), 236–242 (2011).
- Huda W, Sterzik A, Tipnis S, Schoepf UJ: Organ doses to adult patients for chest CT. Med. Phys. 37(2), 842–847 (2010).
- Jones DG, Shrimpton PC: Normalized organ doses for x-ray computed tomography calculated using Monte Carlo techniques (NRPB SR 250) 45 (1993).
- Mccollough CH, Schueler BA: Calculation of effective dose. Med. Phys. 27(5), 828–837 (2000).
- Mettler FA Jr, Huda W, Yoshizumi TT, Mahesh M: Effective doses in radiology and diagnostic nuclear medicine: a catalog. Radiology 248(1), 254–263 (2008). & Comprehensive source of patient effective doses in diagnostic radiology.
- Borras C, Huda W, Orton CG: Point/ counterpoint. The use of effective dose for medical procedures is inappropriate. Med. Phys. 37(7), 3497 (2010). & Provides good reasons for use of effective dose in diagnostic radiology.
- Deak PD, Smal Y, Kalender WA: Multisection CT protocols: sex- and age-specific conversion factors used to determine effective dose from dose–length product. Radiology 257(1), 158 (2010).
- He W, Huda W, Magill D, Tavrides E, Yao H: X-ray tube current modulation and patient doses in chest CT. Radiat. Prot. Dosimetry 143(1), 81–87 (2011).
- Van Straten M, Deak P, Shrimpton PC, Kalender WA: The effect of angular and longitudinal tube current modulations on the estimation of organ and effective doses in x-ray computed tomography. Med. Phys. 36(11), 4881–4889 (2009). & Source on the effects of tube current modulation on E/DLP conversion factors.
- Demarco JJ, Cagnon CH, Cody DD et al.: Estimating radiation doses from multidetector CT using Monte Carlo simulations: effects of different size voxelized patient models on magnitudes of organ and effective dose. Phys. Med. Biol. 52(9), 2583 (2007).
- Huda W, Randazzo W, Tipnis S, Frey GD, Mah E: Embryo dose estimates in body CT. AJR Am. J. Roentgenol. 194(4), 874–880 (2010).
- Huda W, Atherton JV, Ware DE, Cumming WA: An approach for the estimation of effective radiation dose at CT in pediatric patients. Radiology 203(2), 417–422 (1997).
- Deak P, Van Straten M, Shrimpton PC, Zankl M, Kalender WA: Validation of a Monte Carlo tool for patient-specific dose simulations in multi-slice computed tomography. Eur. Radiol. 18(4), 759–772 (2008).
- Myronakis M, Perisinakis K, Tzedakis A, Gourtsoyianni S, Damilakis J: Evaluation of a patient-specific Monte Carlo software for CT dosimetry. Radiat. Prot. Dosimetry 133(4), 248–255 (2009).
- Balter S, Hopewell JW, Miller DL, Wagner LK, Zelefsky MJ: Fluoroscopically guided interventional procedures: a review of radiation effects on patients’ skin and hair. Radiology 254(2), 326–341 (2010). & Definitive article on deterministic effects of radiation.
- Imanishi Y, Fukui A, Niimi H et al.: Radiation-induced temporary hair loss as a radiation damage only occurring in patients who had the combination of MDCT and DSA. Eur. Radiol. 15(1), 41 (2005).
- Nickoloff E, Mahesh M, Heintz P, Kanal K, Rzeszotarski MS, Schueler B: Physics instruction for radiology residents in the era of the new ABR examination process. J. Am. Coll. Radiol. 7(11), 900–904 (2010).
- Hall EJ, Giaccia AJ: Radiobiology for the Radiologist. Lippincott Williams & Wilkins, PA, USA (2006). & Definitive textbook on radiobiology.
- Unscear: Effects of Ionizing Radiation. UN Scientific Committee on the Effects of Atomic Radiation (UNSCEAR). 2006 Report to the General Assembly. (2006).
- Huda W: Medical Radiation Dosimetry. In: RSNA Categorical Course in Diagnostic Radiology Physics: From Invisible to Visible – The Science and Practice of X-ray Imaging and Radiation Dose Optimization. RSNA, Oak Brook, IL, USA, 29–39 (2006).
- Huda W, Sterzik A, Tipnis S: X-ray beam filtration, dosimetry phantom size and CT patient dose conversion factors. Phys. Med. Biol. 55(2), 551 (2010).
- Huda W, Gkanatsios NA: Effective dose and energy imparted in diagnostic radiology. Med. Phys. 24(8), 1311–1316 (1997).
- Gkanatsios NA, Huda W: Computation of energy imparted in diagnostic radiology. Med. Phys. 24(4), 571–579 (1997).
- Huda W, Bushong SC: In x-ray computed tomography, technique factors should be selected appropriate to patient size. Med. Phys. 28(8), 1543–1545 (2001).
- International Committee on Radiation Units and Measurements (ICRU): Medical Imaging – The Assessment of Image Quality. ICRU, Bethesda, MD, USA (1995). & Definitive report on medical image quality.
- Rosenstein M: Diagnostic reference levels for medical exposure of patients: ICRP guidance and related ICRU quantities. Health Phys. 95(5), 528–534 (2008).
- Mccollough CH, Bruesewitz MR, Mcnitt-Gray MF et al.: The phantom portion of the American College of Radiology (ACR) computed tomography (CT) accreditation program: practical tips, artifact examples, and pitfalls to avoid. Med. Phys. 31(9), 2423–2442 (2004).
- Kalender WA, Schmidt B, Zankl M, Schmidt M: A PC program for estimating organ dose and effective dose values in computed tomography. Eur. Radiol. 9(3), 555–562 (1999).
- Brix G, Lechel U, Veit R et al.: Assessment of a theoretical formalism for dose estimation in CT: an anthropomorphic phantom study. Eur. Radiol. 14(7), 1275–1284 (2004).
- Huda W, Magill D, He W: CT Effective dose per dose–length product using ICRP 103 weighting factors. Med. Phys. 38, 1261–1265 (2011).
- Dixon RL: A new look at CT dose measurement: beyond CTDI. Med. Phys. 30(6), 1272 (2003). 50 Kalender WA: Computed tomography. Publicis (2011) (In press). & Definite textbook on CT imaging. 51 Dixon RL, Munley MT, Bayram E: An improved analytical model for CT dose simulation with a new look at the theory of CT dose. Med. Phys. 32(12), 3712 (2005).
- AAPM Task Group 111: Comprehensive Methodology for the Evaluation of Radiation Dose in X-ray Ray Computed Tomography. AAPM, MD, USA (2010).
- Dixon RL, Ballard AC: Experimental validation of a versatile system of CT dosimetry using a conventional ion chamber: beyond CTDI100. Med. Phys. 34(8), 3399 (2007).
- Boone JM: Dose spread functions in computed tomography: a Monte Carlo study. Med. Phys. 36(10), 4547 (2009).
- Dixon RL, Boone JM: Cone beam CT dosimetry: a unified and self-consistent approach including all scan modalities – with or without phantom motion. Med. Phys. 37(6), 2703 (2010).
- Zhou H, Boone JM: Monte Carlo evaluation of CTD(infinity) in infinitely long cylinders of water, polyethylene and PMMA with diameters from 10 mm to 500 mm. Med. Phys. 35(6), 2424 (2008). & Provides patterns of dose distributions in phantoms, which are absolutely essential for truly understanding CT dose indices.
- Huda W: Time for unification of CT dosimetry with radiography and fluoroscopy. Radiat. Prot. Dosimetry 128(2), 129–132 (2008).
- Huda W, Ogden KM: Measuring kerma-area products (KAP) in CT. Med. Phys. 34, 2348 (2007).
- Huda W, Ogden KM: Converting CT dose length product (DLP) to kerma area product (KAP). Med. Phys. 36, 2450 (2009).
- UNSCEAR: Sources and Effects of Ionizing Radiation. UNSCEAR, NY, USA (2000).
- Hart D, Jones DJ, Wall BF: Estimation of effective dose in diagnostic radiology from entrance surface dose and dose–area product measurements. NRPB R262 (1994).
- Ogden KM, Huda W: The effect of measurement location on in-air CTDI. Med. Phys. 35, 2657 (2008).
- AAPM 96: The Measurement, Reporting, and Management of Radiation Dose in CT. AAPM, MD, USA, 1 (2007). & Good overview of the current state of the art of CT dosimetry.


