Research Article - Imaging in Medicine (2021) Volume 13, Issue 9
Evaluation of doppler parameters of ophthalmic artery and central retinal artery in type 2 diabetics using Colour Doppler Imaging
- Corresponding Author:
- Debarpita Datta
Department of Radiodiagnosis, Medical College Kolkata and Hospital, Kolkata, India
E-mail: debarpita.datta.mck@gmail.com
Abstract
Objectives: To investigate the doppler parameters of ophthalmic and central retinal artery in type 2 diabetes mellitus patients with Colour Doppler Imaging (CDI) and compare the results with non-diabetic controls.
Materials and methods: This prospective study included 30 type 2 diabetic patients and 15 controls. Diabetic patients were further divided into subjects with no retinopathy (n=15) and subjects with retinopathy (n=15). CDI was performed using GE Logitech P9 ultrasound. The Peak Systolic Velocity (PSV), End-Diastolic Velocity (EDV), Resistivity Index (RI) and Pulsatile Index (PI) of ophthalmic (OA) and Central Retinal Artery (CRA) along with Central Retinal Vein (CRV) were recorded.
Results: RI in the ophthalmic artery was significantly higher in both diabetic groups than the control group (P=0.001,). Diabetics without retinopathy had decreased blood flow velocity (PSV and EDV) in OA compared to controls (P=0.002 and P=0.0011, respectively). Diabetics with retinopathy had significantly reduced EDV and PSV and increased RI in CRA compared to diabetics without retinopathy (P=0.001). Significant correlation was noted among the groups. Pearson’s coefficient analysis analysed that RI of OA has a positive corelation with glycosylated haemoglobin and duration of diabetes.
Conclusion: Significant changes in resistivity index and flow velocities were observed in the ophthalmic artery and central retinal artery in diabetics compared to controls. CDI could be useful to predict individuals at higher risk for developing severe DR.
Keywords
Doppler▪ Artery▪ Diabetes▪ Retinopathy▪ Resistance
Introduction
Ocular complications of diabetes mellitus pose a public health problem globally. It is the most frequent cause of preventable blindness in working age adults (20-75 years) [1]. According to estimates, some form of diabetes affects 8.3% of the world’s population and almost half are associated with some form of retinopathy at any given point of time [2]. The severity of hyperglycaemia and the duration of diabetes are independent risk factors in developing retinopathy. Considering the severity of the situation, there is a dire need of imaging modalities for its evaluation.
Colour Doppler Imaging (CDI) is a non-invasive imaging modality to evaluate the circulatory changes in ocular vessels in diabetics qualitatively and quantitatively through peak systolic velocities and vascular impedance parameters and determine the risk of developing Diabetic Retinopathy (DR) in diabetic subjects. From hemodynamic point of view there is first decrease in peak systolic velocity then gradual increase as stage of retinopathy progresses. [3]. This theory can be helpful in determining who are at risk of developing retinopathy among diabetics and alerting the clinician to give adequate antidiabetic treatment to prevent further damage and improve the quality of patient’s life.
Materials and Methods
This is a prospective study conducted in Medical College Kolkata and hospital, a tertiary care institution over a study period of one year from August 2020 to August 2021. A total of 45 subjects were referred for colour doppler imaging to our department from ophthalmology department of our institute that were categorised into three groups-15 diabetic subjects without retinopathy, 15 diabetic subjects with retinopathy and 15 normal subjects. An informed consent was taken from all the subjects.
Colour doppler imaging of Ophthalmic Artery (OA) and Central Retinal Artery (CRA) was done by GE Logitech P9 and Philips iu22 ultrasound machine by 7.5 MHz L3-12 and L8- 18i linear transducer. Patients were examined in the supine position, with their heads inclined at a 30° angle. The transducer was covered in gel and gently placed externally upon the eyelid, avoiding excessive pressure. The flow velocity was measured in the vessels using a wall filter of 110 Hz and sample gate of 0.1 mm. Doppler intonation angle was adjusted between 0 and 40º. After the waveforms were obtained, measurements of Peak Systolic Velocity (PSV m/ sec), End Diastolic Velocity (EDV m/sec) and the Resistance Index (RI) were calculated by automatic algorithm of the machine.
The data is analysed using descriptive and inferential statistical analysis. For quantitative parameters we have used mean and Standard Deviation (SD). For qualitative parameters we have used percentage (%). P-value is assessed at 5% level of significance. Comparison between two groups has been done by one way ANOVA test and correlation between variables was determined by Pearson’s co-relation coefficient analysis. Statistical analysis was done by SPSS software 20.0 and graphs and tables were generated by MS excel and MS word.
Results
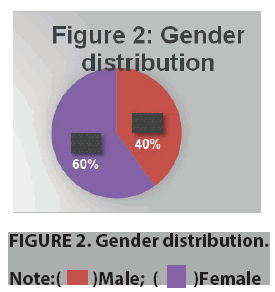
In ours study we found maximum patients was of the age group 30-45 years (mean 24 ± 3 years). Majority of the patients were diabetics with retinopathy (37.5%) (FIGURE 1). Male: Female ratio of the study group was 2:3(40:60) (FIGURE 2).
The demographic parameters of the study participants were studied in terms of body mass index(kg/m2), median duration of diabetes (years) and glycosylated haemoglobin levels (Hba1c) and it was noted that there was significance between glycosylated haemoglobin levels in controls and diabetes patients (TABLE 1).
| Parameter | Controls(n=15) | Diabetics without retinopathy(n=15) | Diabetics with retinopathy(n=15) | P-value |
|---|---|---|---|---|
| Body mass index(kg/m2) | 22.4 ± 3.42 | 24.4 ± 2.1 | 25.9 ± 6.2 | 0.9 |
| Median duration of diabetes(years) | - | 5 | 12 | 0.24 |
| Glycosylated haemoglobin(Hba1c) | 5.2 ± 1.8 | 7.2 ± 4.1 | 9.9 ± 3.45 | 0.003* |
| *Note= Significant value less than 0.05 | ||||
TABLE 1.To illustrate the demographic parameters of the subjects.
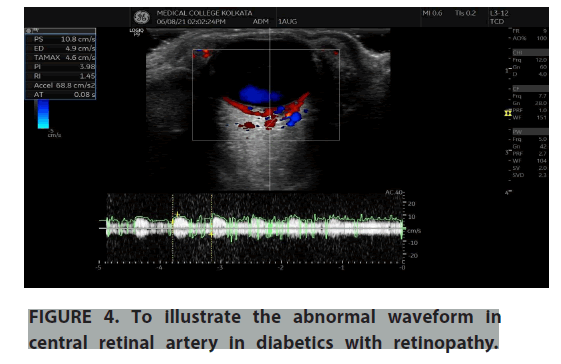
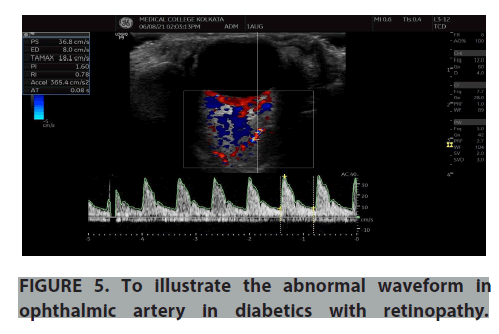
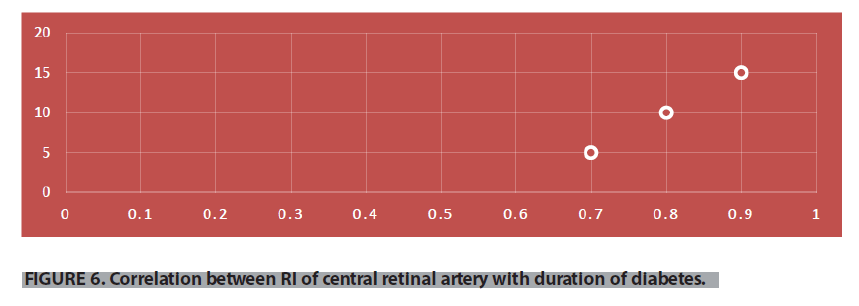
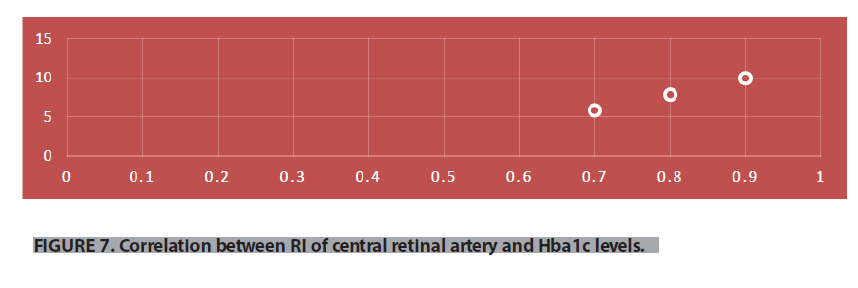
Normal and abnormal waveforms of central retinal artery and ophthalmic artery doppler were recorded and the doppler parameters were analysed (FIGURES 3-6). Colour doppler imaging parameters of controls and diabetes with and without retinopathy were studied and analysed for significance level in terms of Peak Systolic Velocity (PSV m/s), End Diastolic Velocity (EDV m/s), Pulsatility Index (PI), Resistance Index (RI) of Central Retinal Artery (CRA) and ophthalmic artery (TABLES 2-4). In our study we have compared diabetic patients with controls and found there was higher resistive index in ophthalmic artery and decreased velocities in central retinal artery among the diabetic patients. And the velocities were even decreased in CRA when we compared the diabetic retinopathy patients with no retinopathy diabetics. The resistive index of ophthalmic artery and velocity values of central retinal artery is strongly significant on comparing the patients with and without diabetic retinopathy with the control group. From the study, it was found that the arterial velocity in CRA decreases as severity of the disease increases. There was a positive co-relation between RI of CRA and duration of diabetes and glycosylated hemoglobin levels (FIGURES 7 and 8).
| Hemodynamic Parameter | Controls | Diabetic without retinopathy | Diabetics with retinopathy |
|---|---|---|---|
| CRA PSV(m/sec) | 0.13 ± 0.03 | 0.11 ± 0.06 | 0.002* |
| CRA EDV(m/sec) | 0.05 ± 0.5 | 0.03 ± 0.4 | 0.011* |
| CRA RI | 0.75 ± 0.5 | 0.88 ± 0.67 | 0.001* |
| OA PSV(m/sec) | 0.30 ± 0.02 | 0.32 ± 0.06 | 0.019* |
| OA EDV(m/sec) | 0.09 ± 0.02 | 0.07 ± 0.1 | 0.9 |
| OA RI | 0.6 ± 0.07 | 0.72 ± 0.01 | 0.015* |
| *Note= Significant value less than 0.05 | |||
TABLE 2.To compare the hemodynamic parameters of controls and diabetics without retinopathy.
| Hemodynamic Parameter | Controls | Diabetics with retinopathy | P-value |
|---|---|---|---|
| CRA PSV(m/sec) | 0.13 ± 0.03 | 0.10 ± 0.08 | 0.002* |
| CRA EDV(m/sec) | 0.05 ± 0.5 | 0.02 ± 0.03 | 0.003* |
| CRA RI | 0.75 ± 0.5 | 0.9 ± 0.05 | 0.001* |
| OA PSV(m/sec) | 0.30 ± 0.02 | 0.35 ± 0.07 | 0.026* |
| OA EDV(m/sec) | 0.09 ± 0.02 | 0.08 ± 0.2 | 0.8 |
| OA RI | 0.6 ± 0.07 | 0.82 ± 0.07 | 0.018* |
| *Note= Significant value less than 0.05 | |||
TABLE 3.To compare the hemodynamic parameters of controls and diabetics with retinopathy.
| Hemodynamic Parameter | Diabetics without retinopathy |
Diabetics with retinopathy | P-value |
|---|---|---|---|
| CRA PSV(m/sec) | 0.11 ± 0.06 | 0.10 ± 0.08 | 0.003* |
| CRA EDV(m/sec) | 0.03 ± 0.4 | 0.02 ± 0.03 | 0.06 |
| CRA RI | 0.88 ± 0.67 | 0.9 ± 0.05 | 0.001* |
| OA PSV(m/sec) | 0.32 ± 0.06 | 0.35 ± 0.07 | 0.021* |
| OA EDV(m/sec) | 0.07 ± 0.1 | 0.08 ± 0.2 | 0.92 |
| OA RI | 0.72 ± 0.01 | 0.82 ± 0.07 | 0.012* |
| *Note= Significant value less than 0.05 | |||
TABLE 4.To compare the hemodynamic parameters of diabetics with retinopathy and without retinopathy.
Discussion
Pulsed Doppler imaging has established itself a useful tool for evaluation of ocular haemodynamic in real time [4-6]. This modality is useful when standard procedures of diagnosis (fundus examination and fluorescein angiography) are difficult when there is cataract or vitreous haemorrhage [7].
In our study we have compared diabetic patients with controls and found there was higher resistive index in ophthalmic artery and decreased velocities in central retinal artery among the diabetic patients. And the velocities were even decreased in CRA when we compared the diabetic retinopathy patients with no retinopathy diabetics. The resistive index of ophthalmic artery and velocity values of central retinal artery is strongly significant on comparing the patients with and without diabetic retinopathy with the control group. From the study, it was found that the arterial velocity in CRA decreases as severity of the disease increases.
The results in this study matches to the study which was done by Goebel et al., in which he found the PSV and EDV of CRA to be significantly lower in diabetic retinopathy patients compared to the controls [8]. The patients who had PDR had decreased PSV compared to the normal patients used in that study. However, the velocity changes in ophthalmic artery and short posterior ciliary artery did not show significant changes and RI was not used as a parameter [9-14].
There was a similar study by medieval et al., which performed a study with 25 diabetes mellitus patients with PDR comparing them to 30 patients without diabetes [15-18]. He found significant decrease in velocities of CRA and also in the velocities of ophthalmic artery. However, non- proliferative retinopathy patients were not included in his study [6]. But in our study, we had significant increase in peak systolic velocity and no significant change in end diastolic velocity of ophthalmic arteries in diabetic groups when compared to the normal patients.
An increase in the PSV coincides with rise of systolic blood pressure which was studied by Williamson et al. in 1995, however, in our study we did not confirm the results to this correlation in group analysis and there was not any significance in systolic blood pressure of our patients. Resistive index parameter was not used by the above-mentioned studies on colour doppler imaging [19-21].
Similar to our study, increased value of RI in ophthalmic artery was highlighted by Jane R. MacKinnon et al.2000 and the probable reason could be due to increase in PSV and decrease in EDV, but this is suggested as vascular changes in retinal and choroidal vasculature [7]. It is estimated that retina receives only less than 10% of blood flow of the total ocular blood supply (Hart 1992), the remainder being directed to the choroid via the ciliary circulation.
Conclusion
In conclusion, significant changes in the blood flow velocities and RI were observed in the retrobulbar vessels, especially in an ophthalmic artery in diabetics compared to controls. RI could be potentially useful for early diagnosis and follow-up of DR. CDI with results of increased resistance or decreased flow can be of help to identify diabetic individuals at higher risk for developing severe DR. This is especially useful in patients with opaque media where conventional methods are of little use.
References
- Cheung N, Mitchell P, Wong TY. Diabetic retinopathy. Lancet. 376,124-36 (2010).
- Curtis TM, Gardiner TA, Stitt AW. Microvascular lesions of diabetic retinopathy: clues towards understanding pathogenesis? Eye (Lond). 23(7), 1496-1508 (2009).
- The global dominance of diabetes. The Lancet. 382(9906), 1680 (2013)
- Goebel W, Lieb We, Ho A, et al. Color doppler imaging: a new technique to assess orbital blood flow in patients with diabetic retinopathy. Invest Ophthalmol Vis Sci. 36(5), 864-870 (1995).
- Basic and clinical science course, Section 12: Retina and Vitreous Aao, 2017-2018.
- Klein R, Klein Be, Moss Se, Davis Md, Demits Dl. The Wisconsin epidemiologic study of diabetic retinopathy. II. Prevalence and risk of diabetic retinopathy when age at diagnosis is less than 30 years. Arch Ophthalmol. 102(4), 520-526 (1984).
- Treatment techniques and clinical guidelines for photocoagulation of diabetic macular edema. Early Treatment Diabetic Retinopathy Study Report Number 2. Early Treatment Diabetic Retinopathy Study Research Group. Ophthalmology. 94(7), 761-774 (1987).
- Mendívil A, Cuartero V, Mendívil Mp. Ocular blood flow velocities in patients with proliferative diabetic retinopathy and healthy volunteers: a prospective study. Br J Ophthalmol. 79(5), 413–416 (1995).
- The effect of intensive diabetes treatment on the progression of diabetic retinopathy in insulin-dependent diabetes mellitus. The Diabetes Control and Complications Trial. Arch Ophthalmol. 113(1), 36-51 (1995).
- Frank RN. Diabetic retinopathy. N Engl J Med. 350(1), 48-58 (2004).
- Nathan DM, Genuth S, Lachin J, et al. The effect of intensive treatment of diabetes on the development and progression of long-term complications in insulin-dependent diabetes mellitus. N Engl J Med. 329(14), 977-986 (1993).
- MacKinnon JR, McKillop G, O'Brien C, et al. Colour doppler imaging of the ocular circulation in diabetic retinopathy. Acta Ophthalmol Scand. 78(4),386-389 (2000).
- Resnikoff S, Pascolini D, Etya'ale D, et al. Global data on visual impairment in the year 2002. Bull World Health Organ. 82(11), 844-851 (2004).
- Aiello LM. Perspectives on diabetic retinopathy. Am J Ophthalmol. 136(1), 122-135 (2003).
- Mohamed Q, Gillies MC, Wong TY. Management of diabetic retinopathy: a systematic review. JAMA. 298(8), 902-916 (2007).
- Photocoagulation treatment of proliferative diabetic retinopathy. Clinical application of Diabetic Retinopathy Study (DRS) findings, DRS Report Number 8. The Diabetic Retinopathy Study Research Group. Ophthalmology. 88(7), 583-600 (1981).
- Photocoagulation treatment of proliferative diabetic retinopathy: the second report of diabetic retinopathy study findings. Ophthalmology. 85(1), 82-106 (1978).
- Friedman NJ, Kaiser PK, Pineda R. The Massachusetts eye and ear infirmary illustrated manual of Ophthalmology. 3rd Edition. Saunders Elsevier (2009).
- Meredith Ta. The Diabetic Vitrectomy Study. In: Kertes C, Ed. Clinical Trials in Ophthalmology-A Summary and Practice Guide.37-48 (1998).
- Lang J, Kageyama I. The ophthalmic artery and its branches, measurements and clinical importance. Surg Radiol Anat. 12(2), 83-90 (1990).
- Rojanapongpun P, Morrison B, Drance SM. Reproducibility of transcranial Doppler ultrasound examinations of the ophthalmic artery flow velocity. Br J Ophthalmol. 77(1), 22-24 (1993).

