Research Article - Clinical Practice (2019) Volume 16, Issue 5
E-Anfis to diagnose the progression of chronic kidney disease
- Corresponding Author:
- Subhashini R
Department of Computer Applications, Noorul Islam Centre for Higher Education, Kumaracoil, India
E-mail: baskisubha24@gmail.com
Abstract
Chronic renal failure is not well explored. In this study, an artificial intelligence technique is proposed for overcoming the occurrence of local minima and local maxima in diagnosing the progression of kidney disease. An AI technique, a mixture of ALO and ANFIS, E-ANFIS (Enhanced Adaptive Neuro-fuzzy Inference Systems) is introduced. Normally back propagation is used in ANFIS but in proposed using new optimizer ALO. The performance of ANFIS is improved by utilizing the Ant Lion Optimizer. This enhanced ANFIS used to diagnose the progression stage of the CKD. The proposed technique was executed in MATLAB/Simulink platform and compared with the existing techniques ANFIS, fuzzy, and ANN. Performance evaluation is assessed in terms of accuracy, recall, precision, F-measure and specificity. The obtained results showed that the newly introduced E-ANFIS is the best algorithm when compared to other involved existing algorithms
Keywords
Chronic renal disease, data mining, GFR, ant lion optimizer, adaptive neuro-fuzzy inference system, microalbuminuria, fuzzy, artificial neural network, E-ANFIS
Abbreviations
CKD: Chronic Kidney Disease; GFR: Glomerular Filtration Rate; ALO-Ant Lion Optimizer; ANFIS: Adaptive Neurofuzzy Inference System; E-ANFIS: Enhanced Adaptive Neurofuzzy Inference System; CRF: Chronic Renal Failure; BMI: Body Mass Index; MDRD: Modification of Diet in Renal Disease; ANN: Artificial Neural Network
Introduction
Chronic Kidney Disease is a decline in kidney function due to any type of diabetes mellitus, abnormal blood pressure, glomerulonephritis, congenital abnormalities in the kidneys, or genetic reasons [1]. CKD leads to a lack of removing wastes and extra fluids from the body. The hormone level is imbalanced in the body and not able to maintain the body’s balance of acid and base. According to the severity of the disease, CRF is classified into five stages based on the Glomerular Filtration Rate (GFR). Stage 1 represents kidney damage with normal or increased GFR and final stage 5 referred to as kidney failure wherein there is a total loss of kidney function. At this stage, most of the people need dialysis [1,2]. The problems relevant to CRF may happen gradually, over a long period of time without symptoms and they may end at end-stage renal failure. Early identification and treatment are therefore useful in preventing the progression of the disease. The kidney disease progression considered as a function of various factors including GFR, urine microalbumin, serum sodium, serum potassium, serum uric acid, blood urea, total protein, serum albumin [1-4]. Among these, microalbuminuria (30- 300 mg/day) is an earlier sign of chronic kidney disease [5].
In recent years, early diagnosis of the disease determines the appropriate time to apply medical treatments for CKD received great attention among physicians. Researchers through studies try to diagnose CKD in patients as early as possible and to control the risk factors of the disease progression like high blood pressure, proteinuria, and hyperphosphatemia [6,7]. Based on the evaluation, different models were developed to predict progression. However, they cannot accurately predict the variations of GFR [8].
This paper is further organized as: Section 2 represents related work, Section 3 provides materials and methods, Section 4 is modeling of E-ANFIS technique based on ant lion optimizer, Section 5 is the result and discussion, and finally, Section 6 provides the conclusion.
Survey of related research works
Aguilar et al. analyzed the factors associated with CKD on 105 patients. The CKD related factors were age more than 65, sex, the presence of cardiovascular disease, anemia, and overweight with BMI>30. Their work showed that age and anemia both were the strongest factors relevant to CKD [9]. There has been more number of studies on GFR variations among different CKD patients. Artificial Intelligent and machine learning techniques have been increasingly used in disease forecasting.
Gaspari et al. derived from 12 prediction equations by plasma iohexol clearance in a group of 91 renal transplant patients [10]. They found that all models overestimate renal function.
Brier et al. compared neural networks with logistic regression in the prediction of Delayed Graft Function (DGF) in renal transplant patients. They evaluated the results of a neural network with logistic regression and founded higher sensitivity of logistic regression in the prediction of DGF (91 versus 80%), the neural network was sensitive to the prediction for DGF (66 versus 47%) [11].
Hussain et al. given a tool for detecting cancer using Support Vector Machines (SVM). They evaluated the performance of the new method with the remaining classification methods. Accordingly, SVM improved in its performance [12].
Recently, fuzzy methods, especially expert systems have been increasingly used in prediction of diseases. It seems like employing this method with clinical tools for diagnosis of diseases and the condition may reduce diagnostic errors. Fuzzy inference technique is accurate. ANFIS is based on neural networks concepts. ANFIS network is proposed by Ojugo, et al. [13]. This is a network equivalent to a Takagi-Sugeno fuzzy system. Learning is a continuous update of parameters. ANFIS is a hybrid algorithm in which back propagation algorithm is used to update fundamental factors [14].
If we can predict the renal function worsening, we can manage this disorder. An appropriate parameter should be considered for disease worsening. The microalbuminuria is the parameter, which detects the progression of kidney disease at an earlier stage [15]. The other additional parameters considered in this paper is GFR, serum sodium, serum potassium, serum uric acid, blood urea, total protein, and serum albumin. No other efficient method proposed in the past for predicting CKD worsening time. The objective is to provide a reliable method with good accuracy in the healthcare system.
Materials and Methods
Data collection
The data of the present study were the renal failure test records of diagnosed CKD patients from Dr. Jeyasekharan Medical Trust, Kanniyakumari during January 2014-December 2017. The new parameter included is urine microalbumin. All the procedures were approved by the committee of Dr. Jeyasekharan Medical Trust. A total of 900 CKD patient’s lab data were collected.
Input selection
E-ANFIS is used in the proposed study to predict GFR values. The GFR value is calculated by the MDRD equation.
All variables were used as continuous to have good training. Seven variables were influencing parameters of GFR. These variables included urine microalbumin, serum sodium, serum potassium, serum uric acid, total protein, blood urea, and serum albumin. These variables were taken as the inputs of the predicting model. The existing work excluded the urine microalbumin lab data. In this proposed study we included this as an additional attribute. The correlation between the considered variables and GFR values were calculated using Pearson correlation coefficients technique. Pearson correlation coefficients test was used to determine the most significant input variables and this was used because of the continuous nature of the variables (FIGURE 1).

FIGURE 1. GFR ranges with other attributes.
FIGURE 1 and TABLE 1 represent the correlation coefficients between the inputs and output GFR at a 4-month interval. Of the 7 inputs, microalbumin is more correlated with the output. Therefore, we considered the urine microalbumin as a new input for modeling the technique for diagnosing the progression.
| Urine microalbumin | Serum sodium | Serum potassium | Serum Uric acid | Total Protein | Blood Urea | Serum Albumin | |
|---|---|---|---|---|---|---|---|
| Jan 2014 | 632 | 248 | 152 | 315 | 392 | 472 | 493 |
| May 2014 | 598 | 252 | 163 | 398 | 406 | 459 | 504 |
| Sep 2014 | 593 | 204 | 159 | 451 | 342 | 502 | 513 |
| Jan 2015 | 612 | 236 | 172 | 462 | 301 | 521 | 486 |
| May 2015 | 602 | 272 | 181 | 421 | 351 | 456 | 511 |
| Sep 2015 | 635 | 301 | 159 | 434 | 332 | 398 | 506 |
| Jan 2016 | 652 | 296 | 176 | 403 | 365 | 401 | 514 |
| May 2016 | 629 | 314 | 182 | 415 | 373 | 418 | 526 |
| Sep 2016 | 624 | 316 | 179 | 442 | 361 | 405 | 501 |
TABLE 1. Correlation between GFR and the attribute variables.
In the next step, the GFR values were predicted at 4-, 8-, and 12-month intervals using E-ANFIS network model. The real data during a four-year period were collected at 4-month intervals. Therefore, the GFR values were predicted for three sequential 4-month intervals at 4-, 8-, and 12-month intervals.
a) Building training and test datasets: The first step is to train all neural networks into training and test datasets. Training data used for optimization of weights. Testing data used for quality and forecasts. The test datasets are normally selected among 25% to 35% of the original data. In this work, 30% of the data were selected for test data, the remaining 70% were used for training
b) Fuzzification of input variables: Neurofuzzy classifier in MATLAB was used to fuzzify input variables and to establish the rule base
c) Creating a fuzzy rule base for E-ANFIS: The fuzzy rules are generated using the membership functions of input variables. Total 200 rules (6 × 8+3 × 8+3 × 8+3 × 8+2 × 8+2 × 8+2 × 8+2 × 8+2 × 8) are created in the rule base and used to estimate GFR values. TABLE 2 shows the membership function for the considered variables in this study. FIGURE 2 shows the E-ANFIS architecture of the predicting model used in the proposed work

FIGURE 2. Proposed architecture of E-ANFIS.
| Normal | Mild | Moderate | Less Severe | Severe | Failure | Membership Function | |
|---|---|---|---|---|---|---|---|
| GFR /ml/min/1.73 m2 |
>90 | 60-89 | 45-59 | 30-44 | 15-29 | <15 | 6 |
| Urine Microalbumin /mcg/min (ur ma) |
<30 | 30-299 | --- | --- | --- | >300 | 3 |
| Serum sodium /mEq/l (sr Na) |
135-145 | --- | 145-160 | --- | --- | <120,>160 | 3 |
| Serum Potassium /mEq/l (sr K) |
3.5-5.0 | --- | 5.1-6.0 | --- | --- | >7,<3.5 | 3 |
| Serum uric acid /mg/dL (sr ua) |
2.4-6.0 | --- | --- | --- | --- | >6 | 2 |
| Blood urea /mg/dL (bl ur) |
14-23 | --- | --- | --- | --- | >14-23 | 2 |
| Total protein /mg/dL (tp) |
6.0-8.0 | --- | --- | --- | --- | >8.0 | 2 |
| Serum albumin /mg/dL (sr al) |
3.4-5.4 | --- | --- | --- | --- | >5.4 | 2 |
TABLE 2. Description of the data attributes and membership function.
Proposed E-ANFIS Technique
Step 1
Renal Failure dataset collected from Dr. Jeyasekharan Medical Trust, Kanniyakumari District
• Total instances: 900
• Train data: 600 (430 progression, 170 non-progression)
• Test data: 300 (220 progression, 80 nonprogression)
Step 2
Load the training data in MATLAB. The fuzzy logic toolbox in Matlab provides an environment to build and evaluate fuzzy systems using a graphical user interface. It consists of a FIS editor, the rule editor, a membership function editor, fuzzy inference viewer, and the output surface viewer. The neural network is introduced in the rule editor phase to assign weights for the inputs. ALO optimizer finds the global minimum (non-progression), where the weight should be minimum and global maximum (progression) where the weight should be maximum using its exploratory and exploitation behavior, so the existing back propagation algorithm is replaced by ALO in the membership function editor phase.
Step 3
Modeling of the proposed method (E-ANFIS):
i) Crisp data converted into fuzzy values
ii) Eight input variables and one output variable are introduced to the fuzzy toolbox. ANN will assign a membership function for each variable using Gaussian membership function
iii) The fuzzy inference rule on each variable is determined
iv) The number of membership function and their locations are found for each input
v) Fuzzification is performed by assigning membership values
Step 4
ALO optimization algorithm:
a. Initialization. Randomly initialize the positions of input variables
b. Calculate the cumulative sum of a maximum number of iteration, where iteration represents the steps taken in a random walk. The location of each input’s value is stored in one matrix. The corresponding objective values are stored in another matrix. One more matrix is created for saving the position and fitness value
c. Update the position of the input value by assigning random weight (random walk)
d. Create two vectors, one with a minimum of all variables of one input source and other with a maximum of all variables of the same input. This gives the fitter input weight for the desired output value (building traps)
e. Replace the position of all 8 input variables with the corresponding fit of the other input variables, if it becomes fitter. (entrapment of ants in traps)
f. Finally, update weight and position. (catching preys)
g. Check termination criteria, if termination is satisfied, return the optimal solution, otherwise back to update position. (rebuilding traps)
Step 5
After the inference, automatic rules are generated. Elitism (remember the best solution found) is the important character of a natureinspired algorithm that allows maintaining the best solution obtained at any stage of the optimization process. In this study, the best output obtained in each iteration is saved and considered as an Elite. Since the Elite is the fittest output, it will affect the movements of all the other variable’s weight during iteration. The obtained overall result is a fuzzy value. This result is converted into final crisp output by defuzzification.
Step 6
Defuzzification is performed according to the membership function of the output variable.
Step 7
After training the model, the test data is loaded and the final output is given by E-ANFIS (TABLE 2).
TABLE 3 shows the attribute details and its membership function with output variable. The Gaussian membership function is used in all the fields. The final output variable is GFR. A number of rules framed for the system are 200. The Mamdani system is used for designing the E-ANFIS.
| Type | Mamdani |
|---|---|
| Number of inputs | 8 |
| Input labels | serum microalbumin (sr ma), serum sodium (sr Na), serum potassium (sr K), serum uric acid (sr ua), total protein (tp), blood urea (bl ur), urine albumin (ur al), glomerular filtration rate (gfr) |
| Number of outputs | 1 |
| Output labels | Progression/Nonprogression |
| Number of rules | 200 |
| Optimizer | ALO |
| Defuzzification method | Centre of Sums (COS) |
TABLE 3. E-ANFIS information.
E-ANFIS technique disallowed the local minima and local maxima for receiving an optimal solution. The ALO algorithm is used to compute the input for E-ANFIS algorithm. ANFIS is a grouping of ANN and fuzzy logic. Fuzzy logic has visions into the development of precise quantitative analysis. The parameters decide the shape of the membership function. Fuzzy Logic Toolbox in Matlab gives information about the membership function. Fuzzy modeling procedure learns information about the data set. From the given data set, the proposed algorithm E-ANFIS system is tuned using ALO optimizer. This makes the fuzzy to learn from the model. ALO is applied to adjust the occurrence of local minima and local maxima.
Identifying the progression of renal disease is helpful in maintaining graft construction for dialysis. The E-ANFIS technique is an effective optimization technique.
The trained E-ANFIS was used for estimating GFR at 4, 8, and 12 months. The GFR changes are followed by E-ANFIS. Then the GFR function was estimated for the 4-month period. The results are presented as the value of GFR at a 4-month interval. This shows the relationship between input and output variables. In the same way, GFR values for 8 months and 12 months were predicted. E-ANFIS is able to predict GFR and find out the progression with improved accuracy.
Result and Discussion
This paper introduced an innovative methodology for diagnosing the progression of chronic renal disease. This method is developed by hybridizing ALO and ANFIS. Matlab 2016a version is used for the proposed methodology. The parameters used for validation are accuracy, precision, recall, specificity, and F-Measure.
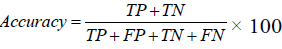
Accuracy
Number of correct output from all output made. Accuracy is not the be-all and end-all metric to use when selecting the best model. Accuracy is the traditional way to measure the performance of a system but equally weighs the positive and negative results, which may not be desirable in an informal retrieval system, as the number of negative results can vastly outweigh the number of positive results. Thus other parameters also considered.
From FIGURE 3 and TABLE 4 it is known that the proposed algorithm is given better accuracy. This is because existing ANFIS uses back propagation algorithm. Back propagation algorithm considers the nearby best fit and the problem is local minima, but there may be a better solution at a distant point. Proposed algorithm rectifies the problem by its exploratory behavior which helps in local optima and local maxima avoidance and with its exploitation behavior, it converges rapidly towards the global minimum and global maximum.

FIGURE 3. Accuracy.
| Jan | May | Sep | |
|---|---|---|---|
| ANN | 73.67 | 69.33 | 71.67 |
| Fuzzy | 77.33 | 72 | 73.33 |
| ANFIS | 78.67 | 79.33 | 76.33 |
| E-ANFIS | 91.33 | 88.33 | 89.33 |
TABLE 4. Accuracy.
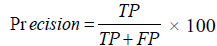
Precision
It can be very precise but inaccurate, also be accurate but imprecise. Precision talks about how precise the model is out of those predicted positive, how many of them are actually positive. The progression of the disease should be identified as a progression. A minor error in identifying this will create unwanted chaos in treating the patient. So, the proposed algorithm should be more précised.
From FIGURE 4 and TABLE 5, it is known that the proposed algorithm gives more number of correct answers. The existing ANFIS fails to identify more correct answers because of the issue in back propagation. The newly added attribute urine microalbumin helps in taking a decision, thus the proposed E-ANFIS gives more precision rate.

FIGURE 4. Precision.
| Jan | May | Sep | |
|---|---|---|---|
| ANN | 87.3 | 84.78 | 86.1 |
| Fuzzy | 87.62 | 85.79 | 85.35 |
| ANFIS | 89 | 89.50 | 87.82 |
| E-ANFIS | 95.75 | 94.69 | 95.63 |
TABLE 5. Precision.
Recall
If a disease progressive patient diagnosed as non-progressive, the cost associated with false negative will be high as the patient is left untreated. It is necessary to prove that the proposed algorithm improves the percentage of recall.
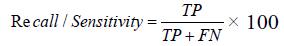
FIGURE 5 and TABLE 6 shows the recall percentage. Network paralysis occurs in existing algorithms when the weights are adjusted from very low to very high and vice versa. The proposed E-ANFIS takes many repeated presentations of the input patterns and the weights are needed to be adjusted before the network is able to settle down into an optimal solution. This improves the percentage of recall in the proposed algorithm.

FIGURE 5. Recall.
| Jan | May | Sep | |
|---|---|---|---|
| ANN | 75 | 70.91 | 73.18 |
| Fuzzy | 80.45 | 74.09 | 76.82 |
| ANFIS | 80.91 | 81.36 | 78.64 |
| E-ANFIS | 92.27 | 89.09 | 89.55 |
TABLE 6. Recall.
Specificity
In medical diagnosis, specificity is the ability of a test to correctly identify those without the disease (true negative rate). In this proposed work true negative is the number of patients who undergoes conservative care.
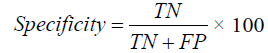
FIGURE 6 and TABLE 7, it is proved that the proposed E-ANFIS performance better than other existing techniques. In the proposed algorithm, a number of fuzzy rules more than the existing ANFIS and are automatically generated in Matlab. This help in decision making through learning from training with the set of new rules.

FIGURE 6. Specificity.
| Jan | May | Sep | |
|---|---|---|---|
| ANN | 70 | 65 | 67.50 |
| Fuzzy | 68.75 | 66.25 | 65.75 |
| ANFIS | 72.50 | 73.75 | 70 |
| E-ANFIS | 88.75 | 86.25 | 88.75 |
TABLE 7. Specificity.
F-measure
FIGURE 7 and TABLE 8 provide the F-Measure details. F1 score might be a better measure to use if we need to seek a balance between Precision and Recall and there is an uneven class distribution (a large number of actual negative). In binary classification, when the dataset is imbalanced, the model is not able to generalize only by giving better accuracy.

FIGURE 7. F-Measure.
| Jan | May | Sep | |
|---|---|---|---|
| ANN | 80.68 | 77.23 | 79.12 |
| Fuzzy | 83.89 | 79.51 | 80.86 |
| ANFIS | 84.76 | 85.24 | 82.97 |
| E-ANFIS | 93.98 | 91.80 | 92.49 |
TABLE 8. F-Measure.
In the most classification problem, it is difficult for human experts to provide sufficient information required to generate fuzzy rules. The proposed method uses the learning capability of ANFIS along with ALO and appropriate membership functions. F-score judges the quality of the algorithm.
Conclusion
E-ANFIS was developed for modeling the renal failure progression with an additional attribute urine microalbumin. The model predicts the GFR for 4-, 8-, and 12-month intervals. Existing ANFIS model uses back propagation algorithm as an optimizer, which has the problem of local minima and local maxima occurrence, but the proposed E-ANFIS overcomes this problem by obtaining global minima and global maxima. Network paralysis occurs in existing ANFIS, but it is rectified in new model E-ANFIS by generating automatic rules equivalent to membership function. Existing ANFIS model is slow in convergence. This convergence problem is also solved in the proposed model by adding a new labeled data urine microalbumin. The proposed algorithm proved as an acceptable method. The comparative analysis has done with ANN, fuzzy, and ANFIS. This proposed algorithm can be used in another application area also, example: stock market to analyze the movement of the stocks by considering the following inputs: 52 weeks high, 52 weeks low, day’s low, day’s high, open price, close price etc. In this study, the number of rules generated by E-ANFIS is more as the number of the membership function of the variables are high, so the computational time may be increased. This can be avoided by considering the most influencing factors of GFR.
Acknowledgment
The renal failure dataset for this study is collected with the support of Dr. Jeyasekharan Medical Trust, Kanniyakumari District.
References
- Subhashini R, Jeyakumar MK, OF-KNN technique: An approach for chronic kidney disease prediction. Int. J. Pure. Appl. Math. 116(24), 331-348 (2017).
- Subhashini R, Jeyakumar MK. Performance analysis of different classification techniques for the prediction of chronic kidney disease. J Adv. Res. Dynamical. Control. Sys. 9(16), 1515-1533 (2017).
- Arthur JM, Elizabeth GH. Evaluation of 32 urine biomarkers to predict the progression of acute kidney injury after cardiac surgery. HHS Pub. Access. 85(2), 431-438 (2014).
- Doreswamy, Hemanth KS. Hybrid data mining technique for knowledge discovery from engineering materials data sets. Int. J Manag. Sys. 3(1), 167-179 (2011).
- Kamna S, Berwal P. Analysis of application of data mining techniques in healthcare. Int. J Comp. App. 148(2), 16 (2016).
- Padmanaban KRA, Parthiban G. Applying machine learning techniques for predicting the risk of chronic kidney disease. Ind. J. Sci. Technol. 29(9), 1-5 (2016).
- Toma P, Kumarb SK. Cadaver kidney demand forecasting and classification modelling of kidney allocation. Procedia. Technol. 25(1), 1162-1169 (2016).
- Yadollahpour MA. Applications of expert systems in management of chronic kidney disease. Ori. J Comp. Sci. Technol. 7(2), 306-315 (2014).
- Khan A, Uddin S. Adapting graph theory and social network measures on healthcare data-A new framework to understand chronic disease progression. Læknabladid. ACT Australia. 16, 1-7 (2016).
- Papadopoulos T, Krochmal M. Omics databases on kidney disease. Clin. Kidney J. 9(3), 343-352 (2016).
- Vijayarani S, Dhayanand S. Kidney disease prediction using SVM and ANN algorithms. Int. J. Comp. Bus. Res. 6(2), 1-12 (2015).
- KDOQI clinical practice guidelines for chronic kidney disease: Evaluation, classification, and stratification: NKF KDOQI guidelines. 1-18 (2016).
- Ojugo AA, Eboka AO, Yoro RE, et al. Hybrid model for early diabetes diagnosis. Second international conference on mathematics and computers in sciences and in industry. INASE. 35(10), 55-66 (2015).
- LaszczySka O, Severo M. Electronic medical record-based predictive model for acute kidney injury in an acute care hospital. Europ. Fed. Med. Inform. 10, 810-812 (2016).
- Hatakeyama Y, Kataoka H, Nakajima N, et al. Baseline estimation for serum creatinine for definition of acute kidney injury. IEEE, ICIS. (2016).