Research Article - Imaging in Medicine (2019) Volume 11, Issue 4
Comparison Of Technical Quality And Average Glandular Dose Between Two Tomosynthesis Mammography Equipments
Renato Caron F1, Thiago Buosi1, Sílvia Sabino SMP1, Martin Eduardo Poletti2 & Adhemar Longatto-Filho3,4,5,6*1Hospital de Câncer de Barretos-Fundação Pio XII, Barretos, Brasil
2Departamento de Física, Faculdade de Filosofia, Ciências e Letras de Ribeirão Preto, Universidade de São Paulo, Ribeirão Preto, SP, Brasil
3Teaching and Research Institute, Molecular Oncology Research Center, Barretos Cancer Hospital – Pio XII Foundation, Brazil
4Department of Pathology, Faculty of Medicine, Medical Laboratory of Medical Investigation (LIM), University of São Paulo, Brazil
5Research Institute of Life and Health Sciences (ICVS), School of Medicine, University of Minho, Braga, Portugal
6ICVS/3B's - Associated Laboratory to the Government of Portugal, Braga / Guimarães, Portugal
- Corresponding Author:
- Adhemar Longatto-Filho
Teaching and Research Institute
Molecular Oncology Research Center
Barretos Cancer Hospital – Pio XII Foundation, Brazil
E-mail: longatto@med.uminho.pt
Abstract
Introduction : The tomosynthesis technology, DBT (Digital Breast Tomosynthesis) arises to aggregate information to the exams of mammography and even replace the two dimensions’ mammography. Quality control of these equipments are mandatory, in order to aiming the radioprotection and the optimization of the image acquisitions.
Methods : The study was prospective, controlled, with the exhibition of only simulating objects for the analysis and comparison of two tomosynthesis equipment. In the Brazilian territory, for the best of our knowledge, there are two brands of breast tomosynthesis equipments: GE equipment, SenoClaire model with nine equipment in operation in Brazil, three of them in the Pio XII Foundation in Barretos, mentioned as Equipment A; and the equipment of Hologic, model Selenia DImensions, with 14 equipment installed and in operation, named Equipment B. Image quality evaluation was performed with a dedicated simulator object for 3D exams. The images were analyzed by 4 radiologists with exams experience in DBT mode. The visualization of the images followed a routine visualization protocol, being a blind, prospective and controlled study. Both, the outcome of the assessment of the structures and the mean glandular dose that each equipment employs in 3D and 2D images, were compared and correlated.
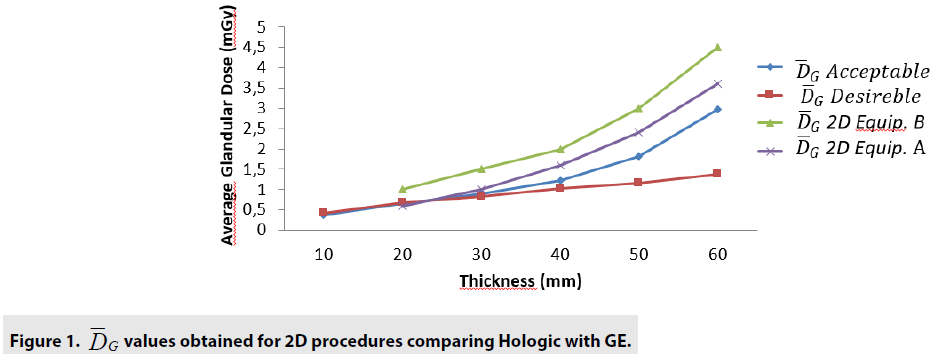
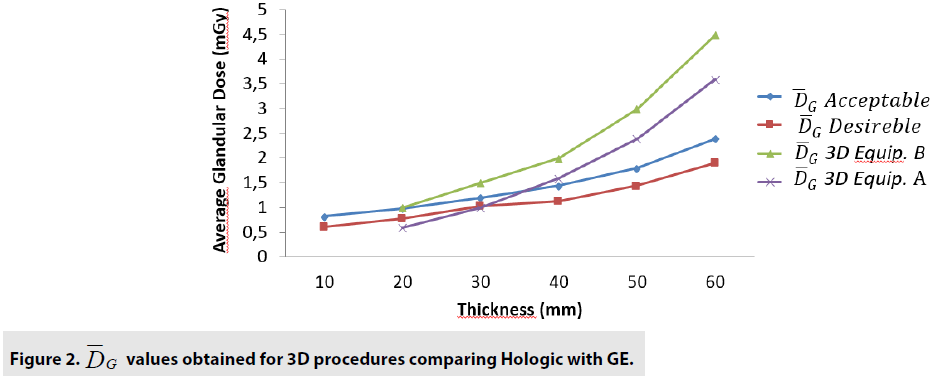
Results : The quality control tests showed that both devices are functioning according to the recommended by international guidelines. The DGM show that for 2D tests, the equipment B presents a DGM similar to the equipment A; however, then again for thicknesses greater than 3.0cm, we started to increase to a 54% greater difference in the B equipment. Nonetheless, even with this higher value, both equipments presented results below the reference values. For 3D mode, the average difference was 24% higher for equipment B in thicknesses from 1.0 up to 6.0cm. The clinical evaluation showed that the 3D technology is superior to 2D. There was no significant differences between the two devices we analyzed, except for the DG for one of the equipment that presented a lower value.
Conclusions : Both equipments confirmed to be accomplished of representing the same amount of structures necessary to be recognized in breast cancer screening.
Keywords
mammography ■ quality control ■ phantom ■ tomosynthesis.
Introduction
Breast cancer is reported as the second most common cancer in the world. This type of malignancy accounts 28% of cases each year. The estimate for 2018 is 59,700 new cases of breast cancer [1].
The global distribution of the breast cancer incidence according to GLOBOCAN show a higher rate in developed countries, followed by developing countries. Comparatively, the mortality rate is lower in countries with lower incidence. Such data can be explained by the success of early diagnosis and effective therapies, leading to a survival of 84% in developed countries and 58% in Brazil, specifically [2-5].
For the early diagnosis, the screening of the asymptomatic population to identify those women at high risk for breast cancer development, is mandatory. With the implementation of an adequate screening policy and effective treatment, there is a substantial decrease in morbidity and mortality rates [6]. The efficacy of mammogram examination depends of many variables importantly linked with the skills and training of the professionals operating the entire system, which involves physics, nurses and medical doctors; also, and critical important, the success of screening largely depends on the quality of the mammography equipment [2,6]. However, as the methodology to obtain excellent imaging utilize ionizing radiation, there is a concern with the quality of the equipment, radioprotection and optimization [7].
Conventional mammography, which generates two-dimensional images, Full Field Digital Mammography (FFDM) presents a well-known tissue overlapping problem. To overcome this image puzzle, the Digital Breast Tomosynthesis (DBT) mammary tomosynthesis equipment was developed. The equipment performs an arch exposition of the compressed breast, by generating several images in different planes, there is the reconstruction of these tissues slices generating a three dimensional image [8,9].
The tomosynthesis equipment comes with the proposal to increase detection rate, reduce unnecessary recall, reduce overlap, lower false negative results and, consequently, better diagnosis. The general characteristics of the tomosynthesis comprise arc scanning, continuous or discrete exposure, and high detector quality (implying rapid detection and low distortion) [10-11].
In the Brazilian territory, for the best of our
knowledge, there are two brands of breast
tomosynthesis equipments: GE equipment,
SenoClaire and the equipment of Hologic,
model Selenia Dimensions. Consequently,
we considered pertinent to analyze such
technologies and compare them from a technical
and image quality point of view by the exposure
of the standard simulator object, specific for
tomosynthesis and the analysis of these images
by a team of radiologists trained and experienced
in the area. From the data of  we will be able
to also compare the radiation exposure [11-16].
The present work aimed the qualitative and comparative evaluation of two mammary tomosynthesis devices, analyzing the response of the equipment to the quality control tests; also, interpreting the images obtained in DBT mode for each equipment; determine the mean glandular dose in DBT mode and, finally, the agreement and differences between the technologies.
Materials and Methods
The study was prospective, controlled, with the exhibition of only simulating objects for the analysis and comparison of two tomosynthesis equipment. In the Brazilian territory, for the best of our knowledge, there are two brands of breast tomosynthesis equipments: GE equipment, SenoClaire model with nine equipment in operation in Brazil, three of them in the Pio XII Foundation in Barretos, we will describe as Equipment A; and the equipment of Hologic, model Selenia DImensions, with 14 equipment installed and in operation, we will call Equipment B.
Image quality evaluation was performed with a dedicated simulator object for 3D exams. The images were analyzed by 4 radiologists with exams experience in DBT mode [17-19]. The visualization of the images followed a routine visualization protocol, being a blind, prospective and controlled study [20-22]. Both, the outcome of the assessment of the structures and the mean glandular dose that each equipment employs in 3D and 2D images, were compared and correlated.
Data collection was obtained from two mammography equipment with DBT technology, one of them located in the Pio XII Foundation in Barretos and another one installed in the Mama Imagem Clinic in São José do Rio Preto county. The characteristics of each equipment are listed in TABLE 1.
| Characteristics | Equipment | Equipment |
|---|---|---|
| A | B | |
| Maximum image size (cm) | 24 × 30 | 24 × 29 |
| Detector Source Distance (cm) | 66.0 | 70.0 |
| Projections Number | 9 | 15 |
| Angular Range (graus) | ± 12.5 | ± 7.5 |
| Detector Rotation | Não | Sim |
| Anode/Filter | Mo/Mo, Mo/Rh e Rh/Rh | W/Rh e W/Al |
| Filter Material and Thickness | Mo: 0.03mm | Al: 0.7mm |
| Rh: 0.025mm | ||
| Detector Pixel Size (µm) | 100 | 70 |
| Scanning Time | 7 s | 3.7 s |
| Tube Movement | Step and shoot | Continuous |
| Tube Voltage | Mo/Mo: 24-30 | 26-40 |
| Mo/Rh: 26-32 | ||
| Rh/Rh: 26-40 | ||
| Detector Type | Integrador | Integrador |
| Detector Material | CsI | a-Se |
| Slab Thickness (mm) | 0.5 | 1 |
Table 1. Characteristics of tomosynthesis equipment.
■ Quality Control Testing
The mammograms used for data collection were firstly passed by quality control tests. These tests had the function of ensuring that the equipment was responding properly and within the quality standards required. For this task it was used the Quality Control of the Physical and Technical Aspects of Digital Breast Tomosynthesis Systems [20,22,23]. The parameters of the tests evaluated are depicted in TABLE 2.
| X-Ray Generation | Tube Output Tube Voltage |
| Half Value Layer | |
| Image Receptor | Image Receptor Response |
| Noise Analysis | |
| Homogeneity of Image Receptor | |
| Uncorrected Defective Detector Elements | |
| Dosimetry | Average Glandular Dose |
| Image Quality | Phantom 2D |
Table 2. Quality Control Parameters Evaluated.
To perform the tests, kerma and kVp meters were with the follow equipment from Radcal Co (CA, USA): Accu-Pro (model 9096), kVp meter (model 40 × 9-MO) and Ionization Chamber (model 10 × 6-6M).
The accessories as aluminum plates, with 99.9% purity, measuring 10 x 10 cm2, five with 0.1 mm thickness and one with 0.5 mm, manufactured by Radcal (CA, USA), were used for the semireductive layer test. For the CNR test, an Al sheet of 2.0 × 2.0 cm2 with the 1 mm thickness, manufactured by Radcal (CA, USA), was used to create the contrast difference. 7 polymethylmethacrylate (PMMA) plates, each with 18 × 24 cm2 and 1.0 cm thicknesses and spacers of dimensions 18 × 1.5 cm2 and thicknesses of 1, 2, 5, 10 and 20 mm were used for the data collection of ki. The Gammex 156 breast phantom, of dimensions 10.2 x 10.8 × 4.5 cm was used to evaluate the quality of the mammographic image [23,24]. The images were analyzed by the ImageJ program of the USA National Institutes of Health.
■ Simulator Object Characteristics
The simulator object, CIRS model 020 BRD3D (CIRS, Norfolk, VA, USA) is produced with heterogeneous material, simulating the composition of a breast in the proportion of 50% glandular and 50% adipose. Inserted in one of its 6 plates of 1.0 cm of thickness. On the target slices there are mammographic findings that simulate, fibers, masses and microcalcifications. The other 5 slices of the object are basically heterogeneous material [25].
■ Exposure Method
Exposures occurred in standard auto mode, with 2D and 3D displays on both devices. The simulator was positioned centrally in the bucky, with a radiation field of 18 × 24 cm. The target slice was initially placed in the most superficial region. At each exposure, it was displaced down the subsequent heterogeneous slice, when the target slice was the last layer, one of the heterogeneous slices was removed, decreasing the thickness of the object. This process was done until only the target slice remained [26].
■ Image Analysis
For each device, 21 images were performed in DBT mode, 21 synthesized images and 21 images in 2D mode. The images were sent to a dedicated mammography workstation, with 21.3 inch monitors and 5 MegaPixel resolution. Four radiologists with experience in tomosynthesis examination reports performed the reading of the images following a visualization protocol: first, the caudal and midlateral images were visualized in 2D, followed by the synthesized images, slabs and finally the slices of each projection. They summed 126 images, 504 readings and one n of 1512 structures visualized. Radiologists quantified the structures, microcalcifications fibers and masses. The images were not identified for the radiologists; however, there was no loss of quality, the home equipment sent the images to their respective workstations.
■ Observer Training
Before observers start reading the Phantom CIRS BR3D images, the radiologists were sensitized to the Phantom images. For each, 4 images of the simulating object were made available, and the standard of the findings of microcalcifications, masses and fibers were presented. For each image, radiologists had to quantify the structures and a well-trained medical physicist was consulted to settle any difficulties in visualizing the images.
■ Average glandular dose
Average glandular dose values were obtained
from the DICOM image header. Thus, for each
exposition, in both 2D and 3D, each equipment
presented a value of  that was later used to
compare the technologies, equipment and
thicknesses of the simulator object.
■ Evaluation of data
For the results obtained, the mean, standard deviation and 95% confidence intervals were calculated for the quantitative information obtained in each of the devices to analyze the correlation of the results. For the comparison of the number of mammographic findings between the machines and between the modes of operation, the Mann-Whitney test was used, as well as for the analysis of the dose results, which were compared between the equipment at each stage. The comparison between the operating modes of each technology was performed by the Chi-square test. Finally, the calculations were done with IBM SPSS software v.21.0 and Office Excel 2010.
Results
■ Quality control tests
The quality control tests showed that both devices
are functioning according to the recommended
values and the Protocol for the Quality Control
of the Physical and Technical Aspects of Digital
Breast Tomosynthesis System; thus, ensuring
that the mammographies are responding within
the expected and guaranteeing the quality of the
images and data, it was possible to expose the
CIRS BR3D simulator object and collect the  data.
data.
■ Analysis of structures in DBT modes
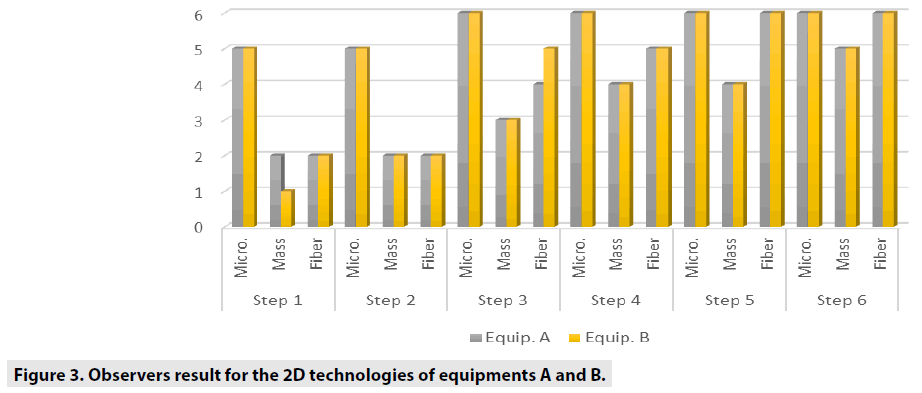
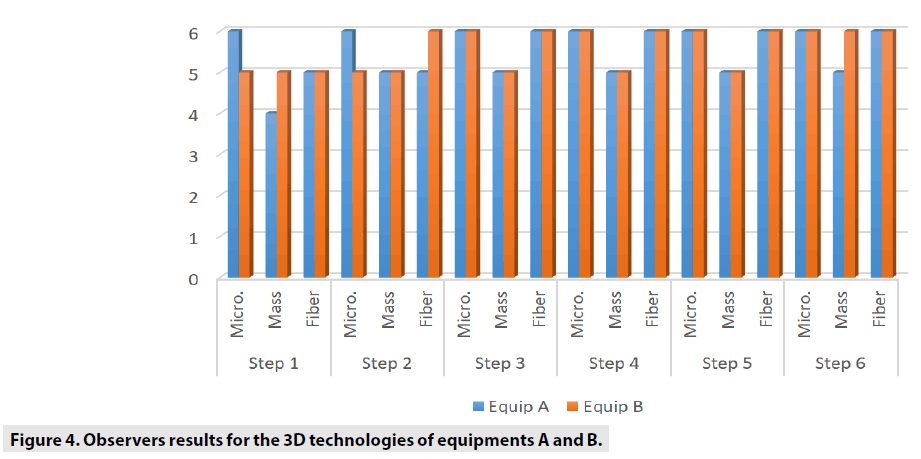
TABLE 3 shows the general comparisons between each 2D and 3 along six steps, considering microcalcification, mass and fiber variables.
| 2D | 3D | ||||||
|---|---|---|---|---|---|---|---|
| Micro. | Mass | Fiber | Micro. | Mass | Fiber | ||
| Step 1 | p-value | 0,498 | 0,031 | 0,869 | 0,763 | 0,115 | 0,043 |
| Step 2 | 0,773 | 0,193 | 0,284 | 0,015 | 0,999 | 0,181 | |
| Step 3 | 0,333 | 0,267 | 0,151 | 0,999 | 0,999 | 0,275 | |
| Step 4 | 0,999 | 0,702 | 0,862 | 0,999 | 0,627 | 0,999 | |
| Step 5 | 0,999 | 0,999 | 0,999 | 0,999 | 0,200 | 0,999 | |
| Step 6 | 0,999 | 0,286 | 0,999 | 0,999 | 0,999 | 0,999 | |
Table 3. Mann-Whitney U test result for comparison of observers results between the equipments in each 2D and 3D models.
TABLE 4 shows the comparisons between the equipments A and B analyzed by Mann- Whitney U test.
| Equipment A | Equipment B | ||||||
|---|---|---|---|---|---|---|---|
| Micro. | Mass | Fiber. | Micro. | Mass | Fiber. | ||
| Step 1 | p-value | 0,048 | 0,001 | 0,001 | 0,556 | 0,001 | 0,001 |
| Step 2 | 0,001 | 0,001 | 0,001 | 0,155 | 0,001 | 0,001 | |
| Step 3 | 0,101 | 0,001 | 0,001 | 0,999 | 0,001 | 0,001 | |
| Step 4 | 0,999 | 0,002 | 0,021 | 0,999 | 0,001 | 0,014 | |
| Step 5 | 0,999 | 0,009 | 0,631 | 0,999 | 0,026 | 0,999 | |
| Step 6 | 0,999 | 0,999 | 0,999 | 0,999 | 0,171 | 0,999 | |
Table 4. Mann-Whitney U test result for comparison of the observer results between the 2D and 3D models for each equipment.
With the analysis of DGM, for each incidence and in each step, for the two equipments, it was possible to compare the means of the DGM of the equipments as demonstrated in TABLE 5.
| 2D (mGy) | 3D (mGy) | |||||
|---|---|---|---|---|---|---|
| Step | Equip. B | Equip. A | Valor-p | Equip. B | Equip. A | p-value |
| 1 | 2,97 | 1,37 | 0,002 | 2,4 | 1,9 | 0,002 |
| 2 | 1,82 | 1,15 | 0,008 | 1,8 | 1,45 | 0,008 |
| 3 | 1,22 | 1,03 | 0,029 | 1,45 | 1,13 | 0,290 |
| 4 | 0,89 | 0,83 | 0,100 | 1,2 | 1,04 | 0,100 |
| 5 | 0,66 | 0,67 | 0,999 | 0,99 | 0,78 | 0,333 |
| 6 | 0,38 | 0,41 | 0,999 | 0,83 | 0,61 | 0,999 |
Table 5. Comparison of DGM in 2D and 3D models for both devices.
The FIGURES 1-3 show the curves obtained with 2D and 3D Hologic and GE equipments analysis.
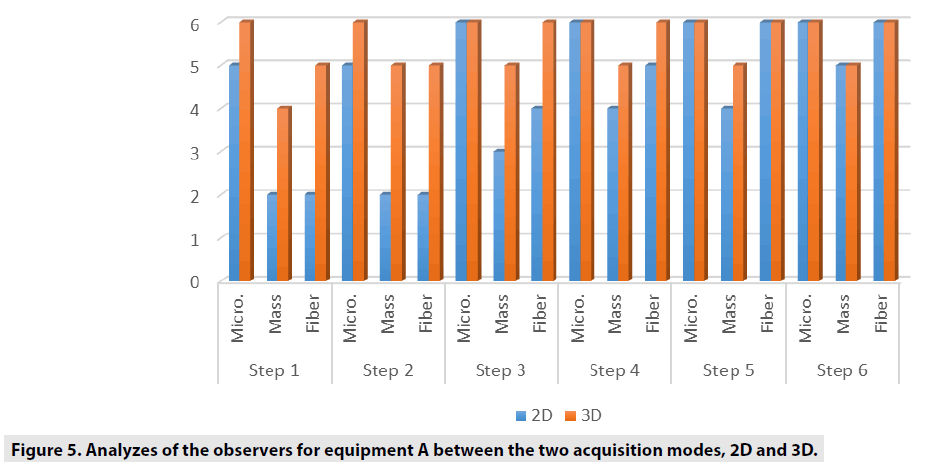
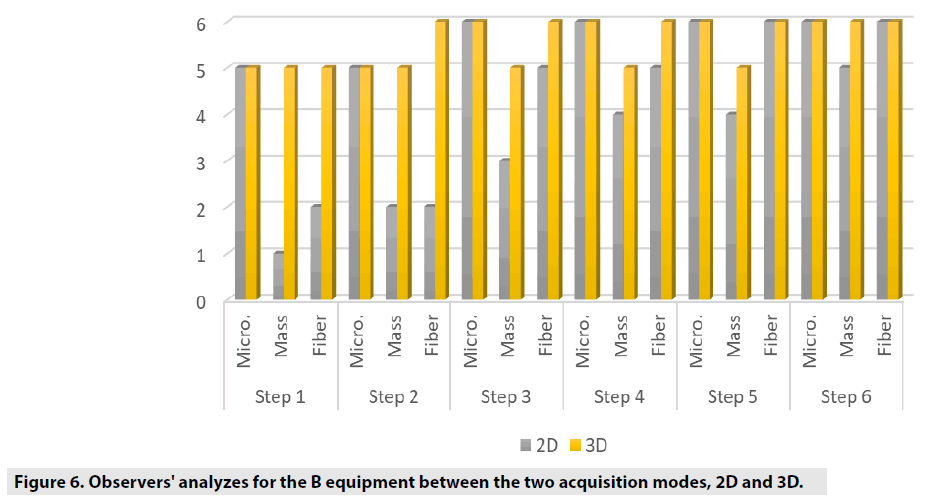
FIGURES 4-6 exhibit the histograms of observers performances. Each histogram has a comprehensive legend to highlight the main findings of the observers.
Discussion and Conclusion
The comparison we intended to observe between 2D and 3D operating modes for each equipment we used presented results with different values. The comparison, indicates that for equipment A, the 3D mode of operation, results in higher significant values of the structure representation. This was particularly significant for microcalcifications, that is pos s ible in 3D mode. The equipment A was able to represent in 3D mode, in thicknesses larger than 5.0 cm, two more sets of microcalcifications. In general, the observers were capable to visualize a greater amount of figures in 3D mode than in 2D mode. Most of these findings were depicted in tables and figures that illustrate the results obtained in this study. Starting by the comparison of performances achieved by the M a n-Whitney U test methodology, it was evi d enced very promising points to be discussed in the breast cancer prevention strategies. F or example, we demonstrated that of the two t e chnologies, are quite equivalents. However , there were substantial differences, for 3 steps, which did not compromise the overall performances of the equipments. Importantly, the two equipments confirmed to be accomplished o f representing the same amount of structures necessary to be recognized in breast cancer screening. The DGM results show that for 2D tests, the equipment B presents a DGM similar to th e equipment A; however, then again for thicknesses greater than 3.0 cm, we started to increase to a 54% greater difference in the B equipmen t . Nonetheless, even with this higher value , both equipments presented results below the reference values. For 3D mode, the average difference was 24% higher for equipment B in thicknesses from 1.0 up to 6.0 cm.
Conford EJ et al. [27] conducted a study of the DBT system with the GE equipment, where he concluded that this system shows satisfactory results for replacement of complementary tests. By evaluating the ability to represent in different ways, separately for each equipment, both showed that 3D technology is a tool that should be explored, since the results for visualizations, mainly of masses and fibers, had significant results (p <0.005 ); similarly, Skaane et al. [25,28], and Meyblum and co-workers 2015 concluded that 3D technology exhibit more satisfactory results when analyzing the significance of the visualization results of the CIRS BR3D phantom [29,30].
Peters and colleagues, performed the comparison of the two equipment we herein evaluated with the same simulator object; nevertheless, only the analysis of microcalcifications was achieved, and the results were considered plenty satisfactory. It is important to notice that the current study involved both the qualitative and comparative assessment between two technologies used in daily routine, aiming the verification of sensitivity of the technical and clinical responses between the two DBT technologies analyzed. The equipment underwent an evaluation of the technical quality control in order to verify its responsiveness with the limit values of operation established by international protocols . Both equipment presented adequate results. The quantitative evaluation of the two technologies presented similarities in relation to the clinical image evaluation inquiries, due to the ability to represent the simulation of mammographic findings such as microcalcifications, masses and fibers distribution. By the statisti cal analysis, there were no significant differences that could segregate one of the two equipments we studied. However, the technical evaluation of the equipment resulted in a difference with regard to DGM, where one of the equipments execute the images acquisition in DBT mo de with expositions to the smaller ioniz ing radiation, consequently to a smaller DGM. The study endorses the necessity to highlight procedures of continued training for those professionals involved in mammography interpretation. 3D technology seems to be important to enhance the skills of improve the interpretation of small calcifications and recognize lesions that merit to be sampled. Further studies can address the performance of professionals in real scenarios of mammography interpretation and design stringent protocols for diagnoses quality assurance. In conclusion, since there is an indication of this new technology for populational mammography screening and, since there is no difference in clinical image quality, the exposure to ionizing radiation should be taken into account for this critical decision.
References
- Bray F, Ferlay J, Soerjomataram I et al. Global cancer statistics 2018: GLOBOCAN estimates of incidence and mortality worldwide for 36 cancers in 185 countries. CA. Cancer. J. Clin. 68: 394-424, (2018).
- Berry DA, Cronin KA, Plevritis SK et al. Effect of screening and adjuvant therapy on mortality from breast cancer. N. Engl. J. Med. 353: 1784-1792, (2005).
- Lee BL, Liedke PE, Barrios CH et al. Breast cancer in Brazil: present status and future goals. Lancet. Oncol. 13: 95-102, (2012).
- http://www2.inca.gov.br/wps/wcm/connect/tiposdecancer/site/home/mama
- Torre LA, Bray F, Siegel RL et al. Global cancer statistics, 2012. CA. Cancer. J. Clin. 65: 87-108, (2015).
- Gøtzsche PC, Nielsen M. Screening for breast cancer with mammography. Cochrane. Database. Syst. Rev. 19: 1-10, (2011).
- Choi Y, Woo OH, Shin HS et al. Quantitative analysis of radiation dosage and image quality between digital breast tomosynthesis (DBT) with two-dimensional synthetic mammography and full-field digital mammography (FFDM). Clin. Imaging. 55: 12-17, (2019).
- Roark AA, Dang PA, Niell BL et al. Performance of Screening Breast MRI After Negative Full-Field Digital Mammography Versus After Negative Digital Breast Tomosynthesis in Women at Higher Than Average Risk for Breast Cancer. AJR. Am. J. Roentgenol. 212: 271-279, (2019).
- Giess CS, Pourjabbar S, Ip IK et al. Comparing Diagnostic Performance of Digital Breast Tomosynthesis and Full-Field Digital Mammography in a Hybrid Screening Environment. AJR. Am. J. Roentgenol. 209: 929-934, (2017).
- Sechopoulos I. A review of breast tomosynthesis. Part II. Image reconstruction, processing and analysis, and advanced applications. Med. Phys. 40: 14-17, (2013).
- Sechopoulos I. A review of breast tomosynthesis. Part I.The image acquisition process. Med. Phys. 40: 1-12, (2013).
- Sechopoulos I, D'Orsi CJ. Glandular radiation dose in tomosynthesis of the breast using tungsten targets. J. Appl. Clin. Med. Phys. 9: 2887, (2008).
- Sechopoulos I, Suryanarayanan S, Vedantham S et al. Radiation dose to organs and tissues from mammography: Monte Carlo and phantom study. Radiology. 246: 434-443, (2008).
- Cockmartin L, Bosmans H, Marshall NW. Comparative power law analysis of structured breast phantom and patient images in digital mammography and breast tomosynthesis. Med. Phys. 40: 8-13, (2013).
- Chan H-P, Goodsitt MM, Helvie MA et al. Digital breast tomosynthesis: Observer performance of clustered microcalcification detection on breast phantom images acquired with an experimental system using variable scan angles, angular increments, and number of projection views. Radiology. 273: 675-685, (2014).
- Cornford EJ, Turnbull AE, James JJ et al. Accuracy of GE digital breast tomosynthesis vs supplementary mammographic views for diagnosis of screen-detected soft-tissue breast lesions. Br. J. Radiol. 89: 1058, (2016).
- Bouwman RW, Diaz O, Van Engen RE et al. Phantoms for quality control procedures in digital breast tomosynthesis: dose assessment. Phys. Med. Biol. 58: 4423-4438, (2013).
- Balta C, Bouwman RW, Sechopoulos I et al. A model observer study using acquired mammographic images of ananthropomorphic breast phantom. Med. Phys. 45: 655-665, (2018).
- Meyblum E, Gardavaud F, Dao TH et al. Breast tomosynthesis: Dosimetry and image quality assessment on phantom. Diagn. Interv. Imaging. 96: 931-939, (2015).
- Chevalier RM. New mammography technologies and their impact onradiation dose. Radiologia. 55: 25-34, (2013).
- Sechopoulos I, Sabol JM, Berglund J et al. Radiation dosimetry in digital breast tomosynthesis: report of AAPM Tomosynthesis Subcommittee Task Group 223. Med. Phys. 41: 1-10, (2014).
- Pedersen K, Nordanger J. Quality control of the physical and technical aspects of mammography in the Norwegian breast-screening programme. Eur. Radiol. 12: 463-470, (2002).
- Tirada N, Li G, Dreizin D et al. Digital Breast Tomosynthesis: Physics, Artifacts, and Quality Control Considerations. Radiographics. 39: 413-426, (2013).
- Strudley CJ, Young KC, Looney P et al. Development and experience of quality control methods for digital breast tomosynthesis systems. Br. J. Radiol. 88: 1056, (2015).
- Skaane P, Bandos AI, Gullien R et al. Comparison of digital mammography alone and digital mammography plus tomosynthesis in a population-based screening program. Radiology. 2013; 267: 47-56, (2013).
- Cockmartin L, Bosmans H, Marshall N. Comparative power law analysis of structured breast phantom and patient images in digital mammography and breast tomosynthesis. Med. Phys. 40: 8, (2013).
- Cornford EJ, Turnbull AE, James JJ et al. Accuracy of GE digital breast tomosynthesis vs supplementary mammographic views for diagnosis of screen-detected soft-tissue breast lesions. British. J. Radiol. 89: 1058, (2016).
- Skaane P, Bandos AI, Gullien R et al. Prospective trial comparing full-field digital mammography (FFDM) versus combined FFDM and tomosynthesis in a population-based screening programme using independent double reading with arbitration. Eur. Radiol. 23: 2061-2071, (2013).
- Meyblum E, Gardavaud F, Dao TH et al. Breast tomosynthesis: Dosimetry and image quality assessment on phantom. Diag. Interven. Imaging. 96: 931-939, (2015).
- Peters S, Hellmich M, Stork A et al. Comparison of the Detection Rate of Simulated Microcalcifications in Full-Field Digital Mammography, Digital Breast Tomosynthesis, and Synthetically Reconstructed 2-Dimensional Images Performed With 2 Different Digital X-ray Mammography Systems. Invest. Radiol. 52: 206-215, (2017).
