Research Article - Clinical Investigation (2018) Volume 8, Issue 4
Comparison of neuromuscular fatigue in chronic stroke patients with healthy controls
- Corresponding Author:
- Shweta Kotwani
Department of Neuro-Physiotherapy, Smt Kashibai Navale College of Physiotherapy, Pune-41, India
E-mail: shweta.kotwani31528@gmail.com
Submitted Date: 10 September 2018; Accepted Date: 24 September 2018; Published Date: 26 September 2018
Abstract
Background and Introduction: Fatigue has been defined as a feeling of early exhaustion, weariness, lack of energy and aversion to effort. Glader et al suggest that survivors of stroke with fatigue have a higher fatality rate three years after stroke due to its association with sedentary lifestyle. Neuromuscular fatigue is defined as an activity induced impairment in the ability to exert force, and is quantified by the reduction in force that a muscle or muscles can exert following or during an activity. Fatigue of the paretic leg muscles is likely to greatly impact walking function post-stroke. Therefore, quantitative measures of neuromuscular fatigue of the paretic leg muscles are expected to be associated with walking function in people post-stroke. There is scant research, which specifically investigates neuromuscular fatigue following stroke. The purpose of the study was to assess and compare the contribution of neuromuscular fatigue in patients following stroke with age and gender matched healthy participants.
Methodology: Subjects (N=80) were divided into experimental group (N=40) and control group (N=40) by purposive sampling. Patients who were already been diagnosed with chronic stroke (>6months) by Registered Medical Practitioner (RMP) were included in the study. The muscle activity of the quadriceps and hamstrings on the subject’s paretic as well as non-paretic side were recorded using Dual Bio Amp/Stimulator. Pre- fatigue inducing exercise (Electromyography) EMG signals (integral mean values in mVs) were recorded by performing Maximal Voluntary Contraction (MVC) of both the muscles. Post-fatigue inducing exercise EMG signals (integral mean values in mVs) by performing Sit-To-Stand test (STS). Visual Analog Fatigue Scale (VAFS) was used to assess the subjective levels of fatigue pre and post exercise while Fatigue Severity Scale (FSS) was used to assess chronic fatigue.
Results: In paretic, non-paretic and control study group, the mean pre-fatigue EMG activity of hamstrings is significantly higher compared to mean post-fatigue EMG activity of hamstrings (P-value<0.001). In paretic, non-paretic and control study group, the mean pre-fatigue EMG activity of quadriceps is significantly higher compared to mean post-fatigue EMG activity of quadriceps (P-value<0.001).
Conclusion: It was concluded that there is a difference seen in the peripheral neuromuscular fatigue in the chronic stroke individuals when compared with age and gender matched control group.
Keywords
Chronic fatigue, Chronic stroke, Peripheral neuromuscular fatigue, Surface electromyography, Fatigue severity scale, Visual analog fatigue scale
Introduction
Fatigue is a psychophysiological state experienced in daily life. It is generally defined as a feeling of lack of energy and motivation that can be physical, mental or both. It can be described as a feeling of weakness or muscle pain, or a decrease in performance during physical or cognitive activities. Fatigue is due to action potentials of motor units having a similar pattern of repolarization, fast motor units activating and then quickly deactivating while slower motor units remain deactivated, and conduction velocities of the nervous system decreasing over time.
Neuromuscular fatigue is defined as an activity induced impairment in the ability to exert force, and is quantified by the reduction in force that a muscle or muscles can exert following or during an activity [1,2].
Abnormally high levels of neuromuscular fatigue have the potential to limit physical activity and result in a loss of physical independence. Increased neuromuscular fatigue may be concomitant with muscle weakness, or an independent phenomenon, and is identified as of particular relevance in people with neurological pathologies, such as stroke [1].
Peripheral Neuromuscular Fatigue (PNMF) may result from the accumulation of metabolites, depletion of substrates such as glycogen, effects on excitationcontraction coupling and deficits in the transmission of impulses at the neuromuscular junction. Central neuromuscular fatigue is identified as depletion in the voluntary activation of the motor neuron pool by the nervous system. Deficits in voluntary activation may occur as a result of changes at any level of the nervous system including; the frontal and pre-frontal areas, the motor cortex and sub cortical structures and the spinal networks. Researchers suggest that deficits in voluntary activation may occur due to a decrease in motor evoked potentials, increased cortical excitability threshold, increased intracortical inhibition, increased inhibition from afferents and reduced motor unit firing rates [3-5].
Cerebrovascular Accident (CVA) is a term which is used interchangeably with stroke to refer to the vascular conditions of the brain. Stroke is likely to influence motor output in two ways; through the primary effects of central nervous system lesion on neuromuscular output, and through the development of secondary changes in the neuromuscular system as a result of the events which occur following stroke, such as immobilization and physical inactivity [3,4]. In survivors of stroke, decreased aerobic capacity, decreased endurance, and increased energy expenditure associated with impaired motor movements may be related to fatigue and can further affect daily functions such as walking [5]. Fatigue of the paretic leg muscles is likely to greatly impact walking capacity post-stroke. Changes in neuromuscular fatigue in people post-stroke could not only limit walking distance and speed but may also interfere with the volitional control of joints. Therefore, quantitative measures of neuromuscular fatigue of the paretic leg muscles are expected to be associated with walking function in people post-stroke [6].
One of the objective assessment methods to evaluate muscle fatigue is Electromyography (EMG). EMG is a technique for evaluating and recording the electrical activity produced by skeletal muscles. Surface electrodes pick up the electrical activity of superficial muscles, and the amplitude and the power spectrum of the signal can be determined. The amplitude reflects the number and size of action potentials in the muscle over a given period. Electromyography is a research technique that allows researchers to look at muscle recruitment in various conditions, by quantifying electrical signals sent to muscle fibers through motor neurons. In most studies, this increase in recruitment during exercise correlated with a decrease in performance.
In the field of EMG with reference to Sit to stand (STS) test, neuromuscular activity during the process of rising from a chair has been studied in different physical environments [7]. One of the variables most often considered in STS electromyographic studies is muscle fatigue, which is observed as a decrease in performance after exercise. Motor control may be affected when fatigue is induced by the repetitive voluntary contractions of muscle groups used in the STS test [8]. In fact, there are studies that use the STS test as a prior protocol to induce fatigue in the lower limbs [9].
Through this study was aimed to estimate the fatigue levels of stroke patients. Thus, during interventions care can be taken that the fatigue level of the patient is not reached and the hazardous effects of fatigue can be eliminated. The purpose of this study was to examine and compare the peripheral neuromuscular fatigue during a sustained maximal voluntary isometric contraction of the quadriceps and hamstrings muscle in the hemiplegic leg of people with stroke and Sit to Stand test (STS), with that of age and gender matched controls.
Subjects and Methods
Inclusion of subjects
The inclusion criteria were stroke individuals diagnosed by Registered Medical Practitioner (RMP) with a single episode of at least 6 months prior to inclusion. Control participants with no history of neurological disturbance or illness, no cardiovascular history and of similar age and gender were recruited in the study. In total, 80 subjects were included in the cross-sectional study out of which 40 chronic stroke patients and 40 controls were distributed by purposive sampling. The samples of the current study represented a group of chronic stroke individuals (N=40) (M=55.6 years, SD=7.986) with a greater range of ages (42-75 years). This may have resulted in a sample which is more representative of the general stroke population, given that stroke is an age- related pathology (Table 1 and Figure 1). In the current study the average time since onset of stroke in months was M=22.3 (SD ± 20.825). The time since onset of stroke may be relevant when considering fatigue related changes following stroke, potentially the longer the time since onset of stroke, the greater the likelihood for secondary neural changes, muscle atrophy and muscle composition changes. Participants were only excluded from the study if they were not able to transfer from a sitting to a standing position without assistance or if they had an impairment which was likely to influence their ability to participate in the procedure. This potentially resulted in a heterogeneous stroke sample. The heterogeneity of the stroke sample is illustrated by the variation seen in sit to stand ability (range=8-50 repetitions), duration of the onset of stroke (Mean=22 months). In addition, in the study sample there was a predominance of participants with right hemiplegia, with 22 participants (55%) having right hemiplegia and 18 (45%) having left hemiplegia (Figures 3-4).
| Parameters | Stroke Group (n=40) | Control Group (n=40) | |
|---|---|---|---|
| Age (years) | Mean ± SD | 55.6 ± 7.9 | 55.1 ± 7.3 |
| Gender | Male, n (%) | 38 (95.0%) | 38 (95.0%) |
| Female, n (%) | 2 (5.0%) | 2 (5.0%) | |
| Affected Side (Paretic) | Left, n (%) | 18 (45.0%) | -- |
| Right, n (%) | 22 (55.0%) | -- | |
| Onset of Stroke (Months) | Mean ± SD | 22.3 ± 20.8 | -- |
Table 1: Distribution of demographic characteristics of subjects studied across two study groups
Methods
Ethical approval from the ethical committee of the institute was obtained. Dependent variables were obtained through electromyographic measures (ML870 POWERLAB 8/30 ML408 Dual Bio Amp/Stimulator) pre and post Sit to Stand (STS) test. The muscle activity of the quadriceps and hamstrings on the subject’s paretic as well as non-paretic side was recorded. To ensure good adhesion, the skin was washed with alcohol swabs and two disposable ECG electrodes were placed on each muscle and one for earthen. Pre-fatigue inducing exercise EMG signals (integral mean values in mVs) were recorded by performing Maximum Voluntary Contraction (MVC) of quadriceps and hamstrings muscle. The sit to stand (STS) test is used to test leg strength and endurance. For this test patient was asked to sit in the middle of the chair/stool with feet flat on the floor and arms folded across the chest. Rise to a full stand and return to a complete sitting position. Repeat the test as many times as the patient is able to until he/she feels exhausted. Total duration of the STS test was recorded using stopwatch. Post the STS test immediately the EMG signals for the same muscles were recorded. Visual analog fatigue scale (VAFS) was used to assess the subjective levels of fatigue pre and post exercise while Fatigue Severity Scale (FSS) was used to assess chronic fatigue. VAFS consists of a 10cm horizontal line; subjects are asked to mark on the line the point that they feel represents their perception of their current state. Where 0 implies worst fatigue and 10 being normal will obtain the score [10-13]. Use of the VAFS before and after the fatigue-inducing protocol ensured that the fatigue being measured attributed to the exertion during exercise. To report fatigue that is induced by exercise, exertion fatigue was calculated by determining the difference between fatigue level at baseline and immediately after exercise. Thus, intragroup comparison of the VAFS before and after the fatigue-inducing exercise showed statistical significance. This could be attributed to the fact that the visual analog assessment is used at a single time point to represent fatigue [10,12]. This measure was used in the present study to quantify changes of fatigue level during the exercise. Hence, no statistical significance was seen for intergroup comparison of the VAFS for both the population. (p=0.598). The distribution of mean postfatigue activity % change in VAFS score did not differ significantly between Stroke group and Control group (P-value>0.05). The 9-item scale, which measures the severity of fatigue and its effect on a person’s activities and lifestyle in patients with a variety of disorders [11-15] The distribution of mean FSS is significantly higher in Stroke group compared to mean FSS in Control group (P-value<0.001) (Figure 4).
Statistics
The inter-group statistical comparison of continuous variables was done using independent sample t test for two groups and using ANOVA (by Bonferroni’s post-hoc correction for multiple group comparisons 66-68) for three groups. The intra-group comparison was done using paired t test. The underlying normality assumption was tested before subjecting the study variables to t tests and ANOVA. The entire data was statistically analyzed using Statistical Package for Social Sciences (SPSS ver 21.0, IBM Corporation, USA) for MS Windows.
Results
Quadriceps muscle
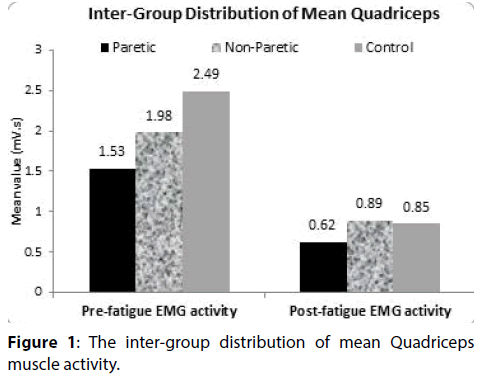
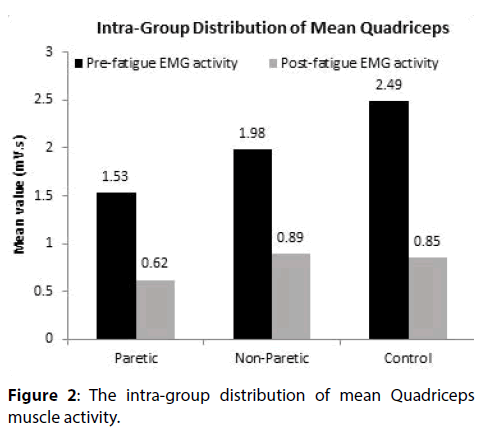
The distribution of mean pre and post-fatigue EMG activity of quadriceps did not differ significantly across the study groups (paretic and non-paretic study group; non-paretic and control group) (P-value>0.05 for all). The distribution of mean post-fatigue EMG activity of quadriceps differ significantly between paretic and control study group (P-value<0.05). In paretic, nonparetic and control study group, the mean pre-fatigue EMG activity of quadriceps is significantly higher compared to mean post-fatigue EMG activity of quadriceps (P-value<0.001).
Hamstrings muscle
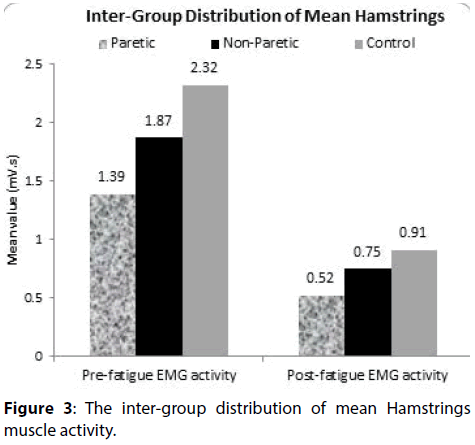
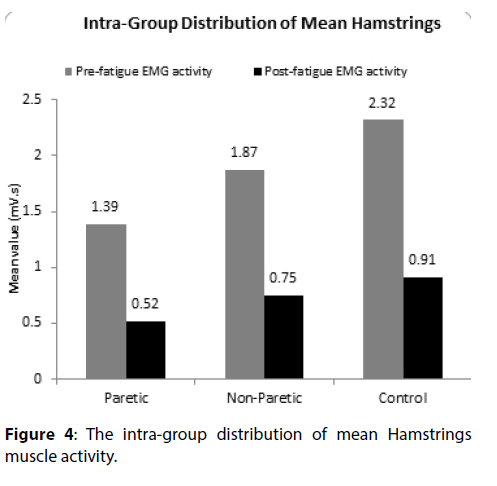
The distribution of mean pre and post-fatigue EMG activity of hamstrings did not differ significantly across the study groups (paretic and non-paretic study group; non-paretic and control group) (P-value>0.05 for all). The distribution of mean post-fatigue EMG activity of hamstrings differ significantly between paretic and control study group (P-value<0.05). In paretic, non-paretic and control study group, the mean pre-fatigue EMG activity of hamstrings is significantly higher compared to mean post-fatigue EMG activity of hamstrings (P-value<0.001).
Discussion
Neuromuscular fatigue is an activity induced reduction in the capacity to produce force, and is the result of changes which may occur in both the peripheral and central structures of the neuromuscular system in response to a motor task. Evidence of alterations in both neural circuitry and muscular properties following stroke suggest that the neuromuscular fatigue profile of people following stroke is likely to be altered when compared to normal participants [2]. Age-related declines in contractile strength result primarily from muscle atrophy, whereas deficits in contractile power persist after adjustment for muscle mass, because maximum contractile velocity falls markedly with aging [2]. However, the influences of age-related neuromuscular changes on all measures [2], was controlled for by an age-matched control group in this study.
To avoid the problem of heterogeneity researchers can define the study sample based on lesion location or size, for example; to only include participants with middle cerebral artery infarcts or with those with cortical lesions. Prior studies which have evaluated total neuromuscular fatigue in people with mild neuromuscular impairment following stroke have demonstrated no difference in the level of total neuromuscular fatigue of stroke participants when compared to control participants. The difference between the current study and previous studies in people with stroke may relate to, evaluation of peripheral neuromuscular fatigue only, differences in the level of neuromuscular impairment, differences in the fatigue task or differences in the method used to quantify peripheral neuromuscular fatigue. The comparison of peripheral neuromuscular fatigue between paretic and control group was statistically significant p<0.05 whereas between paretic and nonparetic group no statistical significance p>0.05 was seen. This could be explained by an increase in the proportion of type I muscle fibres in comparison to type II fibres in the stroke group [16]. After a stroke the number of Type II fibers progressively decrease, resulting in a loss of skeletal muscle cross-sectional area [16,17]. After a stroke, there is a decreased descending neural input to the alpha motor neurons, which leads to downstream degeneration of the muscle fibers; typically, however, viable adjacent motor neurons adopt some of the muscle fibers, creating fewer yet larger motor units. Reorganization of motor units occurs as early as 9 days’ post stroke, and the number and size of motor units are stabilized after 3 months [18,19]. The motor units lost tend to be large alpha motor neurons innervating fast-twitch fibers, which are more susceptible to death; the result is a muscle composed predominantly of larger and slower motor units [20].
In one of the previous study by Gray et al. [20], at 1-month post stroke, no change in lean muscle mass were found in the paretic leg or arm with DEXA imaging, but by 2-4 months a decrease in lean muscle mass was evident in the paretic leg and arm muscles with both DEXA and CT imaging [21]. In the chronic phase (>6 months after stroke), a decrease in lean muscle mass on the paretic side relative to the non-paretic side was found with both DEXA and CT imaging, meaning that many people with stroke are living with long-term effects of decreased muscle mass in the paretic muscles [21].
The muscle atrophy in hemiplegic patients was thought to progress in order of type IIB, type IIA and type I fiber hypertrophy and the muscle fiber atrophy was not related to the period of onset, severity of paralysis but to the lack of muscle use in daily physical activity. Thus, a considerable amount of disuse adds to the muscle atrophy seen in the hemiplegic patients [17]
Diminished force production and contraction speed secondary to muscle atrophy may be observed as difficulty with sit to stand transfers [21] in stroke patients. This may also be a contributing factor to the peripheral neuromuscular fatigue experienced by the stroke population of the current study which is evidenced by the statistically significant difference seen in the intragroup comparison of pre and post STS activity mean values of paretic and non-paretic limb (p=0.001).
Hyngstrom et al. compared the stroke-related changes in hip-flexor musculature of the paretic leg during a sustained, isometric sub-maximal contraction with the non-paretic leg and controls [6]. This study concluded that the paretic muscle had a slower neuromuscular contraction compared with the non-paretic leg and control leg. Given that both the rate of peak contraction and the time to peak contraction were significantly slower suggests either a slower rate of recruitment of motor units due to weaker descending commands or a greater proportion of Type I fibers within the paretic muscle. If there was a stroke-related change in the proportion of fiber types only, the paretic leg would have exhibited a longer time to task failure, as seen in aging populations [22]. In contrast, the time to task failure of the paretic leg was less for than the healthy controls and similar for the same relative intensity compared with the non-paretic leg.
The study findings supported the hypothesis that, stroke participants demonstrate a difference in peripheral neuromuscular fatigue, when compared to age and gender matched control participants. This is of importance while planning the exercise session of the patient as we know fatigue is a debilitating symptom which hampers the level of patient’s participation in any activity. So it is important to look into patient’s ADLs and therapy session taking this factor into consideration and also teaching the patient coping strategies [23,24]. Also, fatigue being such an important factor in a stroke patient’s life and the dearth of literature about it, warrants further research in this regard which will give a whole new dimension in the management of stroke patients [25-27].
References
- Romani A. The treatment of fatigue. Neurol Sci 29: 247-249 (2008).
- Petrella JK, Kim JS, Tuggle SC, et al. Age differences in knee extension power, contractile velocity, and fatigability. J Appl Physiol 98: 211-220 (2005).
- Radman N, Staub F, Aboulafia-Brakha T, et al. Poststroke fatigue following minor infarcts a prospective study. Neurology 79: 1422-1427 (2012).
- Glader EL, Stegmayr B, Asplund K. Poststroke fatigue: a 2-year follow-up study of stroke patients in Sweden. Stroke 33: 1327-1333 (2002).
- Dobkin BH. Fatigue versus activity-dependent fatigability in patients with central or peripheral motor impairments. Neurorehabil Neural Repair 22: 105-110 (2008).
- Gandevia SC. Spinal and supraspinal factors in human muscle fatigue. Physiol Rev 81: 1725-1789 (2001).
- Tseng BY, Kluding P. The relationship between fatigue, aerobic fitness, and motor control, in people with chronic stroke: A pilot study. J Geriatr Phys Ther 32: 97-102 (2009).
- Hyngstrom AS, Onushko T, Heitz RP, et al. Stroke-related changes in neuromuscular fatigue of the hip flexors and functional implications. Am J Phys Med Rehabil 91: 33-42 (2012).
- Fauth ML, Petushek EJ, Feldmann CR, et al. Reliability of surface electromyography during maximal voluntary isometric contractions, jump landings, and cutting. J Strength Cond Res 24: 1131-1137 (2010).
- Cuesta-Vargas AI, Cano-Herrera CL, Heywood S. Analysis of the neuromuscular activity during rising from a chair in water and on dry land. J Electromyogr Kinesiol 23: 1446-1450 (2013).
- Paillard T. Effects of general and local fatigue on postural control: a review. Neurosci Biobehav Rev 36: 162-176 (2012).
- Jason LA, Evans M, Brown M, et al. Fatigue scales and chronic fatigue syndrome: Issues of sensitivity and specificity. Disabil Stud Q 31 (2011).
- Amann M. Central and peripheral fatigue: interaction during cycling exercise in humans. Med Sci Sports Exerc 43: 2039-2045 (2011).
- Hatton AL, Menant JC, Lord SR, et al. The effect of lower limb muscle fatigue on obstacle negotiation during walking in older adults. Gait Posture 37: 506-510 (2013).
- Tseng BY, Gajewski BJ, Kluding PM. Reliability, responsiveness, and validity of the visual analog fatigue scale to measure exertion fatigue in people with chronic stroke: a preliminary study. Stroke Res Treat 2010 (2010).
- Johansson B, Starmark A, Berglund P, et al. A self-assessment questionnaire for mental fatigue and related symptoms after neurological disorders and injuries. Brain Inj 24: 2-12 (2010).
- Finsterer J. Biomarkers of peripheral muscle fatigue during exercise. BMC Musculoskelet Disord 13: 218 (2012).
- Dalla Toffola E, Sparpaglione D, Pistorio A, et al. Myoelectric manifestations of muscle changes in stroke patients. Arch Phys Med Rehabil 82: 661-665 2001.
- Hachisuka K, Umezu Y, Ogata H. Disuse muscle atrophy of lower limbs in hemiplegic patients. Arch Phys Med Rehabil 78:13-18 (1997).
- Gray V, Rice CL, Garland SJ. Factors that influence muscle weakness following stroke and their clinical implications: a critical review. Physiother Can 64: 415-426 (2012).
- Hara Y, Masakado Y, Chino N. The physiological functional loss of single thenar motor units in the stroke patients: when does it occur? Does it progress? Clin Neurophysiol 115: 97-103 (2004).
- Dattola R, Girlanda P, Vita G, et al. Muscle rearrangement in patients with hemiparesis after stroke: an electrophysiological and morphological study. Eur Neurol 33: 109-114 (1993).
- Bohannon RW. Knee extension strength and body weight determine sit-to-stand independence after stroke. Physiother Theory Pract 23: 291-297 (2007).
- Narici MV, Bordini M, Cerretelli P. Effect of aging on human adductor pollicis muscle function. J Appl Physiol 71: 1277-1281 (1991).
- Bernard Rosner. Fundamentals of Biostatistics, 5th Edition, Duxbury, page 80-240 (2000).
- Robert H Riffenburg. Statistics in Medicine, 2nd Edition, Academic press. 85-125 (2005.
- Sunder Rao P, Richard J, An Introduction to Biostatistics, A manual for students in health sciences, New Delhi: Prentice hall of India, 4th Edition, 86-160 (2006).
