Research Article - Imaging in Medicine (2011) Volume 3, Issue 5
Virtual noncontrast renal imaging using dual-energy CT: evaluation of CT numbers of renal parenchyma and renal masses
Satomi Kawamoto†1, Xiaodong R Zhou2, Christianne Leidecker2, George SK Fung1, Benjamin MW Tsui1 and Elliot K Fishman11 The Russell H. Morgan Department of Radiology & Radiological Science, Johns Hopkins Hospital, 601 North Caroline Street, Baltimore, MD 21287, USA
2Siemens Medical Solutions, Malvern, PA, USA
- *Corresponding Author:
- Satomi Kawamoto
The Russell H. Morgan
Department of Radiology & Radiological Science
Johns Hopkins Hospital, 601 North Caroline Street Baltimore
MD 21287, USA
Tel.: +1 410 955 9446
Fax: +1 410 614 0341
E-mail: skawamo1@jhmi.edu
Abstract
Aims: To evaluate the subjective image quality and accuracy of CT numbers of renal parenchyma and masses on virtual noncontrast (VNC)-CT created from contrast-enhanced dual-energy CT datasets using a first or second generation dual source scanner.
Material & Methods: A total of 62 patients referred for dedicated urinary tract CT were evaluated. 30 patients were scanned on a first generation scanner (80/140 kVp tube voltage set), and 32 patients on a second generation scanner (100/140 kVp with tin [Sn] filtration). After administration of intravenous contrast material, arterial phase CT was acquired in the dual-energy mode, and VNC-CT images were created using commercial software at the vendor’s default setting. Subjective image quality, and the CT numbers of renal parenchyma and renal masses (including cysts and solid masses) on VNC-CT were compared to standard noncontrast (SNC)-CT.
Results: Subjective image quality of VNC-CT was better at 100/140 kVp with Sn filtration than at 80/140 kVp. The CT numbers of renal parenchyma were lower on VNC-CT than on SNC-CT, both at 80/140 kVp (20.4 ± 9.8 Hounsfield units [HU] vs 29.2 ± 3.4 HU, p < 0.0001) and 100/140 kVp with Sn filtration (25.7 ± 5.5 HU vs 28.7 ± 3.2 HU, p < 0.0001). The CT numbers of renal masses were lower on VNC-CT than on SNC-CT at 80/140 kVp (-0.2 ± 15.4 HU vs 10.9 ± 13.2 HU, p < 0.0001), but not significantly different at 100/140 kVp with Sn filtration (10.6 ± 14.8 HU vs 11.2 ± 12.5 HU, p = 0.5080).
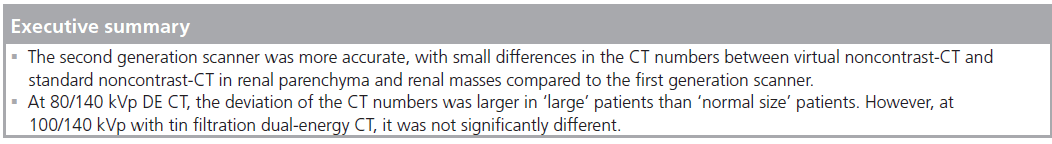
Conclusion: VNC-CT is useful for evaluation of renal masses. The second generation scanner was more accurate, with small differences in the CT numbers between VNC-CT and SNC-CT in renal parenchyma and renal masses.
Keywords
CT numbers; dual-energy CT; renal mass; renal parenchyma; virtual; oncontrast CT
Dual-energy (DE) CT implies aquiring of datasets simultaneously at two different photon spectra in a single CT acquisition [1]. Three primary different hardware approaches to DE CT scanning have been developed [2]. These include a dualsource scanner using two tubes and detectors [3], dual-layer detectors [4], and rapid switching of tube kilovoltage in a single x-ray tube [5].
The recently introduced dual-source CT system is composed of two x-ray tubes and two detector arrays acquiring data simultaneously. In addition to improved temporal resolution when using the two tubes at identical kVp levels, dualsource CT scanners have the ability to simultaneously operate two x-ray sources at different energy levels, and can acquire two spiral datasets in a single scan, without motion artifact or misregistration. By obtaining CT datasets at different photon energies, DE CT has the ability to differentiate material composition based on differences in photon absorption. Using the DE datasets obtained with iodinated contrast material, an unenhanced CT image, or ‘virtual noncontrast’ (VNC)-CT image of the abdomen can be generated using DE post-processing algorithms based on three-material decomposition principles [1].
The second generation dual-source CT scanner utilizes a filter for a high kVp x-ray tube, that reduces unnecessary dose by removing low energy photons from the spectrum of the high energy x-ray tube and increases energy separation, and it allows the use of 100 and 140 kVp DE imaging for VNC application. The reconstruction field of view (FOV) of the second generation dual-source CT scanner is 25% larger than that of the first generation scanner.
Noncontrast CT is routinely performed as part of the dedicated CT exam for suspected urinary tract abnormality. The purpose of noncontrast CT is to determine baseline CT numbers (Hounsfield unit [HU]) of renal masses to compare to contrast-enhanced CT to assess the degree of contrast enhancement and to evaluate urinary stones. Noncontrast CT is also used to identify intralesional fat and calcification. If VNC-CT can replace and obviate the routine need for standard noncontrast (SNC) CT, radiation exposure to patients can be reduced. According to the prior phantom study [6] and clinical study [7], for a triple-phase renal mass protocol, the effective doses were 7.49–34 mSv. The dose reduction achieved by omitting the noncontrast acquisition was 24–35%. The aim of this study is to evaluate subjective image quality, and accuracy of VNC-CT by comparing the CT numbers of renal parenchyma in different locations within the kidneys, and renal masses to SNC-CT using first or second generation dual-source scanner.
Material & methods
The study was approved by our institutional review board. The study protocol was explained to the patients, and was performed if patient consent to participate was granted. Written informed consent was not required by our institutional review board.
A total of 62 patients referred for dedicated urinary tract CT examination were included in this study. Patients with serum creatinine levels up to 1.6 mg/dl were included. The first 30 patients consisted of 18 men and 12 women, with an age range from 28 to 97 years (average: 65.6 years). They were scanned on a first generation dual-source CT scanner (Definition, Siemens Medical Solutions, Malvern, PA, USA) operated in the DE mode with tube voltage set at 80 kVp and 140 kVp (80/140 kVp). One patient had prior unilateral nephrectomy, and a total of 59 kidneys were evaluated. An additional 32 patients consisted of 20 men and 12 women, with an age range from 42 to 91 years (average: 64.4 years). They were scanned on a second generation dual-source CT scanner (Definition Flash, Siemens Medical Solutions) at 100 kVp and 140 kVp with a tin (Sn) filtration for 140 kVp tube (100/140 kVp with Sn filtration). Five patients had prior unilateral nephrectomy. In addition, one patient had a unilateral atrophic kidney, and one patient had bilateral atrophic kidneys (with renal transplant). In this group, 59 native kidneys were evaluated for masses, and 56 native kidneys were evaluated for renal parenchymal CT numbers.
Patients’ body weight was recorded. Morbidly obese patients (~10–15% of people who were the largest size in our outpatient clinical population referred to dedicated urinary tract CT examination) were empirically excluded, although the BMI was not determined before the examination. When the DE data were loaded on Liver Virtual Noncontrast (Siemens Medical Solutions) application, it indicated that “patient diameter is large” for some patients based on the size (diameter) of each patient. If the patient was indicated as ‘large’, they were classified as large patients. If a patient was not indicated as ‘large’, they were classified as ‘normal size’ in this study.
The SNC-CT scan was acquired at 120 kVp and 64 × 0.6 mm collimation (with the first generation scanner) or 128 × 0.6 mm (with the second generation scanner).
After the SNC-CT scan, the patient was administered with 100–120 ml of nonionic contrast material (Iohexol [Omnipaque 350, GE Healthcare, Princeton, NJ, USA; n = 24], or Iodixanol [Visipaque™ 320, GE Healthcare, Princeton, NJ, USA; n = 38]) intravenously through a peripheral venous line at 3–4 ml/s. Patients with prior unilateral nephrectomy received a reduced amount of contrast material (80–100 ml).
An arterial phase (early corticomedullary phase) CT was acquired in DE mode with a delay of 25–30 s after the start of an intravenous contrast material injection. Corticomedullary phase was analyzed in this study because we assessed CT numbers of normal renal parenchyma in addition to renal masses, and the highest contrast enhancement of the renal cortex is achieved at this phase [8,9]. For the initial 30 patients scanned with the first generation scanner at 80/140 kVp, detector collimation of 64 × 0.6 mm was used. The quality reference mAs for an online dose modulation system (CARE Dose 4D; Siemens Medical Solutions, PA, USA) were 425 mAs and 100 mAs for tube A (80 kVp) and tube B (140 kVp) respectively.
For the 32 patients scanned on the second generation scanner at 100/140 kVp with Sn filtration, the initial nine patients were scanned with detector collimation of 64 × 0.6 mm. The other 23 patients were scanned with 32 × 0.6 mm collimation. The quality reference mAs for CARE Dose 4D were 250 mAs and 193 mAs for tube A (100 kVp) and tube B (140 kVp with Sn filtration) respectively.
Venous phase and excretory phase CT were then acquired at 120 kVp at 1 min and 5–7 min from the start of the intravenous contrast material injection, and used for clinical purpose and classification of renal masses.
The image data were reconstructed with the body soft tissue convolution kernel (D30f) with a 512 × 512 matrix for the both scanners. The DE data of arterial phase acquired with the first generation scanner, two sets of reconstruction thickness were made and used for assessment; 0.75 and 3.0 mm, and compared to SNC-CT of the same reconstruction thickness. The DE data of arterial phase acquired with the second generation scanner, one set of reconstruction was used for assessment (reconstruction thickness was 0.75 mm in the initial 11 patients, and 1.5 mm in 21 patients). The reconstruction FOV for the DE data was 25 × 25 cm for the first generation scanner, and 33 × 33 cm for the second generation scanner.
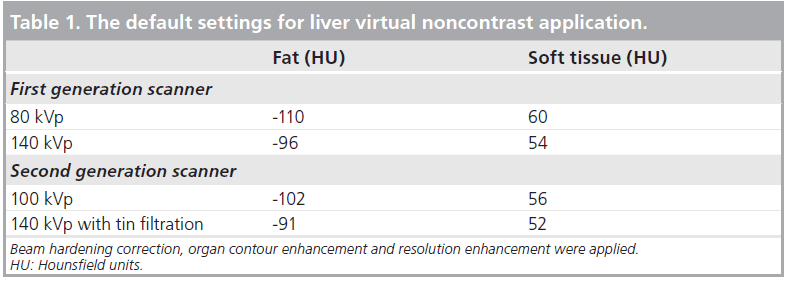
The reconstructed DE images were loaded to a Multi-Modality Workplace (Siemens Medical Solutions) and analyzed using the Liver Virtual Noncontrast application. The VNC-CT image and colored iodine overlay image, over the VNC image showing iodine content in each voxel, were obtained. The manufacturer’s default settings were used in all the data analysis (Table 1). The created VNC-CT images in DICOM format were sent through a PACS system to an Emageon Workstation (Advanced Visualization, Version 5.30.7.26: Emageon Inc, Birmingham, AL, USA) for further data analysis and image display. The fused images in the arterial phase from both tubes were used for clinical purpose and classification of renal masses.
The overall VNC-CT image quality was subjectively scored into three grades based on the evaluation of image homogeneity and artifacts in large areas of the soft tissue by one radiologist with 12 years of experience of abdominal CT imaging: grade 1, good without notable heterogeneity; grade 2, minimal heterogeneity; grade 3 with moderate heterogeneity or artifacts including ring-like artifacts, beam hardening artifacts, and subtraction artifacts. The maximum anterior– posterior and transverse diameters measured on axial CT images were recorded at the level of the kidneys (at the level of the left renal vein) to determine the patient’s size.
The VNC- and SNC-CT datasets were compared by measuring the CT numbers of the renal parenchyma by placing a region-ofinterest (ROI; 1.5 cm2 ) over the same area in both SNC- and VNC-CT by one experienced radiologist, who performed the subjective assessment of image quality. Four ROIs were placed in the renal parenchyma (anterior, medial, posterior and lateral portions) in each kidney (Figure 1) at two reconstructed slices separated by greater than 1 cm in the craniocaudal direction, giving measurements at eight locations of each kidney. Each ROI was measured once at each dataset. For data obtained with the first generation scanner at 80/120 kVp, the same ROI was measured on both 0.75 and 3 mm reconstruction datasets.

Figure 1. Measurement of the CT numbers of renal parenchyma on virtual noncontrast CT image acquired with the first generation scanner at 80/140 kVp dual-energy CT with a 64 × 0.6 mm detector collimation. Four regions of interest (each 1.5 cm2) were placed in the renal parenchyma (anterior, medial, posterior and lateral portions) as shown in this figure over the same area in both virtual noncontrast CT and standard noncontrast CT. Each kidney was measured at two reconstructed slices separated by greater than 1 cm in the craniocaudal direction, giving measurements at eight locations of each kidney.
Renal lesions that measured greater than 1 cm in the largest diameter on axial postcontrast CT images were evaluated. When the CT numbers of a renal lesion increased less than 10 HU from SNC-CT to postcontrast CT (including weighted arterial phase, venous and excretory phase CT), it was classified as a cyst. A lesion exhibited an increase of at least 20 HU was classified as a solid, enhancing mass [10–12]. When a lesion exhibited an increase of the CT number greater than 10 HU and less then 20 HU, it was classified as an indeterminate [11,12]. Cystic renal lesions were classified according to the Bosniak criteria into simple cysts (class I), minimally complicated cysts (class II/IIF), moderately complicated cysts (class III), and clearly malignant cystic masses (class IV) using the SNC and postcontrast CT images [11,13]. The CT numbers of renal masses were measured using a ROI placed over the same area within the mass on axial images of the SNC-CT and VNC-CT. The ROI was placed in approximately two thirds of each lesion. When the lesion contained calcification or fat, these areas were excluded. The estimated contrast enhancement of each renal mass was measured three-times using a ROI in the same area in the renal mass on the iodine overlay image.
Statistical analysis was performed using the Statview 5.0 (SAS Institute) software. The CT numbers from the SNC- and VNC-CT images were compared using the Student’s t-test. A contingency table was used to indicate overall subjective image quality and a comparative result with p < 0.05 was considered significant.
Results
Overall subjective image quality
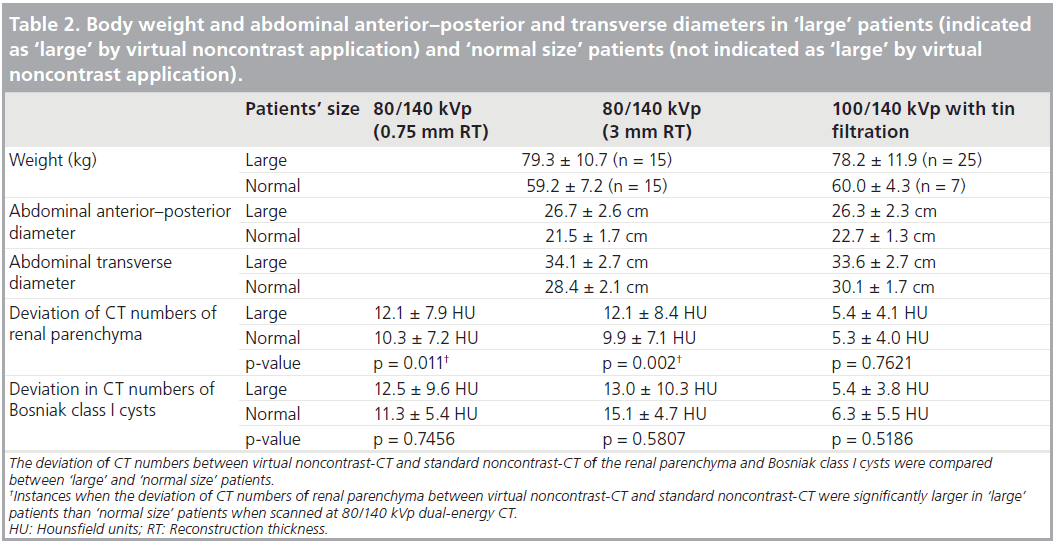
Overall image quality of VNC-CT from the initial 30 patients scanned at 80/140 kVp DE CT was scored as grade 1 (Figure 2A) in 17 cases, grade 2 (Figure 2B) in seven cases and grade 3 (Figure 2C) in six cases at 0.75 mm reconstruction thickness. Specifically, in cases of grade 3, concentric, ringlike heterogeneity was seen. In 32 patients scanned at 100/140 kVp with Sn filtration DE CT, overall image quality of VNC-CT was scored as grade 1 in 22 cases, grade 2 in ten cases, and grade 3 in no cases. Overall subjective image quality of VNC-CT was better at 100/140 kVp with Sn filtration than 80/140 kVp (p = 0.0285). 15 of 30 patients scanned at 80/140 kVp DE CT, and 25 of 32 patients scanned at 100/140 kVp with Sn filtration DE CT were indicated as ‘large’ by VNC application. Body weight and abdominal anterior–posterior and transverse diameters in ‘large’ and ‘normal size’ patients were shown in Table 2.

Figure 2. Image quality of virtual noncontrast CT images acquired with the first generation scanner at 80/140 kVp dual-energy CT with a 64 × 0.6 mm detector collimation. (A) Example of grade 1 (good quality without notable heterogeneity). (B) Example of grade 2 (minimal heterogeneity over the kidneys and the head of the pancreas). (C) Example of grade 3 (moderate heterogeneity with ring-like artifacts).
CT numbers of renal parenchyma
The average CT numbers of renal parenchyma was lower on VNC-CT than SNC-CT at both scanners (Figure 3). When the average CT numbers of renal parenchyma was compared among four locations on VNC-CT, the anterior and medial portions of the kidney were lower than the posterior and lateral portions (Figure 2).

Figure 3. CT numbers of renal parenchyma. (A) Average CT numbers of renal parenchyma on SNC-CT and VNC-CT acquired with first generation CT scanner (80/140 kVp at 3 mm reconstruction thickness), and second generation scanner (100/140 kVp with a tin filtration) in total (including all locations) and at each location. (B) Relationship between CT numbers of SNC-CT and VNC-CT of each region of interest within renal parenchyma with the first generation scanner (80/140 kVp at 3 mm reconstruction thickness), and (C) second generation scanner (100/140 kVp with a tin filtration). There is no linear relationship between VNC-CT and SNC-CT. CT numbers of renal parenchyma on SNC-CT distribute across a wider range on VNC-CT than SNC-CT, particularly with the first generation scanner. *p < 0.0001; **p = 0.0003. 1st gen.: First generation scanner, 2nd gen.: Second generation scanner; A: Anterior; HU: Hounsfield units; L: Lateral; M: Medial; P: Posterior; SNC-CT: Standard noncontrast CT; T: Total; VNC-CT: Virtual noncontrast CT
The deviation of the CT numbers (absolute values) between VNC-CT and SNC-CT at the same locations was compared between ‘large’ and ‘normal size’ patients. At 80/140 kVp DE CT, the deviation of the CT numbers was larger in ‘large’ patients than ‘normal size’ patients (Table 2). However, at 100/140 kVp with Sn filtration DE CT, it was not significantly different (Table 2).
Renal masses
In the initial 30 patients scanned at 80/140 kVp, there were 48 renal lesions greater than 1 cm. Five lesions were out of FOV on VNC-CT, and 43 renal lesions were evaluated. They included 26 Bosniak class I cysts (three cysts were partially out of FOV), five Bosniak class II or IIF (II/IIF) cysts (peripheral calcifications [n = 3], thin septation [n = 1], minimally thick septation [n = 1]), three indeterminate lesions, two enhancing renal masses, three urothelial masses, and four postablation zones.
In an additional 32 patients scanned at 100/140 kVp with Sn filtration, there were 49 renal lesions greater than 1 cm. All lesions were included within FOV on VNC-CT. They included 30 Bosniak class I cysts, six Bosniak class II/IIF cysts (hyperdense cysts [n = 3], thin septations with calcifications [n = 1], thick wall or septation without or with calcification [n = 2]), two indeterminate lesions, five enhancing renal masses, and six postablation zones.
At 80/140 kVp, the average CT numbers of all 43 renal lesions, Bosniak class I cysts (Figure 4), class II/IIF cysts, and renal/urothelial masses (Figure 5) were lower on VNC-CT than SNC-CT (Table 3). At 100/140 with Sn filtration, the CT numbers of Bosniak class I cysts (Figure 6) was slightly lower on VNC-CT than SNC-CT (p = 0.0401). At 100/140 with Sn filtration, the CT numbers of all 49 renal lesions, Bosniak class II/IIF cysts, renal masses (Figure 7) and postablation zones were not significantly different between VNC-CT and SNC-CT (Table 3).
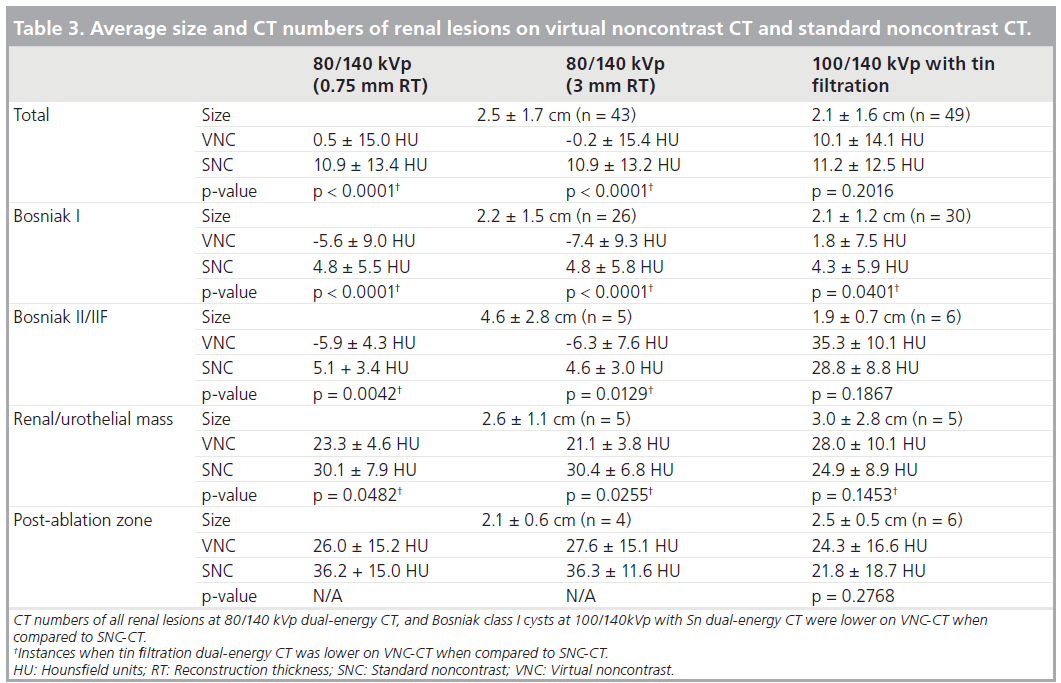

Figure 4. Bosniak class I cyst. (A) Standard noncontrast-CT acquired at 120 kVp. Left renal cyst (arrow) measures 6.6 ± 7.3 HU. (B) Virtual noncontrast-CT acquired with the first generation scanner at 80/140 kVp dual-energy CT. The cyst (arrow) measures -13.0 ± 6.7 HU. (C) Arterial phase contrast enhanced CT (weighted average image at 80/140 kVp dual-energy CT). The cyst (arrow) measures 12 ± 10.0 HU. (D) Estimated contrast enhancement on iodine overlay image measures 21.3 HU. HU: Hounsfield units.
A total of 16 of 26 Bosniak class I cysts at 80/140 kVp, and ten of 30 Bosniak class I cysts at 100/140 kVp with Sn f iltration showed greater than 10 HU estimated contrast enhancement (average: 18.5 ± 7.1 HU at 80/140 kVp, 14.9± 4.0 HU at 100/140 kVp with Sn filtration) (Figure 4). For Bosniak class I cysts, there was no correlation between the patients’ size and deviation of the CT numbers (absolute values) between VNC-CT and SNC-CT, as well as presence of greater than 10 HU estimated contrast enhancement on the iodine overlay images.
A total of four Bosniak class II/IIF cysts at 80/140 kVp and no Bosniak class II/IIF cysts at 100/140 kVp with Sn filtration showed greater than 10 HU estimated contrast enhancement (average: 17.5 ± 5.2 HU at 80/140 kVp). All renal/urothelial masses showed greater than 10 HU estimated contrast enhancement (average: 54.6 ± 14.6 HU at 80/140 kVp, 74.4 ± 29.9 HU at 100/140 kVp with Sn filtration) (Figures 5 & 7). Two postablation zones at 80/140 kVp (average: 16.9 ± 5.4 HU), and two postablation zones at 100/140 kVp with Sn filtration (average: 17.2 ± 2.1 HU) showed greater than 10 HU estimated contrast enhancement.

Figure 5. Minimally enhancing renal mass. (A) Standard noncontrast-CT acquired at 120 kVp. Left renal mass (arrow) measures 32.5 ± 8.5 HU. (B) Virtual noncontrast-CT images acquired with the first generation scanner at 80/140 kVp dual-energy CT. The mass (arrow) measures 21.3 ± 7.7 HU. (C) Arterial phase contrast-enhanced CT (weighted average image at 80/140 kVp dual-energy CT). The mass (arrow) measures 52.7 ± 13.4 HU. (D) Estimated contrast enhancement on iodine overlay image measures 26.8 HU. HU: Hounsfield units.

Figure 6. Bosniak class I cyst. (A) Standard noncontrast-CT acquired at 120 kVp. Right renal cyst (arrow) measures 3.3 ± 15.6 HU. (B) Virtual noncontrast-CT acquired with the second generation scanner at 100/140 kVp with a tin filtration dual-energy CT. The cyst (arrow) measures 3.8 ± 13.8 HU. (C) Estimated contrast enhancement on iodine overlay image measures less than 10 HU contrast enhancement. HU: Hounsfield units.
Discussion
The basic method to determine iodine concentration in tissue, and therefore to calculate a virtual noncontrast image, is known as “three material decomposition” [1]. Iodine is known to have stronger enhancement at low tube voltage settings [14]. This effect is used to differentiate iodine from other materials that do not show this behavior [1]. In the abdomen, the threematerials that are usually analyzed are soft tissue, fat, and iodine [1].

Figure 7. Enhancing renal mass (clear cell renal cell carcinoma) in left kidney. (A) Standard noncontrast-CT acquired at 120 kVp. Left renal mass (arrows) is difficult to detect on noncontrast-CT, but measures 18.1 ± 16.1 HU. (B) Virtual noncontrast CT acquired with the second generation scanner at 100/140 kVp with a tin filtration dual-energy CT. The mass (arrows) measures 13.7 ± 19.7 HU. (C) Arterial phase contrast-enhanced CT (weighted average image at 100 kVp and 140 kVp with a tin filtration dual-energy CT) shows a small hypervascular mass in the left kidney (arrows). (D) Iodine overlay image generated at 100/140 kVp with a tin filtration dual-energy CT. Estimated contrast enhancement of the mass measures 169.6 HU. HU: Hounsfield units.
In our study, we evaluated the CT numbers of renal parenchyma and renal masses on VNC-CT compared to SNC-CT. When the manufacturer’s default settings were used, the CT numbers of the renal parenchyma and renal masses tended to be lower on VNC-CT than SNC-CT, which was more pronounced at 80/140 kVp DE CT. These differences may be in part related to relatively large patient’s size in our study population and thin collimation used for 80/140 kVp DE CT acquisition. The difference of the CT numbers of the renal parenchyma between VNC-CT and SNC-CT was larger in ‘large’ patients than ‘normal size’ patients at 80/140 kVp DE CT, suggesting that image noise may cause inaccurate estimation of iodine concentration and thus the CT numbers of VNC-CT. DE CT data may not be accurate in obese patients due to increased image noise, and DE CT is not recommended for patients whose BMI is greater than 30 [15]. Recently, Guimaraes et al. [16] reported that the use of the 14 × 1.2 mm detector configuration at abdominal DE CT resulted in significantly better image quality than that obtained with the 64 × 0.6 mm configuration. They also reported that appropriate cutoff of patient’s longest linear dimension (35.6 cm for the kidneys, and 35.8 cm for the liver) on axial CT images for the 14 × 1.2 mm detector configuration yielded acceptable image quality [16].
In addition, the average CT numbers of the renal parenchyma were different depending on the location within the organ in our study. The average CT numbers of the anterior and medial portions of the renal parenchyma were lower than the posterior and lateral portions on VNC-CT at both scanners. The differences of the CT numbers may be related to different noise levels at different locations within FOV, but there may be other factors that caused these differences. Using a 64 × 0.6 mm detector collimation for the first generation scanner does not allow use of on-line cross-scatter correction which may have affected image quality and CT numbers [16]. Further investigation is necessary to determine the cause of this observation.
In obese patients, large amount of attenuation and scattering of the low energy photons result in a decrease of signal and relative increase in electronic noise from the low kVp detector. When 100 kVp was utilized, instead of 80 kVp, for the acquisition of low energy data, this limitation can be reduced [17]. However, the x-ray spectra of 100 and 140 kVp show a larger overlap than the spectra of 80 and 140 kVp, and DE contrast and thus material decomposition are expectedly reduced [17]. Additional spectral filtration for high kVp x-ray tube removes low energy photons from the spectrum of the high energy x-ray tube, increase the separation between data from the two x-ray tubes, and decreases noise in the low energy images and increases contrast in the DE images [18].
Improved sensitivity and specificity for discriminating renal cysts from enhancing masses in a kidney phantom model has been reported with DE CT with an Sn filter [19].
Recently, Karlo et al. reported that DE CT at 80/140 kVp allowed discrimination between a phantom renal lesion containing contrast agent and lesions containing protein and blood [20]. They also reported that further discrimination between protein and blood containing renal proxies was possible when using a thin filter [20].
In a prior study by Brown et al. using phantom renal lesions to characterize renal mass as cyst or solid by DE CT, 35 of 36 enhancing masses and ten of 12 cysts were correctly identified, with a sensitivity and specificity of 97% and 83% [21]. In our study, 62% of Bosniak class I cysts at 80/140 kVp, and 32% at 100/140 kVp with Sn filtration DE CT showed greater than 10 HU estimated contrast enhancement on iodine overlay images. Our results suggest that there was variability of measured HU values of renal masses on VNC-CT using the manufacturer’s default postprocessing settings, particularly with the first generation scanner with 64 × 0.6 mm collimation, and the use of DE CT may potentially cause difficulty in differentiating renal cysts from minimally enhancing solid masses. Coursey et al. also described in their recent review article that in their experience, VNC-CT images created with available postprocessing technique are not always equivalent to SNC-CT images, and they experienced a difference of 3–32 HU between the CT numbers of the renal masses on VNC-CT and SNC-CT images [22]. Graser et al. reported that there was little difference between VNC-CT and SNC-CT in CT numbers of renal parenchyma and renal cysts [7]. Exclusion of morbidly obese patients (BMI >40 kg/m2) and the use of the 14 × 1.2 mm detector configuration in this study may be the cause of the difference from our results. More recently a study by Graser et al. also reported accurate characterization of renal masses as benign or malignant in 202 patients based on DE CT only, with an overall accuracy of 94.6% using the first generation scanner (n = 174) and the second generation scanner (n = 28) [23]. Recently, Neville et al. studied 66 hypoattenuating renal cysts, 28 hyperattenuating renal cysts, 18 angiomyolipomas, and 27 solid enhancing renal lesions with DE CT at 80/140 kVp in a nonbody habitusrestricted patient population [24]. CT numbers and enhancement level between acquired and calculated nonenhanced images using individualized spectoral-based iodine extraction were not statistically different in any lesions groups [24].
We noted several advantages of the second generation dual-source CT scanner for VNC-CT imaging over the first generation scanner. Firstly, with a larger DE FOV, more renal lesions can be included. Secondly, artifacts were less commonly seen with the second generation scanner. In particular, ring-like artifacts were more commonly seen with the first generation scanner due to the image acquisition at 80 kV. Thirdly, deviation of the CT numbers of renal parenchyma and renal lesions on VNC-CT from SNC-CT was smaller with the second generation scanner.
To minimize patient exposure to ionizing radiation, abdominal DE CT protocols operate using an online dose modulation system (CARE Dose 4D) that adapts the tube currents to the patient’s anatomy [1]. Radiation dose to the patient theoretically could be increased using a DE acquisition. However, when the reference mAs values are set to 400 mAs on the B tube and 96 mAs on the A tube, the calculated effective patient dose for abdominal scans ranges from 4.5 to 12.5 mSv, which is similar to the effective dose of a standard abdominal CT acquisition using 120 kVp with 250 mAs [15]. In our study, average CTDIvol of DE contrast enhanced CT scans for the arterial phase was 13.3 mGy at 80/140 kVp, and 15.2 mGy at 100/140 kVp with Sn filtration.
There are several limitations in our study. Firstly, we empirically excluded obese patients, but we did not determine BMI before the exam. Significant numbers of the patients were indicated as ‘large’ by Liver VNC application. Secondly, 64 × 0.6 mm collimation was used with 80/140 kVp on the first generation scanner. It is recommended to use 14 × 1.2 mm collimation on both detectors for abdominal imaging because 64 × 0.6 mm collimation causes increased image noise on the B detector images [25]. These factors may have contributed to the difference of the CT numbers between VNC-CT and SNC-CT particularly at 80/140 kVp DE CT in our study. Thirdly, we only evaluated DE CT data acquired at arterial phase, and were unable to assess DE CT data acquired at other phases. Finally, we do not have histological diagnosis of renal lesions. Classification of some of the renal lesions was based on CT imaging findings, not histological diagnosis.
Conclusion
In conclusion, VNC-CT acquired with DE CT is useful in the characterization of renal masses. Careful attention to patient’s selection and the acquisition protocol are necessary. The second generation scanner was more accurate, with small differences in the CT numbers between VNC-CT and SNC-CT in renal parenchyma and renal masses. For many renal lesions, particularly those evaluated with the second generation scanner, VNC-CT was accurate, and it is promising that SNC-CT will likely be eliminated in the future. However, it requires larger multicenter studies to confirm this observation.
Future perspective
With appropriate clinical setting and careful patient selection and acquisition protocol, it is likely that VNC-CT will replace SNC-CT and reduce radiation dose to patients.
Financial & competing interests disclosure
S Kawamoto received grant support from Siemens, and XR Zhou and XR Leidecker are Siemens employees. The authors have no other relevant affiliations or financial involvement with any organization or entity with a financial interest in or financial conflict with the subject matter or materials discussed in the manuscript apart from those disclosed.
No writing assistance was utilized in the production of this manuscript.
Ethical conduct of research
The authors state that they have obtained appropriate institutional review board approval or have followed the principles outlined in the Declaration of Helsinki for all human or animal experimental investigations. In addition, for investigations involving human subjects, informed consent has been obtained from the participants involved.
Papers of special note have been highlighted as:
* of interest
* of considerable interest
References
- Johnson TR, Krauss B, Sedlmair M et al. Material differentiation by dual energy CT: initial experience. Eur. Radiol. 17(6), 1510–1517(2007). & Original work on material differentiation by dual-energy (DE) CT.
- Fletcher JG, Takahashi N, Hartman R et al. Dual-energy and dual-source CT: is there a role in the abdomen and pelvis? Radiol. Clin. North Am. 47(1), 41–57(2009). & Excellent review of current status of abdominopelivc DE CT.
- Flohr TG, McCollough CH, Bruder H et al. First performance evaluation of a dual-source CT (DSCT) system. Eur. Radiol. 16(2), 256–268(2006).
- Carmi R, Naveh G, Altman A. Material separation with dual-layer CT. In: Proceedings of IEEE Nuclear Science Symposium 2005. San Juan, Puerto Rico: Enstitute of Electrical and Electronic Engineers 2005, 441–450 (2005).
- Kuribayashi S. Dual energy CT of peripheral arterial disease with single-source 64-slice MDCT. In: The 9th Annual International Symposium on MDCT. San Francisco, CA, USA, June 13–16 (2007).
- Ho LM, Yoshizumi TT, Hurwitz LM et al. Dual energy versus single energy MDCT: measurement of radiation dose using adult abdominal imaging protocols. Acad. Radiol. 16(11), 1400–1407 (2009).
- Graser A, Johnson TR, Hecht EM et al. Dual-energy CT in patients suspected of having renal masses: can virtual nonenhanced images replace true nonenhanced images? Radiology 252(2), 433–440 (2009). & Important work comparing datasets of virtual and standard noncontrast-CT.
- Szolar DH, Kammerhuber F, Altziebler S et al. Multiphasic helical CT of the kidney: increased conspicuity for detection and characterization of small (< 3-cm) renal masses. Radiology 202(1), 211–217 (1997).
- Cohan RH, Sherman LS, Korobkin M, Bass JC, Francis IR. Renal masses: assessment of corticomedullary-phase and nephrographicphase CT scans. Radiology 196(2), 445–451 (1995).
- Siegel CL, Fisher AJ, Bennett HF. Interobserver variability in determining enhancement of renal masses on helical CT. Am. J. Roentgenol. 172(5), 1207–1212 (1999).
- Israel GM, Bosniak MA. How I do it: evaluating renal masses. Radiology 236(2), 441–450 (2005).
- Silverman SG, Israel GM, Herts BR, Richie JP. Management of the incidental renal mass. Radiology 249(1), 16–31 (2008).
- Israel GM, Bosniak MA. An update of the Bosniak renal cyst classification system. Urology 66(3), 484–488 (2005).
- Nakayama Y, Awai K, Funama Y et al. Abdominal CT with low tube voltage: preliminary observations about radiation dose, contrast enhancement, image quality, and noise. Radiology 237(3), 945–951 (2005).
- Graser A, Johnson TR, Chandarana H, Macari M. Dual energy CT: preliminary observations and potential clinical applications in the abdomen. Eur. Radiol. 19(1), 13–23 (2009).
- Guimaraes LS, Fletcher JG, Harmsen WS et al. Appropriate patient selection at abdominal dual-energy CT using 80 kV: relationship between patient size, image noise, and image quality. Radiology 257(3), 732–742 (2010). & Important work to determine patient selection for DE CT using 80 kV.
- Thomas C, Krauss B, Ketelsen D et al. Differentiation of urinary calculi with dual energy CT: effect of spectral shaping by high energy tin filtration. Invest. Radiol. 45(7), 393–398 (2010).
- Primak AN, Ramirez Giraldo JC, Liu X, Yu L, McCollough CH. Improved dualenergy material discrimination for dual-source CT by means of additional spectral filtration. Med. Phys. 36(4), 1359–1369 (2009).
- Leschka S, Stolzmann P, Baumuller S et al. Performance of dual-energy CT with tin filter technology for the discrimination of renal cysts and enhancing masses. Acad. Radiol. 17(4), 526–534 (2010).
- Karlo C, Lauber A, Götti RP et al. Dualenergy CT with tin filter technology for the discrimination of renal lesion proxies containing blood, protein, and contrast-agent. An experimental phantom study. Eur. Radiol. 21(2), 385–392 (2011).
- Brown CL, Hartman RP, Dzyubak OP et al. Dual-energy CT iodine overlay technique for characterization of renal masses as cyst or solid: a phantom feasibility study. Eur. Radiol. 19(5), 1289–1295 (2009).
- Coursey CA, Nelson RC, Boll DT et al. Dual-energy multidetector CT: how does it work, what can it tell us, and when can we use it in abdominopelvic imaging? Radiographics 30(4), 1037–1055 (2010). & Excellent review of current status of abdominopelivc DE CT.
- Graser A, Becker CR, Staehler M et al. Single-phase dual-energy CT allows for characterization of renal masses as benign or malignant. Invest. Radiol. 45(7), 399–405 (2010). & Important work to characterize renal masses on single-phase DE CT.
- Neville AM, Gupta RT, Miller CM, Merkle EM, Paulson EK, Boll DT. Detection of renal lesion enhancement with dual-energy multidetector CT. Radiology 259(1), 173–183 (2011).
- Graser A, Johnson TR, Bader M et al. Dual energy CT characterization of urinary calculi: initial in vitro and clinical experience. Invest. Radiol. 43(2), 112–119 (2008).


