Research Article - International Journal of Clinical Rheumatology (2021) Volume 16, Issue 6
The role of trabecular bone score, in addition to FRAX, for the measurement of fracture risk in patients with degenerative lumbar spine stenosis
- *Corresponding Author:
- Husham A. Aldaoseri
Department of Internal Medicine, Division of Rheumatology, Faculty of Medicine, Basrah University, Basrah, Iraq
E-mail: aldosrrf@yahoo.com
Abstract
Objectives: To investigate the relevance of Concomitant Trabecular Bone Score (TBS) and Areal Bone Mineral Density (aBMD) assessments to estimate fracture risk in patients with Degenerative Lumbar Spine Stenosis (DLSS).
Methods: A cross-sectional prospective study was performed. Dual energy X-ray absorptiometry scans of the lumbar spine and hip were acquired in 50 patients with DLSS. TBS and aBMD were calculated from the anteroposterior views of L1-L4 vertebrae. The World Health Organisation Fracture Risk Assessment Tool (FRAX) was utilised to estimate hip or Major Osteoporotic Fracture (MOF) risk.
Results: L1-L4 TBS scores revealed degraded microarchitecture, (TBS ≤ 1.20), partially degraded microarchitecture (TBS >1.20 and <1.35) or normal appearances (TBS ≥ 1.35) in 9 (18%), 14 (28%) and 27 (54%) patients, respectively. L1-L4 aBMD assessment demonstrated osteoporosis (T-score ≤- 2.5), osteopenia (T-score between -1.1 and -2.4) or normal bone density in 15 (30%), 11 (22%) and 24 (48%) patients, respectively.
There was no relationship seen between L1-L4 aBMD and TBS measurements (r = 0.046; p = 0.75). A negative relationship was observed between TBS and body mass index (r = -0.438; p = 0.001) andbetween L1-L4 aBMD and FRAX (r = -0.617; p < 0.001); the latter included MOF and risk of hip fracture (r = -0.497; p < 0.001).No relationship was observed between TBS and FRAX included MOF and risk of hip fracture (r = -0.118; p = 0.416 and r = -0.014; p = 0.926, respectively)
Conclusion: In patients with DLSS, TBS is a reliable, strong and standalone indicator of fracture risk
Keywords
degenerative lumbar spinal stenosis • DXA • TBS • FRAX
Introduction
Lumbar Spinal Stenosis (LSS) is defined as a cavity restriction within the osteoligamentous vertebral canal and/or intervertebral foramina. The thecal sac and/or the cauda equina can become compressed as a result of the narrowing. At the site of one vertebra, the stenosis may completely or partially obliterate the vertebral canal [1,2]. Degenerative spinal arthritis is the most common underlying aetiology. This typically occurs in association with the facet joints and the ligamentum flavum; characteristic features of arthritis can be seen within the facet joints when examining X-radiographs [3,4]. It has been estimated that the prevalence of degenerative LSS (DLSS) lies between 1.7% and 13.1% [5-7].
Components of spinal articulation include the vertebral disc, the superior and inferior vertebral bodies and the facet joints; arthritis can commence in any of these joints. However, ultimately, degenerative changes arise on all three joint surfaces. Within the facet joints, which have a diarthrodial format, degeneration initially presents with synovitis [8]. As this condition worsens, it leads to cartilaginous emaciation and a lax facet joint capsule. The range of spinal movement is enhanced, which then encourages deterioration of the intervertebral disc and development of large osteophytes in response to the instability. Osteophytes can act as scaffolding and thus help to limit excessive spinal motion. However, if they develop within the spinal canal they can physically impinge on the cavity and cause stenosis. Osteophytes that arise on the superior and inferior articular facets encroach on the lateral recess and central canal, respectively. The most common site of DLSS is between L4 and L5 vertebrae [9].
Dual Energy X-Ray Absorptiometry (DXA) scans are able to assess Bone Mineral Density (BMD), and thus provide an estimate of fracture risk [10]. A reduction in bone mass and degradation of skeletal architecture is typical of osteoporosis. In this condition, bone density assessment per se may underrate the actual risk of fracture. Immediate appraisal of the skeletal microarchitecture could therefore improve the accuracy of measurement of bone strength parameters and fracture risk [11-14].
The Trabecular Bone Score (TBS) is a new technique that performs an analytical assessment of the novel grey-level texture measurements on DXA lumbar spine scans. It does not offer an absolute measure of the trabecular microarchitecture [15], but provides an indirect assessment or index. Use of TBS alone can predict the presence of osteoporosis. In two patients who have equivalent BMD, the patient who exhibits a lower TBS has a higher risk of fracture which is related to poorer bone structure [16]. In order to obtain TBS, anteroposterior lumbar spine DXA scans are reassessed; areal BMD (aBMD) is incorporated and specific software is utilised to evaluate the datasets. The two variables, lumbar TBS and aBMD, are both related to age. TBS is relatively constant in patients aged from 30years to 45 years. TBS gradually declines with increasing age [17]; this is more prominent in females than in males. The degree to which it reduces is in keeping with the decrease in lumbar spine aBMD; a similar effect is seen for short-term reproducibility [18]. The presence of osteoarthritis is frequently associated with irregular increases in BMD. Although it is well-described that if sclerotic degenerative changes are present, the lumbar aBMD may be artificially elevated [19], several studies have indicated that the TBS is not influenced by lumbar sclerosis [20]. One reason for this is that TBS is calculated from relative differences in the grey-level texture, and not from absolute values [20].
The aims of this study are to establish how crucial the use of the TBS is as an adjunct to aBMD, and to determine how each parameter contributes to Fracture Risk (FRAX) in patients with DLSS.
Patients and methods
A cross-sectional prospective study was conducted between January 2019 to February 2020 in Basrah Teaching Hospital. Fifty patients were included, in whom DLSS had been identified from patients’ symptoms and MRI findings. Symptomatology included lower back pain with radiation in a nervous distribution to the gluteal area, thigh or lower leg and neurogenic intermittent claudication, i.e. pain on walking that dissipated following rest. Patients also described easing the pain by sitting or by bending forwards. Magnetic resonance imaging findings encompassed sagittal encroachment of the intervertebral canal 10 mm, i.e. absolute stenosis, seen on midline T2-weighted sagittal images [21,22]. Lack of typical fat encircling the nerve root on sagittal T1-weighted sagittal images was indicative of foraminal stenosis. Eradication of fat between the disc and nerve root on axial T1-weighted images suggested extraforaminal stenosis. Patients were excluded if they had:
i. Non-degenerative LSS aetiology, e.g. congenital stenosis, spondylolisthesis, iatrogenic stenosis, for instance post-laminectomy, orstenosis following trauma;
ii. Previous history of therapy for osteoporosis prior to the current DXA;
iii. Prior or current history of neoplasia, thyroid disease, chronic renal or hepatic impairment; or
iv. Drug history of glucocorticoids, proton pump inhibitors or anti-epileptic agents.
Body Mass Index (BMI) was defined as weight (kg) / height2 (m2). Patients were categorised according to their BMI as normal (18.5-24.99), or as Grade I (25- 29.99), II (30-39.99) or III ( 40.00) overweight [23]. Patients were grouped according to whether they were from urban (group 1) or rural (group 2) locations.
DXA images of the lumbar spine and hip had been performed and reported in line with the manufacturer recommendations (GE Lunar Prodigy Pro). aBMD was appraised in the anteroposterior images of the lumbar spine, L1-L4 and the femoral neck, and the results given as g/cm2. The presence of artifact excluded images from BMD analysis. Lumbar spine phantoms were utilized for unit cross-calibration.
World Health Organization (WHO) criteria were employed for the definition of osteoporosis, i.e. decrease in BMD ≤ 2.5 Standard Deviation (SD) below peak bone mass (T-Score), osteopenia, i.e. T-score -2.5 < -1 SD, and normal, i.e. T-score > -1 SD [24]. Each patient was classified with respect to these criteria. The TBS was computed for the lumbar spine, L1 – L4, minus vertebral exclusions with the use of the DXA archives housed in the Rheumatology Unit at the Basrah Teaching Clinic (TBS iNsight software, 3.0.2.2-DXA: GE-Lunar Prodigy PRO). The following criteria we`re used for the TBS results: normal: TBS ≥ 1.35; regular with partially degraded bone TBS: between 1.2 and 1.35; degraded bone: TBS < 1.2[25].
All study recruits filled out the WHO FRAX assessment tool questionnaire [26]. This comprised enquiry relating to previous fragility fractures, rheumatoid arthritis, smoking and alcohol history, steroid usage and a family history of hip fracture. Age, BMI and gender were also noted. This information was used to generate a numerical score to indicate the likelihood of FRAX, e.g. hip fracture or a Major Osteoporotic Fracture (MOF), such as neck of femur, spine, ulnar, radius or humerus.
Statistical analysis
The Statistical Package for Social Sciences (IBM SPSS Statistics for Windows, version 24) was used for statistical analysis. Continuous variable data are presented as mean ± SD; normality of distribution was assessed utilising the Kolmogorov-Smirnov test and relationships between variables were appraised through the use of Pearson’s correlation coefficients. Analysis of Variance (ANOVA) was deployed for continuous variable comparisons between patient cohorts. Categorical data are given as numbers and/or percentages; comparison was achieved utilising chi-squared and Fisher exact tests. Statistical significance was defined as a p value of < 0.05.
Results
In total, 50 patients with DLSS were included within the study; 42 (84%) were female and 8 (16%) were male. Their demographic data are shown in Table 1. The average age of the study participants was 59.64 ± 10.06 years.
| Characteristics mean ± SD or n (%) | Degenerative LSS (n= 50) |
|---|---|
| Age, year | 59.64 ± 10.06 |
| Sex | |
| Female | 42(84) |
| Male | 8(16) |
| Residency | |
| Urban | 28(56) |
| Rural | 22(44) |
| BMI | 30.35 ± 6.1 |
| Age of diagnosis | 53.5 ± 9 |
| Duration of diagnosis | 6.62 ± 4.5 |
| TBS | 1.2 ± 0.21 |
| L1-L4 aBMD, g/cm2 | 1.08 ± 0.25 |
| T-score | -0.85 ± 2.085 |
| FN aBMD, g/cm2 | 0.914 ± 0.167 |
| T-score | -0.87 ± 1.225 |
| FRAXS | |
| MOF | 7.700 ± 4.361 |
| Hip fracture risk | 1.276 ± 1.673 |
SD: Standard Deviation; LSS: Lumbar Spine Stenosis; aBMD: Areal Bone Mineral Density; FN: Femoral Neck; TBS: Trabecular Bone Score; MOP: Major Osteoporotic Fracture
Table 1. Baseline characteristics of 50 patients with degenerative lumbar spinal stenosis.
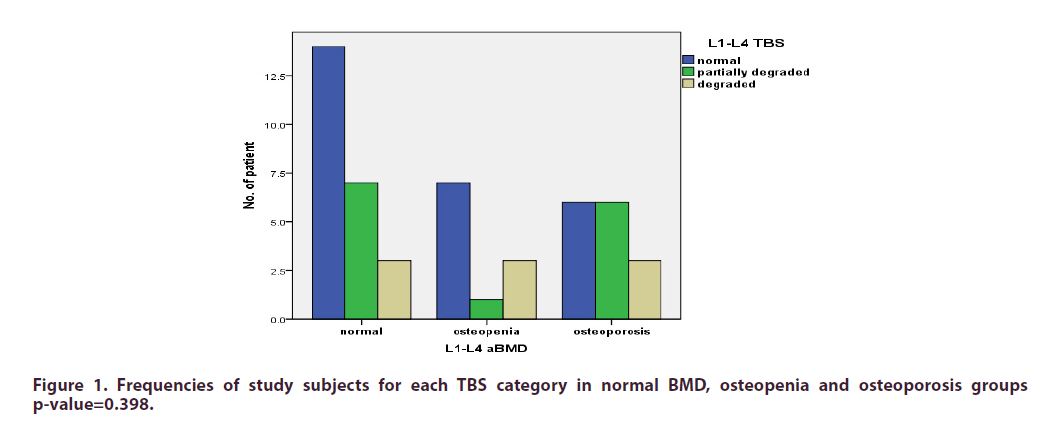
The L1-L4 TBS revealed that the microarchitecture was degraded, partially degraded and normal in 9 (18%), 14 (28%) and 27 (54%), respectively. The aBMD showed that osteoporosis and osteopenia were present in 15 (30%) and 11 (22%), respectively. L1-L4 aBMD was normal in 24 (48%) patients.
The TBS varied within the groups when the patient cohort was divided with respect to aBMD classification (Figure 1). In those in whom aBMD suggested osteopenia, 1 patient (9.1%) exhibited a partially degraded microarchitecture; in 3 (27.4%) patients, skeletal microarchitecture showed degradation. In patients in whom osteoporosis was confirmed on aBMD, TBS suggested that degraded microarchitecture was present in 3 (20%).
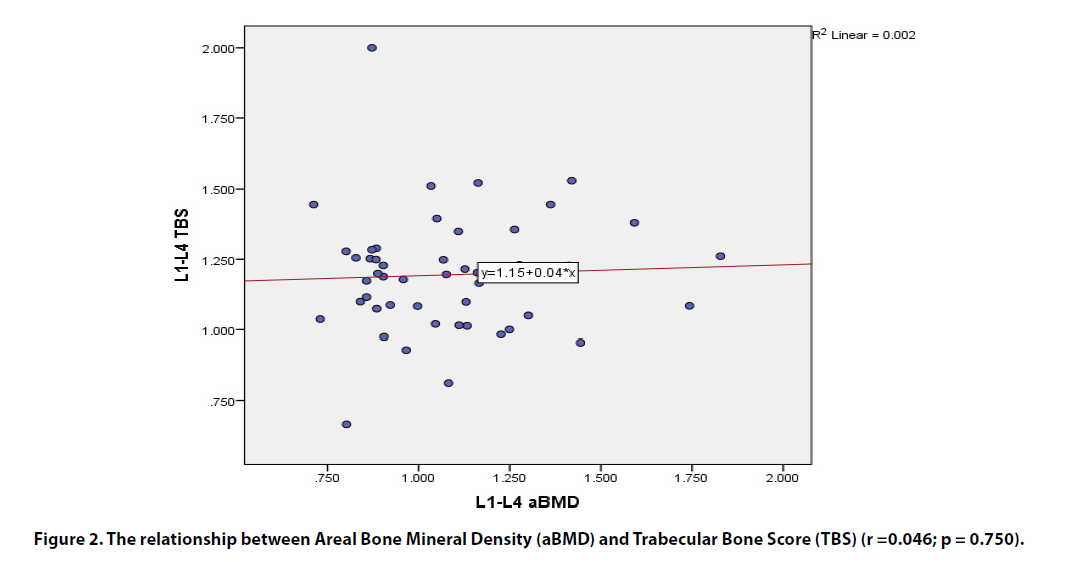
There was no relationship seen between L1-L4 aBMD and TBS measurements (r = 0.046; p = 0.75) (Figure 2). Lumbar spine TBS and femoral neck aBMD were similarly unrelated (r = 0.1; p = 0.48). A positive correlation between aBMD in L1-L4 images and those of the femoral neck was identified (r = 0.70; p < 0.001). There was a notable inverse relationship between TBS and BMI (r = -0.438; p = 0.001) and also between L1- L4 aBMD and FRAX (r = -0.617; p < 0.001); the latter included MOF and risk of hip fracture (r = -0.497; p < 0.001) (Table 2).
Figure 2. The relationship between Areal Bone Mineral Density (aBMD) and Trabecular Bone Score (TBS) (r =0.046; p = 0.750).
| L1-L4 TBS | L1-L4 TBS | L1-L4 TBS | L1-L4 aBMD | L1-L4 aBMD | L1-L4 aBMD | |
|---|---|---|---|---|---|---|
| r Value | R2Value | P value | r Value | R2Value | P value | |
| Age | 0.175 | 0.031 | 0.225 | -0.302 | 0.091 | 0.033 |
| BMI | -0.438 | 0.192 | 0.001 | 0.135 | 0.018 | 0.349 |
| Femoral neck aBMD | 0.1 | 0.01 | 0.48 | 0.71 | 0.504 | <0.001 |
| FRAXS | ||||||
| MOF | -0.118 | 0.014 | 0.416 | -0.617 | 0.38 | <0.001 |
| Hip fracture risk | -0.014 | 0 | 0.926 | -0.497 | 0.247 | <0.001 |
Table 2. Correlation of the L1-L4 TBS and L1-L4 aBMD with different parameter. Significant inverse correlation between TBS and BMI (r = -0.438). Inverse correlation between L1-L4 aBMD and FRAXS which includes MOF and hip fracture risk (r = -0.617, r = -0.497, respectively (r, correlation coefficients).
Discussion
Most of the study cohort were women (84%). This figure is in keeping with Singh et al., who reported a higher prevalence of spinal stenosis in females throughout the vertebrae, indicating a likely influence of low oestrogen levels on spinal degeneration [27]. Furthermore, these authors reported that in comparison to males, females had a lower inherent anteroposterior diameter of the spinal canal, and so relatively smaller degrees of bony encroachment will give rise to typical clinical features. However, in other studies, no notable gender difference has been identified. In a study of 2,751 patients referred with clinically apparent LSS to William Beaumont Hospital in Michigan, no gender variation was observed [28].
In the patients with DLSS presented in this study, 30% had osteoporosis and 22% exhibited osteopenia, numbers which are not in agreement with previous publications. Utilising the lumbar anteroposterior DXA images in both male and female LSS patients, Andersen et al,. noted 9% and 30% had osteoporosis and osteopenia, respectively [29]. In subjects with LSS aged over 60 years, Lee et al., again in the anteroposterior plane, reported the presence of osteoporosis in 22.6% of their study cohort; osteopenia was observed in 56.6% [30]. These results are notably at variance with those seen in this group of patients. Differences could be attributed to the higher age of patients, additional pathologies and the existence of heterotopic ossification that could give rise to an artificially elevated aBMD on lumbar DXA [31].
The TBS score measured in these patients bore no resemblance to their osteoporosis classification with respect to the WHO criteria (p = 0.398). The TBS was calculated from the 3-dimensional grey-level texture images acquired by DXA and provided a means to assess the trabecular microstructure and overall integrity of the skeleton [32]. In comparison to the BMD that is measured from DXA scans, TBS is unaffected by degenerative changes within the lumbar spine [20,33]. Thus, if a low TBS is recognized, this may represent suboptimal bone strength which may not be evident on the routine scan. This may be the reason why there is an elevated risk of fracture in subjects with DLSS that are deemed to have either normal BMD or osteopenia.
A negative association was noted between lumbar TBS and BMI. Amnuaywattakorn et al,. have documented the artifactual consequences of soft tissue, which has a greater depth in patients with raised BMI and creates image noise or simulates a blurring filter. These effects diminish pixel differentiation, and therefore the TBS [34].
Although no relationship was identified between lumbar spine aBMD and TBS, the BMD detected within the lumbar spine and the neck of femur was correlated. Since TBS is not influenced by the lumbar spine degenerative process, it should differ in its assessment from the aBMD. Any correlation between TBS and aBMD becomes more tenuous as BMD diminishes. BMD reduces with age, often with concomitant degenerative findings, e.g. osteophyte formation or aortic sclerosis. These areas of calcification impact the BMD, but not the TBS [35].
Although there was a strong negative association between FRAX, i.e. MOF and hip fracture risk with measured L1-L4 BMD, this relationship was not seen with TBS. FRAX is employed in order to gauge the possibility of hip or MOF over the next decade according to the patient’s identified risk factors. It fails to encompass the bone qualities that provide autonomous adjunctive information to BMD assessment or a history of previous fracture. These results indicate that TBS can be an autonomous variable that impacts fracture risk appraisal.
In summary, this research confirmed that there is a higher prevalence of DLSS in females. Within this cohort of LSS patients, an increased incidence of osteoporosis and a degraded skeletal microarchitecture were noted within the lumbar spine. TBS is a standalone, reliable and strong indicator of fracture risk, unrelated to FRAX.
Conflicts of Interest
The author declared that there are no conflicts of interest.
Ethical Approval
Approval code BT6 /5099 in 14/10/2020 issued by the Institutional Review Board (IRB) and the Basrah medical collage that granted the approval.
Informed Consent
consent was obtained by all participants in this study.
Funding
This research did not receive any specific grant from funding agencies in the public, commercial, or not-for-profit sectors.
Declaration of Competing Interest
None.
References
- Postacchini F. Lumbar spinal stenosis and pseudostenosis: definition and classification of pathology. Ital. J. Orthop. Traumatol. 9, 339–350(1983).
- Postacchini F. Management of lumbar spinal stenosis. J. Bone. Joint. Surg. 78B, 154–164(1996).
- Yong-Hing K, Kirkaldy-Willis WH. The pathophysiology of degenerative disease of the lumbar spine. Orthop. Clin. North. Am. 14, 491–504 (1983).
- Yoshida M, Shima K, Taniguchi Yet al.Hypertrophied ligamentum flavum in lumbar spinal canal stenosis. Pathogenesis and morphologic and immunohistochemical observation. Spine. (Phila78 Pa 1976)17, 1353–1360.B, 154–164 (1992).
- De Villiers PD, Booysen EL. Fibrous spinal stenosis. A report on 850 myelograms with a watersoluble contrast medium. Clin. Orthop. Relat. Res. 140–144 (1976).
- Roberson GH, Llewellyn HJ, Taveras JM. The narrow lumbar spinal canal syndrome. Radiology. 107, 89–97 (1973).
- Fanuele JC, Birkmeyer NJ, Abdu WAet al.The impact of spinal problems on the health status of patients: have we underestimated the effect?.Spine. 25, 1509–1514 (2000).
- Yong-Hing K, Kirkaldy-Willis WH. The pathophysiology of degenerative disease of the lumbar spine. Orthop. Clin. North. Am. 14, 491–504 (1983).
- Seung Yeop Lee, Tae-Hwan Kim, Jae Keun Ohet al.Lumbar Stenosis: A Recent Update by Review of Literature. Asian. Spine. J.9(5), 818–828 (2015)
- JA. Kanis, F. Borgstrom, C. De La et al. Assessment of fracture risk. Osteoporos. Int. 16, 581–589(2005).
- Rice JC, Cowin SC, Bowman JA. On the dependence of the elasticity and strength of cancellous bone on apparent density. J. Biomech. 21(2), 155e168 (1988).
- Majumdar S. A review of magnetic resonance (MR) imaging of trabecular bone micro-architecture: contribution to the prediction of biomechanical properties and fracture prevalence. Technol. Health. Care. 6(5e6), 321e327 (1998).
- Silva BC, Leslie WD. Trabecular Bone Score: A New DXA–Derived Measurement for Fracture Risk Assessment. Endocrinol. Metab. Clin. North. Am. [Internet]. 46(1), 153–80 (2017).
- Silva BC, Leslie WD, Resch Het al. Trabecular Bone Score: A Noninvasive Analytical Method Based Upon the DXA Image. J. Bone. Miner. Res. [Internet]. 29(3), 518–530 (2014).
- Simonelli C, Leib E, Mossman N, Winzenrieth Ret al.Creation of an age-adjusted, dual-energy x-ray absorptiometry-derived trabecular bone score curve for the lumbar spine in non-Hispanic US White women. J. Clin. Densitom. 17, 314–319 (2014).
- Hans D, Goertzen AL, Krieg M-Aet al.Bone Micro-Architecture Assessed by TBS Predicts Osteoporotic Fractures Independent of Bone Density: The Manitoba Study. J. Bone. Miner. Res. 26, 2762–2769 (2011).
- G. Liu, M. Peacock, O. Eilamet al. Johnston, Effect of osteoarthritis in the lumbar spine and hip on bonemineral density and diagnosis of osteoporosis in elderly men and women. Osteoporos. Int. 7, 564–569(1997).
- S. Kolta, K. Briot, J. Fechtenbaum et al. TBS result is not affected by lumbar spine osteoarthritis. Osteoporos. Int. 25, 1759–1764(2014).
- Bolender NF, Schonstrom NS, Spengler DM. Role of computed tomographyand myelography in the diagnosis of central spinal stenosis.J. Bone. Joint. Surg. Am. 67, 240–246 (1985).
- Sortland O, Magnaes B, Hauge T. Functional myelography with metrizamidein the diagnosis of lumbar spinal stenosis. Acta. Radiol. Suppl. 355, 42–54 (1977).
- NM-T CG, Goto R. Human variation and body mass index: a review of the universality of BMI cut-offs, gender and urban-rural difference,and secular changes. J. Physiol. Anthropol. 26(2), 109e112 (2007).
- Kanis JA, Melton LJ 3rd, Christiansen Cet al.The diagnosis of osteoporosis. J. Bone. Miner. Res. 9(8), 1137–1141 (1994).
- Cormier C, Lamy O, Poriau S. TBS in routine clinial practice: proposals of use. Med. imaps Group.(2012).
- Kanis JA. Diagnosis of osteoporosis and assessment of fracture risk. Lancet. 359(9321), 1929–1936 (2002).
- V. Singh a, R. Sethi a, B.K.S. Chauhan et al. Lumbar spinal stenosis and morphometry of lumbar vertebral canal. J. Anat. Soc. India. 65, 33–37 (2016).
- LaBan MM, Imas A. ‘‘Young’’ lumbar spinal stenotic: review of 268 patients younger than 51 years. Am. J. Phys. Med. Rehabil. 82, 69–71 (2003).
- Andersen T. Degenerative spondylolisthesis is associated with low spinal bone density: a comparative study between spinal stenosis and degenerative spondylolisthesis. Biomed. Res. Int. 2013, 123847 (2013).
- Lee BH. Osteoporotic profiles in elderly patients with symptomatic lumbar spinal canal stenosis. Indian. J. Orthop. 46(3), 279–284 (2012).
- Wildberger L, Boyadzhieva V, Hans D et al. Impact of lumbar syndesmophyte on bone health as assessed by bone density (BMD) and bone texture (TBS) in men with axial spondyloarthritis. Joint. Bone. Spine. (2016).
- Silva BC, Leslie WD, Resch Het al. Trabecular bone score: a noninvasive analytical method based upon the DXA image. J. Bone. Miner. Res. 29(3), 518–530 (2014).
- Dufour R, Winzenrieth R, Heraud Aet al. Generation and validation of a normative, age-specific reference curve for lumbar spine trabecular bone score (TBS) in French women. Osteoporos. Int. 24(11), 2837–2846 (2013).
- Sasithorn Amnuaywattakorn, Chanika Sritara1, Chirawat Utamakul et al. Simulated increased soft tissue thickness artefactually decreases trabecular bone score: a phantom study. BMC. Musculoskeletal. Disorders. 17, 17 (2016).
- I.R. Reid, M.C. Evans, R. Ameset al.The influence of osteophytes and aortic calcification on spinal mineral density in postmenopausal women. J. Clin. Endocrinol. Metab. 72, 1372–1374(1991).
- Kanis JA, Oden A, Johnell Oet al. The use of clinical risk factors enhances the performance of BMD in the prediction of hip and osteoporotic fractures in men and women. Osteoporos. Int. 18(8), 1033–1046 (2007).
- Diez-Perez A, Gonzalez-Macias J, Marin Fet al. Prediction of absolute risk of non-spinal fractures using clinical risk factors and heel quantitative ultrasound. Osteoporos. Int. 18(5), 629–639 (2007).
