Research Article - Clinical Practice (2018) Volume 15, Issue 6
Retrospective analysis of clinical and analytical patterns of cardiorenal syndrome in a series of 58 patients admitted to a level 2 intermediate care unit
- Corresponding Author:
- H. Viegas
Hospital São Bernardo
Centro Hospitalar de Setúbal
Medicina Interna, Setúbal, Portugal
E-mail: hugo.b.viegas@gmail.com
Abstract
Background: In recent years new data on the pathophysiology of cardiorenal syndromes (CRS) has been collected but the impact in acute management is still to be established. Hypothesis: We tried to find different patterns using simple clinical and analytical data that could point to the main decompensated mechanism by accessing the impact of Non-invasive ventilation (NIV), the previous renin angiotensin inhibition and the diuretic strategy, bolus vs perfusion, on these different patterns. Methods: We selected 110 patients with decompensation of heart or renal function but excluded 52 for not having CRS or for presenting acute type 5 (sepsis). Results: Mean age was 76,2 yo. 55,2% males. Mortality was 20,7%. 72,41% had preserved left the ventricular function. There were 2 peaks of time/worst renal function, at first 24hrs and between day 3 and 4. Patients with isolated pulmonary congestion were worst at 2,1 days and peripheral only at 4,3 days p=0,0862. Those with peripheral congestion had the same worsening of renal function with furosemide in bolus versus perfusion despite higher doses. Isolated pulmonary congestion combined with a higher dose of furosemide administered by perfusion had a more severe AKI. Patients doing Non Invasive Ventilation with Jugular Venous Distention or Congestive Liver (N=4 of 37) had worst AKI than those without (p<0,05). Previous RAS-inhibitors at maximum dose were protective vs no RAS-inhibition (p=0,03). Conclusion: In conclusion, there are more subtypes than the traditional classification of the cardiorenal lesion in 5 syndromes and the 3 types of heart failure at least based on the location of congestion.
Keywords
cardiorenal syndrome, heart failure, renal failure, congestion, non-invasive ventilation, diuretic
Introduction
As chronic diseases, heart failure and renal failure have a somewhat parallel course in patient’s history but it’s in the acute setting that management becomes complicated and demanding [1]. Around 10 years ago, cardiorenal syndrome (CRS), was categorized into 5 subtypes [2]. In recent years, new pathophysiology, partially in common between the types, is identified as reviewed in the ADQI Consensus [3]. The long-term pharmacological therapies are similar but during decompensation, the therapies given can improve one and worsen the other condition [4].
The latest research proposes new pathophysiology relations between the heart and the kidney. The failing heart induces renal injury due to Intravascular Hypovolemia [5] and/or Low Cardiac Output with diminished renal blood flow or after aggressive decongestion [6], Venous Congestion [7] with Increased Intratubular Pressure [8] and peripheral oedema and Sympathetic Nervous System (SNS) and the Renin–Angiotensin System (RAS) Activation [9]. The failing kidney induces heart disfunction due to sodium and water retention [10] with fluid overload, arrhythmias from electrolytic imbalance, pro inflammatory state [11] leading to negative inotropic effects and SNS and the RAS activation [12].
The impact of these individual mechanisms in acute management is still to be found. In intensive care, the hemodynamic state is accessed using invasive measurements which provide information that can be used in therapeutic personalization. It's also hard to access which mechanisms are off balance in clinical practice.
Volume [5] and fluid overload can be evaluated using different methods: invasively and in patients ventilated in shock we can hemodynamically monitor several parameters [13] that can help us estimate fluid necessities. However, on other settings physicians have to balance their clinical finds with an analytical concentration of different solutes of the plasma [14], biomarkers of elevated intracardiac pressures like NT-proBNP [15] and ST2 [16] and echography (thoracic and inferior vena cava) [17] in order to make decisions.
The venous congestion had also been one of the main physiologies suggested in the type 1 CR. It has been associated with central venous pressure [18,19], not normally available in the wards, and intratubular renal congestion, which is being researched in clinical settings as reviewed [20]. Abdominal volume with ascites, liver congestion, and peripheral oedema are objective signs and more practical in the clinical setting [21].
SNS and RAS activation aren't measured routinely in acute patients but the drugs to manage it are proven beneficial in disease progression, reducing acute decompensation and mortality [22,23]. The guidelines recommend the maximum dose tolerated showing the recognized importance of inactivation of these systems [24,25].
The inflammatory state (tumor necrosis factor alpha (TNF-a) and interleukins) of chronic kidney disease [26] has been found on acute heart failure but their practical utility in the acute setting is yet to be found [27].
In the wards and intermediate care units, the attending physician only has clinical and analytical tools to use in the approach of the patient. The authors tried to find different patterns using simple clinical and analytical data that could point to the main decompensated mechanism using a retrospective cohort sample of patients from a level 2 intermediate care unit. We also accessed the impact of Non-invasive ventilation (NIV), the use of Renin Angiotensin Aldosterone inhibitors and the strategy of diuretic and hydration on these different patterns.
Methods
This is an observational retrospective study performed in a level 2 Intermediate Care Unit of Internal Medicine Service of Centro Hospitalar de Setúbal, in Portugal. We consulted hospital records from 1-January-2015 to 30-July-2017 for the diagnosis of chronic and acute heart failure and renal failure. We selected 120 patients with decompensation of heart or renal function. We then consulted the digital clinical and laboratory records and excluded 60 for not having cardiac and renal injuries simultaneously or for having acute type 5 (sepsis according to the Surviving Sepsis Campaign Guidelines).
Definitions and Criteria
We defined acute heart failure based on the European Cardiology Society definition [24]. Acute renal failure was defined based on KDIGO AKIN guidelines [27]. We organized patients in type 1 CRS when the heart was the main decompensation and type 3 when the kidney was the main diagnosis. Volume overload was divided in central with pulmonary congestion or in peripheral with edema of the inferior members. Positive Liver congestion was defined when Jugular Venous Distention was present and there was elevated liver biochemistry. The renal glomerular function was calculated using the Modification of Diet in Renal Disease (MDRD). Intravascular Volume was estimated using the clinical impression and on analytical values using the Strauss Formula [14] for plasma volume (=<5 or >5), estimated osmolarity formula[28] (=<306 or >306)[28], albumin and BNP levels. A spike in diuresis was defined when there was a 50% increase during the previous 24hours.
Statistical Analysis
The categorical variables are presented as N and % of total patients. Non-normal continuous variables are presented as median and 95% confidence intervals and normal as a mean ± standard deviation. Normality was tested using Shapiro Wilko. Significance was established by Student's t-test or ANOVA or by the corresponding non-parametric test, where appropriate. Differences were considered significant when p<0,05. Software used was Microsoft Excel 2016 and GraphPad Prism 6.
Results
The cohort had 54,1% males with a mean age of 74,6 years for males and 79,2 years for females. The Median length of stay in the Intermediate Care Unit was 6 days (CI95%: 4-7). Mortality was 20,7%. The most common comorbidity was Arterial Hypertension in 70% followed by Atrial Fibrillation 44% and Type 2 Diabetes mellitus 39% (TABLE 1).
|   N=58 | N % | |
|---|---|---|
| Age | 76,3 yo | |
| Female | 26 | 45,8% |
| Male | 32 | 55,2% |
| Length of stay in Unit | 6 (CI95%: 4-7) | |
| Mortality Rate | 12 | 20,7% |
| Cardiovascular Risk Factors/Comorbidities | ||
| Arterial Hypertension | 43 | 70% |
| Atrial Fibrillation | 27 | 44% |
| Type 2 Diabetes | 24 | 39% |
| Hypercholesterolemia | 20 | 33% |
| Obesity | 12 | 20% |
| History of Ischemic Events/Ischemic Cardiomyopathy | 10 | 16% |
| Chronic Obstructive Lung Disease | 7 | 11% |
| Anemia | 7 | 11% |
| Sleep Apnea | 6 | 10% |
| Hypothyroidism | 5 | 8% |
TABLE 1. General demographics of our sample.
Based on the classical classification, there were 45 (77,6%) patients with cardiorenal type 1 and 13 (22,41%) with type 3. The mortality rate was higher in Type 1 with 19% but the degree of decrease Glomerular Filtration Rate from baseline was similar with -0,51 (±0,16) vs -0,56 (±0,17) mL/min/1.73 m2. There were 27 (46,6%) with a known baseline GFR <60 mL/min/1.73 m2 and so with chronic renal disease class III or more. 5 patients needed renal replacement dialysis technique and none of them died. In relation with heart failure class, we had 42 (72,41%) with preserved left ventricular function with 11,9% mortality rate, 6 with the new intermediate class and 10 (17,24%) with reduced LV ejection fraction and with 50% mortality. The decrease of GFR was also similar (TABLE 2).
| N | N % | Mortality Rate | Worsening Glomerular Filtration Rate (decrease in MDRD mL/min/1.73m2) | Timing of worst renal function (days) | |
|---|---|---|---|---|---|
| Total | 58 | 20,7% | -0,52 (± 0,16) | 1 (CI95%: 1-2) | |
| Cardiorenal Syndrome Types | |||||
| Type 1 | 45 | 77,6% | 19% | -0,51 (± 0,16) | 2 (CI95%: 1-3) |
| Type 3 | 13 | 22,41% | 1,7% | -0,56 (± 0,17) | 1 (CI95%: 0-3) |
| Previous Diagnosis | |||||
| Heart Failure class | |||||
| Preserved | 42 | 72,41% | 11,9% | -0,52 (± 0,17) | 1 (CI95%: 1-2) |
| Intermediary | 6 | 10,34% | 33,3% | -0,46 (± 0,12) | 1 (CI95%: 0-6) |
| Reduced | 10 | 17,24% | 50,0% | -0,58 (± 0,15) | 2 (CI95%: 0-5) |
| Chronic Renal Failure III-V | 27 | 46,6% | 6,9% | -0,5 (± 0,146) | 2 (CI95%: 1-3) |
| Dialysis | 5 | 8,77% | 0% | ||
TABLE 2. Analysis of mortality, worsening glomerular filtration rate and timing of worst renal function in the different traditional classification of cardiorenal syndrome types and heart failure classes. MDRD Modification of Diet in Renal Disease formula.
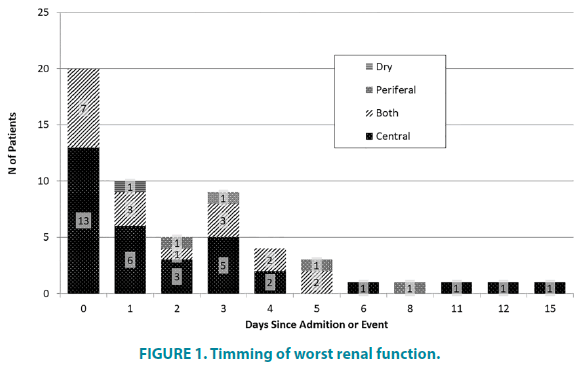
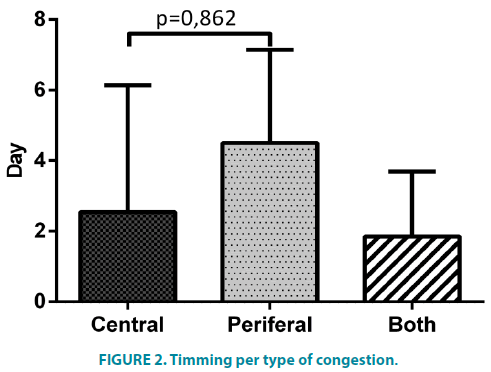
In FIGURE 1 we can see the timing of worst renal function (WRF) and identify 2 peaks, one between admission and first 24 hours and another around day 3 and 4. When the Congestion is only peripheral the timing of worst AKI trends to be a few days after admission. There was no difference in timing when grouping for left ventricle systolic function or type of syndrome. Comparing the presenting congestion pattern (FIGURE 2) there was a non-significant difference between patients with pulmonary congestion (alone or with anasarca) and those with peripheral congestion alone (p=0,0862).
In those with mainly a heart decompensation (type 1 CRS) we compared the response to diuretics between those with pulmonary congestion alone and those with a peripheral congestion component (with or without pulmonary congestion). Those with pulmonary congestion that needed a higher dose of diuretics administered by perfusion 60 mg (CI95% 60- 60) vs 144 mg (CI95% 96-320) (p<0,0001) had a more severe AKI with greater difference in estimated Glomerular Filtration Rate (eGFR) -0,47 ± 0,17 mL/min/1.73 m2 vs. -0,64 ± 0,18 (p=0,0334) and achieved similar diuresis 2613 ± 1456 ml/24h vs 2213 ±1284. Those with a peripheral congestion component also needed different dose of diuretics 60 mg (CI95% 40- 60) vs 100 mg (CI95% 60-240) (p=0,0007) but had no difference in GFR deterioration -0,52 ± 0,123 mL/min/1.73 m2 vs. -0,54 ± 0,147 (p=0,806) and also achieved similar diuresis 2939 ± 957 ml/24h vs 4270 ± 2255 (TABLE 3).
| Pulmonary Congestion only | Bolus | Perfusion | Different? |
|---|---|---|---|
| N=23 | N=8 | ||
| Decrease in GFR (mL/min/1.73m2) | -0,47 ± 0,17 | -0,64 ± 0,18 | p=0,0334 |
| Median dose (mg) | 60 (CI95% 60-60) | 144 (CI95% 96-320) | p<0,0001 |
| Diuresis Max (ml/24h) | 2613 ± 1456 | 2213 ± 1284 | ns (p=0,475) |
| Peripheral Venous Congestion Component | |||
| N=17 | N=5 | ||
| Decrease in GFR (mL/min/1.73 m2) | -0,52 ± 0,123 | -0,54 ± 0,147 | ns (p=0,806) |
| Median dose (mg) | 60 (CI95% 40-60) | 100 (CI95% 60-240) | p=0,0007 |
| Diuresis Max (ml/24h) | 2939 ± 957 | 4270 ± 2255 | ns (p=0,261) |
TABLE 3. Comparison of the different congestion types about diuretic modality, response to therapy and the decrease of renal function. CR cardiorenal GFR Glomerular filtration rate.
We defined 50% with hypervolemia using empirical clinical and analytical evaluation from the records, which received the same amount of diuretics, which wasn't reflected in difference from baseline creatinine (52,5% (CI95% 40 to 62,5%) vs 50,8% (CI95% 43,5 to 60,3%) (p=0,67)) or the amount of diuresis (2565 ml/24 hr (CI95% 2179 to 2950 ml) vs 3088 ml/hr (CI95% 2425 to 3751 ml) (p=0,167)).
For the use of estimated plasma volume we chose the threshold of 5 where those with >5 (N=26) had an 317,6 ± 4,105 mOsm/Kg and <5 (N=29) had 336,5 ± 5,678 mOsm/Kg (p=0,0094). There was also no difference in renal worsening (49,5% ± 3,14% vs 53,6% ± 3,02% – p=0,35) and diuresis was equal (2500 ml/24hr (CI95% 1900 to 3700 ml) vs 2350 ml/hr (CI95% 2000 to 3700 ml) (p=0,5662) between groups using these criteria. Empirical hipervolémia had an EPS of 6,275 (CI95% 5,38 to 7,843 ml) while normovolémia had 5,212 (CI95% 5,1 to 6,54 ml) (p=0,266).
Hydration was prescribed in 37 patients and was around 1000 ml. It had no effect on the time between the most severe creatinine values and the diuresis peak, 2 days (CI95% 1 to 4) with hydration vs 2,5 days (CI95% 1 to 3) without, or the amount of diuresis. 2200 ml (CI95% 1950 to 3200) with hydration vs 2500 ml (CI95% 2000 to 3400) without. Hydration was used when the attending clinician thought the patient was hypovolemic or to replenish ions.
There was no difference in renal deterioration between those with and without signs of Jugular Venous Distention or Congestive Liver (p=0,18). We had a small sample of patients under NIV (N=37) but in this subset of patients, there was more severe AKI in those with Jugular Venous Distention or Congestive Liver (N=4) 0,6737 ± 0,123 mL/min/1.73 m2 than those without 0,4967 ± 0,15 (p=0,0473) with no increase in mortality. The same was not verified when we used the clinical criteria of Peripheral Venous Congestion vs. Pulmonary Congestion (p=0,09).
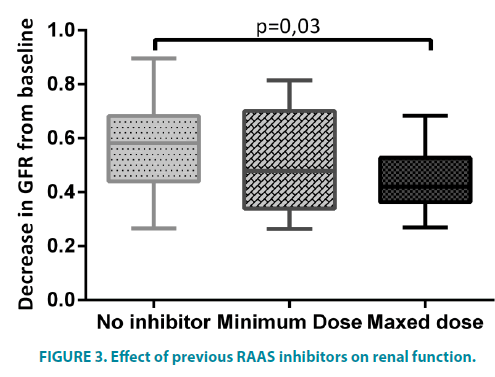
We also compared the use of RAAS inhibitors in previous ambulatory therapy (FIGURE 3) and those with mixed dose of these drugs had a lesser decrease in eGFR -0,459 ± 0,12 mL/ min/1.73 m2 vs -0,564 ±0,17 (p=0,03) than those without previous medication despite the similar doses of diuretics used 60 mg (CI95% 60-80) vs. 60 mg (CI95% 40-60).
Discussion
The mean age was 76,3 years (74,6 years for males and 79,2 years for females) and mortality of 20,7%. Comparing with the ROSE Trial [29] the mean age of the placebo group was 70 years and in Mayo Clinic retrospective study [30] it was 73,8 years. In our study, there was a 20,7% mortality which is similar to the 3 month mortality of 21,3% and 21,1% described in the previous studies. There were 54,1% males and in Mayo clinic study there were 56% and we had the same portion 39% of diabetics with a higher number of patients with hypertension, 70% vs 60%.
Based on the traditional CRS classification, there were 45 (77,6%) patients with cardiorenal type 1 and 13 (22,41%) with type 3. This difference can’t be compared with studies performed before the new classification emerged but, although acute heart failure is more prevalent, it could represent a selection bias since our unit is run by internal medicine physicians and it doesn’t have renal function substitution techniques. The first reason can also account for the greater number of patients with preserved left ventricular function (72,4%). The mortality rate was higher in Type 1 with 19% vs 1,7% but this was not associated with the renal dysfunction since the decrease in Glomerular Filtration Rate was similar. There were 27 (46,6%) patients with chronic renal disease class III or more which is higher than those with type 3 CRS and can represent patients with type 2 or 4 with acute heart failure. Interestingly in Euro-HF and Euro-HF II [31], there were only 17% of Chronic renal failure (defined as serum creatinine >2.0 mg/dL) and in the ADHERE registry, 63,6% had chronic renal disease class III or more [32].
When analyzing the timing of Worst Renal Function, we can notice the presence of 2 peaks, which suggests the presence of more than one population inside this sample. We had no patients with only peripheral congestion that had renal dysfunction at day 0, but the fraction of patients with central congestion was higher. Comparing this 2 groups the timing of WRF was slightly different (p=0,0862). As extensively reviewed in a statement from 7th ADQI Consensus Conference [33] several studies describe that around 50% of patients have a worst renal failure in the first 3-4 days but they failed to observe this two different peaks. Central/lung congestion and is traditionally described as a sign of a congestive left heart side. This left side systolic or diastolic dysfunction can help explain this difference in CRS type 1. Also, the presence of arrhythmias or volume overload in CRS type 3 could explain an acute dysfunction of the left ventricle being reflected in central congestion. The second peak can be caused by aggressive decongestion.
There was a difference in the effect of diuretics in patients with type 1 CRS. Those with pulmonary congestion alone were more sensitive to the higher doses of furosemide in the form of perfusion while those with peripheral venous congestion had no difference despite the higher doses. This may be associated with Increased Intratubular Pressure in patients with peripheral venous congestion which would resolve with progressive decongestion balancing for the higher dose of diuretics. Those patients also seem to have more volume overload with a greater diuretic response. In previous randomized trials, these patients were not isolated from the general sample and they failed to demonstrate a positive impact of continuous infusion. In Felker et al. [34] high-dose and in Palazzouli et al. [35] continuous perfusion was associated with a worst renal function which did not happen in our subgroup.
Volémia was the most difficult variable to access as clinical signs of volémia have low sensibility. When using analytical methods of plasma volume and osmolarity both were associated with each other but were also irrelevant to access our outcomes (renal worsening and diuresis). In the study mentioned they found osmolarity to have a prognostic value in acute heart failure admissions [28] but didn’t study it as a clinical guide. In another study, estimated plasma volume was used as a predictor of cardiovascular events after acute myocardial infarction [14], again not as a therapy guiding tool.
While there wasn’t a difference in AKI between those that had signs of liver and jugular congestion and those that needed Non-invasive ventilation, it was shown that those with both NIV and Liver/ Jugular congestion had worst AKI. This can be due to the further increase of intra-abdominal pressure and right side pressures with NIV in these patients. This has been studied in mechanical ventilation in critically ill patients [36] but an RCT is needed to prove a correlation in NIV patients.
The protective effect of optimized RAAS inhibitors in previous ambulatory therapy in lowering the amount of renal dysfunction was also an interesting find which further supports the importance of these drugs. This was demonstrated in previous studies about chronic renal protection using double RAAS inhibition (ONTARGET 2008 and ORIENT 2011) or using supramaximal dose (DOSE 2007 and SMART 2009). Our study suggests an additional protection in acute renal aggression using a maxed dose only.
This retrospective observational study has several limitations and problems: the nature of the study and the lack of measured data and confounding factors limit the power of statistical analysis. The small sample of some groups also limits the power of the available statistical tools. Another limitation is the use of clinical signs that are based on the physician’s subjective reasoning and can’t be measured, but this was part of the study design that aimed to find clinical patterns based on signs that could be accessed in clinical practice.
Conclusion
The present study indicates that clinical reasoning with simple clinical data might be enough to find more personalized patterns of behavior, even though it’s nature and a small number of subjects prevents us from drawing further conclusions.
We find that there are more subtypes than the simple traditional classification of CRS in 5 subgroups, based on the first aggressor, and heart failure 3 subgroups, based on ejection fraction of the LV. In our study, we can conclude that the location of congestion is an important factor when accessing these patients and the attending physicians need to understand the pathophysiology behind the specific patient state to prescribe a personalized treatment. Large trials are needed to fully understand the impact of this different congestion patterns and different mechanisms in outcomes and response to treatments. Some big but older studies could even be reanalyzed based in this pilot and this new data. The use of point-ofcare ultrasound to access the location of congestion might bring a breakthrough in the area and should be used in future trials.
References
- Forman DE, Butler J, Wang Y, et al. Incidence, Predictors at Admission, and Impact of Worsening Renal Function among Patients Hospitalized with Heart Failure. J. Am. Coll. Cardiol. 43(1), 61-67 (2004).
- Ronco C, House AA, Haapio M. Cardiorenal syndrome: refining the definition of a complex symbiosis gone wrong. Intensive Care Med. 34(5), 957-962 (2008).
- McCullough PA, Kellum JA, Haase M, et al. Pathophysiology of the cardiorenal syndromes: Executive summary from the eleventh consensus conference of the Acute Dialysis Quality Initiative (ADQI). Contrib. Nephrol. 182, 82-98 (2013).
- Butler J, Forman DE, Abraham WT, et al. Relationship between heart failure treatment and development of worsening renal function among hospitalized patients. Am. Heart J. 147(2), 331-338 (2004).
- Hudson SR, Chan D, Ng LL. Change in plasma volume and prognosis in acutely decompensated heart failure: an observational cohort study. J. R. Soc. Med. 109(9), 337-346 (2016).
- Testani JM, Chen J, McCauley BD, et al. Potential Effects of Aggressive Decongestion During the Treatment of Decompensated Heart Failure on Renal Function and Survival. Circulation. 122(3), 265-272 (2010).
- Verbrugge FH, Dupont M, Steels P, et al. Abdominal Contributions to Cardiorenal Dysfunction in Congestive Heart Failure. J. Am. Coll. Cardiol. 62(6), 485-495 (2013).
- Winton FR. The influence of venous pressure on the isolated mammalian kidney. J. Physiol. 72(1), 49-61 (1931).
- Ferreira A, Bettencourt P, Dias P, Pestana M, Serrão P, et al. Neurohormonal activation, the renal dopaminergic system and sodium handling in patients with severe heart failure under vasodilator therapy. Clin. Sci. (Lond). 100(5), 557-566 (2001).
- Rea ME, Dunlap ME. Renal hemodynamics in heart failure: implications for treatment. Curr. Opin. Nephrol. Hypertens. 17(1), 87-92 (2008)
- Caselli C. Inflammation in cardiac disease: focus on the Interleukin-33/ST2 pathway. Inflamm. Cell Signal. 1(2), 1-9 (2014).
- Hostetter TH. Aldosterone in Chronic Kidney and Cardiac Disease. J. Am. Soc. Nephrol. 14(9), 2395-2401 (2003).
- Legrand M, Mebazaa A, Ronco C, et al. When Cardiac Failure, Kidney Dysfunction, and Kidney Injury Intersect in Acute Conditions: The Case of Cardiorenal Syndrome. Crit. Care Med. 42(9), 2109-2117 (2014).
- Duarte K, Monnez JM, Albuisson E, et al. Prognostic Value of Estimated Plasma Volume in Heart Failure. JACC. Heart Fail. 3(11), 886-893 (2015).
- Maisel A, Hollander JE, Guss D, et al. Primary results of the Rapid Emergency Department Heart Failure Outpatient Trial (REDHOT): A multicenter study of B-type natriuretic peptide levels, emergency department decision making, and outcomes in patients presenting with shortness of breath. J. Am. Coll. Cardiol. 44(6), 1328-1333 (2004).
- Aldous SJ, Richards AM, Troughton R, et al. ST2 has diagnostic and prognostic utility for all-cause mortality and heart failure in patients presenting to the emergency department with chest pain. J. Card. Fail. 18(4), 304-310 (2012).
- Ang SH, Andrus P. Lung ultrasound in the management of acutely decompensated heart failure. Curr. Cardiol. Rev. 8(2), 123-136 (2012).
- Mullens W, Abrahams Z, Francis GS, et al. Importance of Venous Congestion for Worsening of Renal Function in Advanced Decompensated Heart Failure. J. Am. Coll. Cardiol. 53(7), 589-596 (2009).
- Damman K, van Deursen VM, Navis G, et al. Increased Central Venous Pressure Is Associated With Impaired Renal Function and Mortality in a Broad Spectrum of Patients With Cardiovascular Disease. J. Am. Coll. Cardiol. 53(7), 582-588 (2009).
- Tang WHW, Kitai T. Intrarenal Venous Flow: A Window Into the Congestive Kidney Failure Phenotype of Heart Failure? JACC Hear. Fail. 4(8), 683-686 (2016).
- Sica DA. Edema Mechanisms in the Patient with Heart Failure and Treatment Options. Heart Fail. Clin. 4(4), 511-518 (2008).
- Pfeffer MA, Braunwald E, Moyé LA, et al. Effect of Captopril on Mortality and Morbidity in Patients with Left Ventricular Dysfunction after Myocardial Infarction. N. Engl. J. Med. 327(10), 669-677 (1992).
- Ljungman S, Kjekshus J, Swedberg K. Renal function in severe congestive heart failure during treatment with enalapril (the Cooperative North Scandinavian Enalapril Survival Study [CONSENSUS] Trial). Am. J. Cardiol. 70(4), 479-487 (1992).
- Ponikowski P, Voors AA, Germany SDA, et al. 2016 ESC Guidelines for the diagnosis and treatment of acute and chronic heart failure The Task Force for the diagnosis and treatment of acute and chronic heart failure of the European Society of Cardiology ( ESC ) Developed with the special contribution. Eur. Heart J. 37(27), 2129-2200 (2016).
- Cw Y, Jessup M, Bozkurt B, et al. 2016 ACC / AHA / HFSA Focused Update on New Pharmacological Therapy for Heart Failure : An Update of the 2013 ACCF / AHA Guideline for the Management of Heart Failure A Report of the American College of Cardiology / American Heart Association Task Force (2016).
- Grams ME, Rabb H. The distant organ effects of acute kidney injury. Kidney Int. 81 910), 942-948 (2012).
- Kellum JA, Lameire N, Aspelin P, et al. KDIGO Clinical Practice Guideline for Acute Kidney Injury. Kidney Int. 2, 1-138 (2012).
- Arévalo-Lorido JC, Gómez JC, Formiga F, et al. High serum osmolarity at admission determines a worse outcome in patients with heart failure: Is a new target emerging? Int. J. Cardiol. 15, 221: 238-242 (2016).
- Chen HH, Anstrom KJ, Givertz MM, et al. Low Dose Dopamine or Low Dose Nesiritide in Acute Heart Failure with Renal Dysfunction: The ROSE Acute Heart Failure Randomized Trial. JAMA. 10(23), 2533-2544 (2013).
- Owan TE, Hodge DO, Herges RM. Secular Trends in Renal Dysfunction and Outcomes in Hospitalized Heart Failure Patients. J. Card. Fail. 12(4), 257–262 (2006).
- Nieminen MS, Brutsaert D, Dickstein K, et al. EuroHeart Failure Survey II (EHFS II): A survey on hospitalized acute heart failure patients: Description of the population. Eur. Heart J. 27(22), 2725–2736 (2006).
- Heywood JT, Fonarow GC, Costanzo MR, et al. High Prevalence of Renal Dysfunction and Its Impact on Outcome in 118,465 Patients Hospitalized With Acute Decompensated Heart Failure: A Report From the ADHERE Database. J. Card. Fail. 13(6), 422-430 (2007).
- Bagshaw SM, Cruz DN, Aspromonte N, et al. Epidemiology of cardio-renal syndromes: workgroup statements from the 7th ADQI Consensus Conference. Nephrol. Dial. Transplant. 25(5), 1406-1416.
- Felker GM, Lee KL, Bull DA, et al. Diuretic Strategies in Patients with Acute Decompensated Heart Failure. N. Engl. J. Med. 364, 797-805 (2011).
- Palazzuoli A, Pellegrini M, Ruocco G, et al. Continuous versus bolus intermittent loop diuretic infusion in acutely decompensated heart failure: A prospective randomized trial. Crit. Care. 18 (3), 1-10 (2014).
- Morejón C de DS, Barbeito TOT. Effect of mechanical ventilation on the intraabdominal pressure in critically ill patients without other risk factors for abdominal hypertension: An observational multicenter epidemiological study. Ann. Intensive Care. S1, S22 (2012).
