Research Article - Interventional Cardiology (2021) Volume 13, Issue 5
Relaxation along Fictitious Field (RAFF) provide an appropriate alternative method for imaging chronic myocardial infarct without exogenous contrast media
- Corresponding Author:
- Timo Liimatainen
Research Unit of Medical Imaging,
Physics and Technology,
University of Oulu,
Oulu,
Finland,
E-mail: timo.liimatainen@oulu.fi
Received date: August 04, 2021 Accepted date: August 18, 2021 Published date: August 25, 2021
Abstract
Background: Relaxation along Fictitious Field with rank 2 (RAFF2) has been shown to provide contrast agent-free alternative for gadolinium based Late Gadolinium Enhancement (LGE) measurement in mouse model. To characterize chronic Myocardial Infarction (MI) by using Relaxation along Fictitious Field in human myocardium without contrast agents.
Methods and findings: Data for this study were collected in 18 patients with chronic infarct at 1.5 T. Scarred and remote area averages of RAFF2 relaxation time and steady state (TRAFF2 and SSRAFF2), native T1 and T2, Extra Cellular Volume (ECV) and LGE were calculated. Subsequently infarct sizes were determined and compared between LGE, ECV and RAFF2 maps. In addition, area of overestimation (AOE) was estimated for RAFF2 maps.
The TRAFF2 and SSRAFF2, native T1 and T2 relaxation times, ECV and LGE values elevated at scar compared to remote area. Areas of increased LGE were highly correlated to the areas with increased SSRAFF2 (R=0.71, p<0.01) and TRAFF2 (R=0.47, p<0.05).
Summary: RAFFn has been used to characterize myocardial infarction in humans and in mice. RAFFn owns potential to be used in the MI diagnosis without contrast agents.
Keywords
Myocardium . Scar . Rotating frame relaxation . Late gadolinium enhancement . Extracellular volume
Abbreviations
RAFF: Relaxation along Fictitious Field; RAFF2: Relaxation along Fictitious Field with rank 2; LGE: Late Gadolinium Enhancement; MI: Myocardial Infarction; TRAFF2: RAFF2 relaxation time; SSRAFF2: RAFF2 steady state; ECV: Extra Cellular Volume; AOE: Area of overestimation; RF: Radiofrequency; SAR: Specific Absorption Rate; ECG: Electrocardiography; FISP: Balanced steady-state free precession; TR: Repetition time; TE: Echo time; FOV: Field of View; FISP: Balanced steady-state free precession; MOLLI: Modified Look-Locker Inversion recovery; b-SSFP: Balanced Steady-State Free Precession
Introduction
The MI refers to loss of cardiomyocytes after a prolonged ischemia. The volume of dead myocytes is gradually replaced by a collagenous scar through replacement fibrosis. In the chronic phase, the scar contains a dense collagen-based extracellular matrix, myofibroblasts, stem cells, and neovascularization [1,2].
Late Gadolinium Enhancement (LGE) is the golden standard to image focal myocardial fibrosis in ischemic and non-ischemic cardiomyopathies. The LGE contrast mechanism is based on the delayed washout of contrast agent from myocardial fibrosis shortening longitudinal recovery time ( T1) [3,4]. Measuring T1 before gadolinium injection and repeat measurement at late enhancement, an extra cellular volume can be measured [5,6].
There is an increasing tendency towards endogenous contrast imaging methods (parametric mapping) for myocardial disease assessment in patients with insufficient renal function and allergic reaction to contrast agent. Native T1 and T2 relaxation time maps have become valuable clinical and research tool in cardiology. Native T1 captures fast molecular motions with correlation times close to inverse of Larmor frequency, and T2 map reflects slow molecular motions non-selectively [5-10].
Spin-locking techniques are used to probe selectively slow molecular motions during on-resonance Radiofrequency (RF) irradiation. Changes in longitudinal rotating frame relaxation time, T1ρ, reflect the changes in H nanoscopic magnetic environment. Associations between increased T1p and scar in chronic MI have been demonstrated [11,12]. A correlation between the area with elevated T1ρ relaxation time and the area with elevated signal in LGE was observed in swine infarct model [13] and in human patients [14]. Several studies have demonstrated potential clinical applications of T1p to investigate alterations of left ventricular pathology at acute and chronic MI [11-12,15]. However, the required RF power leads to a high Specific Absorption Rate (SAR) and consequently tissue heating, which constitutes a practical constraint on T1p in clinical applications.
Exploiting rotating frame Relaxation along a Fictitious Field (RAFF) compensates imperfections of the excitation flip angle and decreases the SAR [16,17]. In RAFF2, the fictitious field is created by nested sine and cosine amplitude and frequency-modulated RF pulses in sub-adiabatic regime, and magnetization precesses around the final effective RF field, which consists of the fictitious field, off-resonance and Radiofrequency (RF) field components. RAFF technique exploits the same phase cycling as adiabatic excitation pulse BIR-4 to refocus magnetization forming a basic building block. The RAFF2 tolerates a reasonable amount of main magnetic field and RF field inhomogeneities. Incrementing RAFF2 building blocks constructs RAFF2 pulse trains which are being used for in vivo measurements for RAFF2 weighting. Recent studies showed that RAFF2 relaxation time ( TRAFF2) is sensitive to myocardial fibrosis in mice at post-MI [16-20]. Ylä-Herttuala, et al. found significant correlation between MI area detected by TRAFF2 and Sirius red-stained histology, as well as negligible amount-of- overestimation when compared to LGE in mouse model [19,20]. Furthermore, RAFF2 was shown to increase in diffuse fibrosis induced by transversal aortic coarctation in mice [18].
In the current study, we exploit RAFF2 relaxation time and the respective steady state maps to image chronic myocardial scar in patients. We investigated the RAFF2 contrast between scar and remote area and compared infract sizes derived from LGE, ECV and RAFF2 maps.
Methods
Patients
Study participants (n=18) were recruited from a group of subjects with chronic MI (929 patients), a subgroup from ARTEMIS study NCT01426685 (Table 1). Subjects were randomly selected from original 929 MI subjects and included in the study if they were willing to participate and were in required physical condition to undergo MR imaging [21]. Since subjects were derived from ARTEMIS study, infarct ages were over several years and they were evolved and reached equilibrium state. Therefore, any variation in the age of the infarcts could be neglected.
| Age | Gender 1=man 2=woman | Hypertension | Diabetes | STEMI | NSTEMI | Mid septum | Lateral wall | Infarction segments |
|---|---|---|---|---|---|---|---|---|
| 68 | 1 | 1 | 0 | 1 | 0 | 12.4 | 7.9 | Focal epicardial infarction on infero-lateral wall, and mid-wall infarction on inferior wall (2 segments) |
| 56 | 1 | 1 | 1 | 1 | 0 | 13 | 12.8 | Regional diffuse subendocardial infarction on inferior and infero-septal walls and focal transmural infarction on infero-lateral wall (3 segments) |
| 70 | 1 | 1 | 1 | 1 | 1 | 16.4 | 11.3 | Near focal subendocardial infarction on inferior, infero-septal and infero-lateral walls (3 segments) |
| 59 | 1 | 1 | 1 | 0 | 0 | 15.9 | 10.9 | Near focal subendocardial infarction on inferior wall (1segment) |
| 67 | 1 | 1 | 0 | 1 | 0 | 4 | 7.8 | Regional mid-wall infarction on anterior, anterior-septal and infero-septal walls (3 segments) |
| 60 | 2 | 1 | 0 | 1 | 1 | 12.7 | 7.8 | Near transmural infarction on infro-septal and inferior walls (2 segment) |
| 71 | 1 | 1 | 0 | 0 | 1 | 11.5 | 7.8 | Mid-wall infarction on anterior wall (1 segment) |
| 61 | 1 | 1 | 0 | 0 | 1 | 12.7 | 11.8 | Mid-wall infarction on infero-lateral wall (1 segment) |
| 60 | 1 | 1 | 0 | 0 | 1 | 10.7 | 10.6 | Mid-wall infarction on infero-lateral wall (1 segment) |
| 63 | 1 | 1 | 1 | 0 | 1 | 18.1 | 6.6 | Focal subendocardial infarction on infero-septal, inferior and infero-lateral walls (3 segments) |
| 66 | 1 | 1 | 0 | 1 | 0 | 6.8 | 13.6 | Focal subendocardial and transmural infarction on antero-septal, inferior and infero-septal walls (3 segments) |
| 58 | 1 | 1 | 0 | 1 | 1 | 10.3 | 8 | Transmural infarction on inferior and infero-lateral walls (2 segments) |
| 58 | 1 | 1 | 1 | 1 | 1 | 14.6 | 11.5 | Subendocardial infarction on infero-lateral wall (1 segment) |
| 57 | 1 | 0 | 0 | 0 | 0 | 15.7 | 13.7 | Mid-wall infarction on anterior wall (1 segment) |
| 59 | 1 | 1 | 0 | 1 | 0 | 13.2 | 11.2 | Mid-wall infarction on anterior wall (1 segment) |
| 54 | 1 | 1 | 0 | 1 | 0 | 8.8 | 9.9 | Mid-wall infarction on inferior wall (1 segment) |
| 61 | 1 | 1 | 0 | 1 | 0 | 19.4 | 18.1 | Focal transmural infarction on infero-septal and inferior walls (2 segment) |
| 48 | 2 | 1 | 0 | 1 | 0 | 8.3 | 6 | Mid-wall infarction on inferior wall (1 segment) |
Table 1: Clinical data of the whole study population
CMR
All the measurements were performed at 1.5 T using a Siemens Aera (Siemens Healthineers GmbH, Erlangen Germany) scanner. The 18-channel body array coil together with receivers built in the bed were used with body transmitter. Electrocardiography (ECG) electrodes were placed across the chest of patients according to scanner instructions. All acquisitions were ECG-gated, and imaging’s were performed during breath-holds.
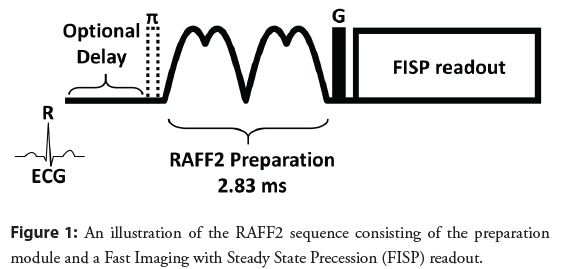
RAFF2 pulse waveforms (P) was created with initial 500 Hz amplitude leading to building block duration of 2.83 ms [16,17] (Figure 1). The building block was repeated [12,22] times to form RAFF2 pulse trains. Steady state and exponential decay were estimated using the model (Equation 1).

(FISP) readout with repetition time (TR) one R-R interval, echo time (TE) 3.6 ms, matrix size 192 × 156, flip angle 20°, Field of View (FOV) 40 × 32.5 cm2, and slice thickness 7 mm was used to obtain RAFF2 data.
Native and post-contrast T1 data was obtained using phasesensitive inversion recovery prepared Modified Look-Locker Inversion recovery (MOLLI) with balanced Steady-State Free Precession (b-SSFP) readout pulse. A 5s(3s)3s MOLLI sequence scheme with two sets of Look-Locker was employed as T1 imaging protocol. Two inversions were aimed to capture eight images over 11 heart beats while increasing inversion time (TI) with one breath-hold. Five images were acquired over consecutive cardiac cycles during the first inversion recovery followed by a threeheartbeat gap and then three images are acquired over consecutive cardiac cycles in the second inversion recovery [5,23]. The precontrast T1-mapping parameters were as follows: 8 weighted images, inversion time (TI) from 100 to 5000 ms, TR=300/TE=1 ms, isotropic in-plane resolution 1.2 mm, flip angle 35°, and slice thickness 7 mm. The post-contrast acquisition was performed at approximated 10 minutes after the intravenous injection of 0.3 ml/kg gadoteric (Guerbert, Grex Medical Oy; Kuopio, Finland) with following imaging parameters: 9 weighted images, TI=100- 4000 ms/TR=360 ms/TE=1 ms, isotropic in-plane resolution 2.1 mm, flip angle 35° and, slice thickness 7 mm.
A T2-prepared steady-state free precession ( T2P-SSFP) sequence with respiratory navigator and non-rigid motion correction was used to acquire three T2-weighted images, with three T2 preparation echo times (TE T2P=0, 24, and 55 ms) during breath-hold. T2 maps were generated using a log-transformed linear least-squares fitting [24,25]. The T2 mapping readout parameters were TR=230 ms/ TE=1.1 ms, isotropic in-plane resolution 2.1 mm, flip angle 70°, and slice thickness 7 mm.
LGE images were obtained by a 2D single inversion recovery prepared FISP sequence, 10 minutes after the intravenous injection. The imaging parameters were TI=350 ms/TR=1100 ms/ TE=1.1 ms, isotropic in-plane resolution 2.1 mm, flip angle 40°, and slice thickness 7 mm.
A 2D multi slice cardiac cine CMR was obtained using a standard Siemens balanced steady-state free precession readout. The cine CMR imaging parameters were as follows: number of frames 25, number of slices 13-15 depending on the size of heart, TR=41 ms between single excitations, TE=1.1 ms, isotropic in-plane resolution 2.1 mm, flip angle 55°, and slice thickness 8 mm. In addition, B1 was measured by combining a constant 1 ms duration hard pulse with varying power from 0 to 500 Hz to a FISP readout [22]. The measurement parameters were TR one cardiac cycle, TE=3.6 ms, isotropic in-plane resolution 4.2 mm, flip angle 20°, and slice thickness 7 mm.
Data analysis
RAFF2 maps were reconstructed from signal intensities pixelby- pixel manner using Aedes software package (http://aedes.uef. fi/) in Matlab ver. R2017b platform (Mathworks Inc. Natick, Massachusetts, USA). RAFF2 measurements consisted of five differently weighted images which were registered to the nonweighted image to prevent motion artifacts on mapped quantities using Matlab ver. R2017b Registration Estimator toolbox. Motion correction was performed by standard Siemens protocols for T1 and T2 and these relaxation times were calculated by using Siemens standard routines [23,24]. For quality assurance and checking fields homogeneity, quantitative RF field (B1) was calculated by fitting a cosine function pixel-by-pixel manner into B1 data. Qualitative B0 based on phase change between gradient echo images with two echo times. Postcontrast T1 map was registered to native T1 map before ECV map calculation using the same registration function as for RAFF2. The ECV maps were calculated based on native T1 map and postcontrast T1 map with the formula [5] (Equation 2).

Where HCT is blood haematocrit from 0.37 to 0.47 determined based on blood samples, T1(myo)pc postcontrast and T1(myo)n native T1 maps, T1 (blood)pc and T1(blood)n average left ventricle blood T1 relaxation times [5-7].
Regions of interest (ROIs) representing infarct and remote areas were manually traced with visual delineations of infarct and remote areas based on SSRAFF2, TRAFF2, T1, T2, LGE, and ECV. The mean and standard deviation were presented for ROIs. For infarct areas, relative standard deviation (RSD) was calculated as the ratio of the standard deviation to the mean. To avoid partial volume effect, the ROIs were drawn with marginals to stay safely inside the infarct. Similarly, to avoid any transitional zone contamination, remote area was drawn as minor area on opposite to MI. Myocardia were extracted from the TRAFF2, SSRAFF2, ECV maps and LGE images using Aedes software for all subjects. Infract size was determined by dividing the scar tissue circumference by the area of Left Ventricular (LV) myocardium. To separate scar tissue from the rest of LV myocardium, a set of thresholds was determined based on intensity histogram of maps. Amount of overestimation (AOE) was obtained as (Equation 3)

based on scar tissue from RAFF maps (ARAFF,inf) and LGE images (ALGE,inf) [19]. Infarct size was calculated based on scar tissue (Ainf ) divided by LV myocardium area (ALV myo) with the formula [19] (Equation 4).

Statistical analysis
Normality and homogeneity of variance were checked by Shapiro- Wilk and Levene’s tests throughout the study. Independent t-test was used to compare the mean difference between infarct and remote measurements of each imaging method. One-way ANOVA was used to determine the significance of the differences between the mean values of RAFF2, LGE and ECV based estimates of the infarct sizes. Spearman’s rho correlation coefficients were calculated to explore the associations between the infarct sizes obtained with different methods, as well as, correlations between infract sizes and AOEs.
Results
RAFF2 delineate scar tissue
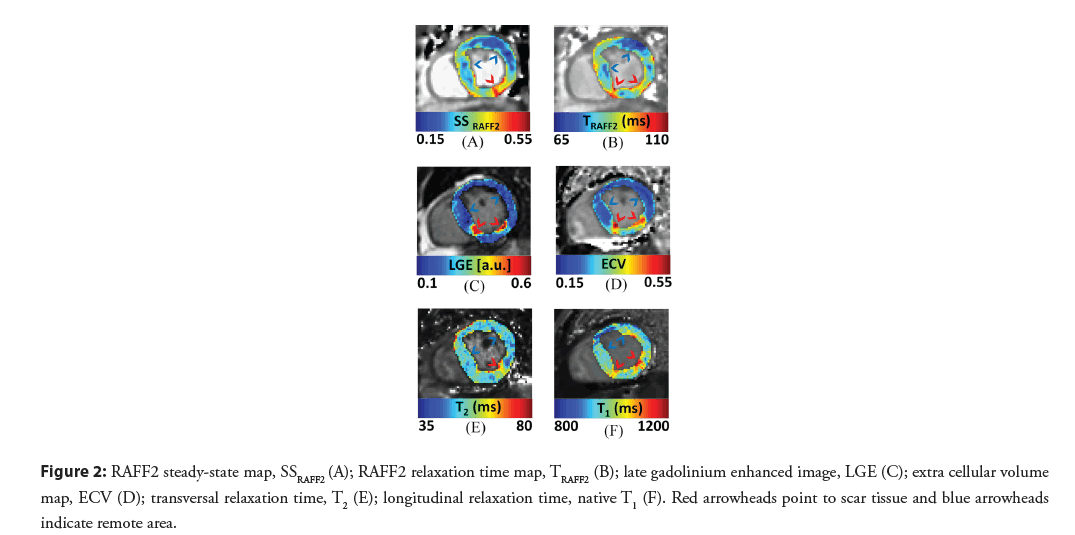
Infarct appeared as an area with increased relaxation times ( TRAFF2, T1, and T2) and increased steady state in RAFF2 (SSRAFF2) compared to remote area in patient’s myocardium (Figure 2). High contrast between the scar tissue and remote myocardium can be seen in SSRAFF2 and TRAFF2 maps (Figure 2A and 2B). Increased relaxation time and steady state values correlated visually with increased ECV (Figure 2D) and hyper-intensity in the LGE image (Figure 2C). As comparison, visually native T1 (Figure 2F) and T2 (Figure 2E) resulted in more compromised contrast between the infarct and remote areas. Significant difference was found in scar tissues compared to remote areas within all imaging methods (P<0.01, P<0.001, independent t-test). Difference between RSDs were minimized between SSRAFF2 (33%), LGE (30%) and T2 (30%) (Table 2). Measured γB1 for nominal 500 Hz was 400 ± 18 Hz inside myocardia based on B1 mapping. Off-resonance standard deviations were from 12 to 31 Hz within the myocardia.
| Infarct | Remote | Infarct RSD (%) | |
|---|---|---|---|
| SSRAFF2 | 0.39 ± 0.13 | 0.25 ± 0.08*** | 33 |
| TRAFF2[ms] | 123 ± 28 | 100 ± 12** | 23 |
| LGE [a.u.] | 0.47 ± 0.14 | 0.06 ± 0.03*** | 30 |
| ECV | 0.56 ± 0.1 | 0.23 ± 0.03*** | 18 |
| T2 [ms] | 67 ± 20 | 47 ± 3*** | 30 |
| T1 [ms] | 1070 ± 112 | 930 ± 43*** | 11 |
SSRAFF2=Steady State from RAFF2; TRAFF2=RAFF2 relaxation time; LGE=Late Gadolinium Enhanced; ECV=Extra Cellular Volume; T2=transversal relaxation time; and T1=longitudinal relaxation time
Table 2: Characteristics of infarct and remote areas given as Mean ± SD (**P<0.01, ***P<0.001, Independent t-test).
Figure 2: RAFF2 steady-state map, SSRAFF2 (A); RAFF2 relaxation time map, TRAFF2 (B); late gadolinium enhanced image, LGE (C); extra cellular volume map, ECV (D); transversal relaxation time, T2 (E); longitudinal relaxation time, native T1 (F). Red arrowheads point to scar tissue and blue arrowheads indicate remote area.
Significant association between RAFF2 and LGE regarding scar circumference
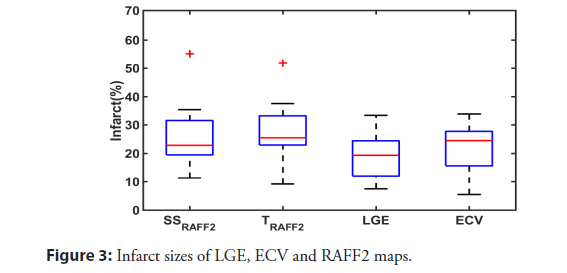
The scar tissues were determined by setting thresholds derived from myocardium histograms of SSRAFF2, TRAFF2, LGE and ECV. There was no significant difference between infarct sizes (P>0.05, one-way ANOVA), (Figure 3). Results of the Spearman correlation indicated that there were significant positive associations between SSRAFF2 and LGE, and TRAFF2 and LGE with respect to infarct size, (Table 3). The highest association was between LGE and SSRAFF2, (R=0.71, P<0.01). LGE images were used to calculate AOEs for RAFF2 maps, with the assumption that LGE represents the scar tissue. The average AOEs were 26% and 29% for SSRAFF2 and TRAFF2 respectively. There were significant negative correlations between AOEs and LGE infarct size, R=-0.73, P<0.01 “and” R=-0.59, P<0.05 between AOESSRAFF2-LGE infract size and AOE TRAFF2- LGE infract size respectively.
| SSRAFF2 | TRAFF2 | |
| ECV | 0.63** | 0.53* |
| LGE | 0.71** | 0.47* |
Table 3: Spearman’s correlation coefficients (R) between infarct sizes (*P<0.05, and **P<0.01).
Discussion
In this work, we measured the RAFF2 relaxation time and steady state in human myocardium using a clinically relevant setup. Significant elevation of RAFF2 relaxation time and steady state were observed in scar tissues. Scar tissues defined based on increased TRAFF2 and SSRAFF2 were analogous to areas with increased ECV and LGE. Area of overestimation demonstrated significant inverse association to LGE infarct size.
We found higher AOEs for TRAFF2 with respect to those reported in mice by Ylä-Herttuala, et al. [19,20]. Our results represent that AOEs for TRAFF2 were below 30 % on average. Most of the infarcts in this study were small and in small infarcts AOEs are prone for large percentage errors in ROI definitions, which may explain high obtain AOEs.
The most clinically relevant inference was that SSRAFF2 and TRAFF2 can be used for non-invasive imaging of myocardial scar and focal fibrosis in ischemic cardiomyopathy, as a non-contrast agent method. Two mainmains evidencesevidence to support this claim are the moderate AOE-value and significant correlations between the infarct sizes from SSRAFF2 and LGE, and TRAFF2 and LGE. Considering infract size, the best modest associations were found between SSRAFF2 and LGE, and TRAFF2 and LGE (Table 3). Our results in humans are in line with the previous results obtained by Ylä-Herttuala, et al. who showed that increased TRAFF2 and TRAFF4 relaxation times highlight the permanently damaged myocardial area in Left Anterior Descending artery (LAD)- ligation mouse model [19]. In that study, the increase of tissue water content due to expansion of extracellular space was given as the main pathological explanation for the contrast mechanism, which is supported by our results. Other possible explanations for elevated TRAFF2 relaxation time may be changes in proton chemical exchange between water and macromolecules after infarction [16,19,20]. In addition to infarct size, we observed a minimum difference between deviation of infarct values, between SSRAFF2, LGE and T2. Almost identical RSD values between LGE and T2 demonstrate that chronic scar tissues have reached equilibrium state and inflammation and edema have resolved [19]. T1 exhibited the lowest RSD despite significant native T1 difference between infarct and remote areas (Table 2). Our data suggest that RAFF take advantage of relaxation along a fictitious field and provide higher contrast between scar and remote myocardium when compared to native T1. These results together with high correlation between infract sizes (Table 3) show that SSRAFF2 has the potential to detect chronic infract areas accurately.
Several studies have demonstrated the effect of inversion recovery protocols on sensitivity and tissue specificity [16,26]. In original RAFF publication [16], repeating the RAFF weighted measurement with an initial inversion stabilizes and improves the steady state fitting. Similar idea was expanded to magnetization transfer ratio mapping by Mangia, et al. with improved tissue specificity [26]. We used this idea to create RAFF steady state maps. Increased steady state in the scar tissue decreases the fitted relaxation time when the steady state is taken into account in fitting and therefore decreases the relaxation time contrast between the infarct and remote areas compared to mono-exponential fitting as in [19,20]. Recently Duan, et al. demonstrated an improved contrast of MI by developing a gadolinium-free hybrid CMR technique, exploiting native T1 and magnetization transfer imaging simultaneously [27].
Further research should be undertaken to investigate the RAFF2 capability as a myocardial viability test. RAFF imaging has the potential to capture molecular dynamics and low-frequency interactions between macromolecular content and free water. Therefore, it is likely that RAFF can easily be customized to suit myocardial viability test requirements. In addition, RAFF sequence might provide a valuable practical solution for imaging early manifestations in myocardium remodeling. This would probably reduce the hospitalization. Therefore, it has the potential to improve care management quality while reducing its cost [28].
Several limitations could have influenced the results obtained. Since we were limited to single slice acquisition, slice selection was the major source of unreliability. Slightly mismatched slices would bring forth a considerable ambiguity to results. Misregistration or out-of-plane movement of the weighted images before fitting can lead to misleading image quality in RAFF2 and ECV parametric maps. Another possible source of error is the registration between RAFF2 weighted images. Due to biological differences, variation in image acquisition parameters and position changes of LV myocardium, localized stretching is needed to compensate softtissue deformation in the moving images. Given the variability of LV myocardium geometry and extracellular expansion, an affinebased registration technique is not exhaustive to describe the overall physiopathological behavior of myocardium at micrometer scales. This might severely disturb the spatial distribution of the aligned image. Furthermore, due to inconsistent delays which have been determined based on heartbeats (R-waves), and applied before preparation blocks in imaging methods, slightly different cardiac phases have been captured in some cases.
Conclusion
We have shown that chronic MI can be characterized using RAFF2 relaxation times and steady states without exogenous contrast agent. Moderate correlations derived from infract size analysis indicated that the TRAFF2 and the SSRAFF2 are feasible measures to delineate focal myocardial fibrosis with clinically acceptable SARvalues.
Acknowledgments
The authors want to thank Päivi Ronkainen and Eveliina Lammentausta for helpful practical tips.
Declaration of Conflicting Interests
The Author(s) declare(s) that there is no conflict of interest.
Funding
The study is supported by the following organizations: Academy of Finland, Finnish Foundation for Cardiovascular Research and Aarne Koskelo Foundation.
Research Ethics and Patient Consent
The study was approved (159/2018) by the Oulu University Hospital’s ethical committee, and each participant provided written informed consent. All experiments are in accordance with World Medical Association Declaration of Helsinki, ICMJE Recommendations for the Conduct, Reporting, Editing, and Publication of Scholarly Work in Medical Journals, and ICMJE Recommendations for the Protection of Research Participants.
Data
The datasets generated and analyzed during the current study are not publicly available due to the primary dataset’s inclusion of protected health information, but some data are available from the corresponding author on reasonable request. In accordance with our institutional review board policies, these datasets will remain available for 10 years following publication, after which time they will be destroyed.
References
- Richardson WJ, Clarke SA, Quinn TA, et al. Physiological implications of myocardial scar structure. Compr Physiol. 5(4): 1877-909 (2015).
- Prabhu SD, Frangogiannis NG. The biological basis for cardiac repair after myocardial infarction: From inflammation to fibrosis. Circ Res. 119(1): 91-112 (2016).
- Vogel-Claussen J, Rochitte CE, Wu KC, et al. Delayed enhancement MR imaging: Utility in myocardial assessment. Radiographics. 26(3): 795-810 (2006).
- Green JJ, Berger JS, Kramer CM, et al. Prognostic value of late gadolinium enhancement in clinical outcomes for hypertrophic cardiomyopathy. JACC Cardiovasc Imaging. 5(4): 370-7 (2012).
- Haaf P, Garg P, Messroghli DR, et al. Cardiac T1 mapping and extracellular volume (ECV) in clinical practice: A comprehensive review. J Cardiovasc Magn Reson. 18(1): 89 (2016).
- Reiter G, Reiter C, Kräuter C, et al. Cardiac magnetic resonance T1 mapping. part 1: Aspects of acquisition and evaluation. Eur J Radiol. 109: 223-34 (2018).
- Reiter U, Reiter C, Kräuter C, et al. Cardiac magnetic resonance T1 mapping. part 2: Diagnostic potential and applications. Eur J Radiol. 109: 235-47 (2018).
- Montant P, Sigovan M, Revel D, et al. MR imaging assessment of myocardial edema with T2 mapping. Diagn Interv Imaging. 96(9): 885-90 (2015).
- Mayr A, Klug G, Feistritzer HJ, et al. Myocardial edema in acute myocarditis: Relationship of T2 relaxometry and late enhancement burden by using dual-contrast turbo spin-echo MRI. Int J Cardiovasc Imaging. 33(11): 1789-94 (2017).
- Tahir E, Sinn M, Bohnen S, et al. Acute versus chronic myocardial infarction: Diagnostic accuracy of quantitative native T1 and T2 mapping versus assessment of edema on standard T2-weighted cardiovascular MR images for differentiation. Radiology. 285(1): 83-91 (2017).
- Han Y, Liimatainen T, Gorman RC, et al. Assessing myocardial disease using T(1ρ) MRI. Curr Cardiovasc Imaging Rep. 7(2): 9248 (2014).
- Musthafa HN, Dragneva G, Lottonen L, et al. Longitudinal rotating frame relaxation time measurements in infarcted mouse myocardium in vivo. Magn Reson Med. 69(5): 1389-95 (2013).
- Witschey WRT, Zsido GA, Koomalsingh K, et al. In vivo chronic myocardial infarction characterization by spin locked cardiovascular magnetic resonance. J Cardiovasc Magn Reson. 14(1): 37 (2012).
- van Oorschot JWM, El Aidi H, Jansen of Lorkeers SJ, et al. Endogenous assessment of chronic myocardial infarction with T1ρ-mapping in patients. J Cardiovasc Magn Reson. 16(1): 104 (2014).
- Stoffers RH, Madden M, Shahid M, et al. Assessment of myocardial injury after reperfused infarction by T1ρ cardiovascular magnetic resonance. J Cardiovasc Magn Reson. 19(1): 17 (2017).
- Liimatainen T, Sorce DJ, O'Connell R, et al. MRI contrast from relaxation along a fictitious field (RAFF). Magn Reson Med. 64(4): 983-94 (2010).
- Liimatainen T, Hakkarainen H, Mangia S, et al. MRI contrasts in high rank rotating frames. Magn Reson Med. 73(1): 254-62 (2015).
- Khan MA, Laakso H, Laidinen S, et al. The follow-up of progressive hypertrophic cardiomyopathy using magnetic resonance rotating frame relaxation times. NMR Biomed. 31(2): e3871 (2018).
- Yla-Herttuala E, Laidinen S, Laakso H, et al. Quantification of myocardial infarct area based on T(RAFFn) relaxation time maps-comparison with cardiovascular magnetic resonance late gadolinium enhancement, T(1ρ) and T(2) in vivo. J Cardiovasc Magn Reson. 20(1): 34 (2018).
- Ylä-Herttuala E, Mirmojarabian A, Liimatainen T. Relaxation along fictitious field with rank n (RAFFn): A promising magnetic resonance imaging method to determine myocardial infarction. Interv Cardiol. 13(1): 220-226 (2020).
- Junttila MJ, Kiviniemi AM, Lepojärvi ES, et al. Type 2 diabetes and coronary artery disease: Preserved ejection fraction and sudden cardiac death. Heart Rhythm. 15(10): 1450-6 (2018).
- Vaughan JT, Garwood M, Collins CM, et al. 7T vs. 4T: RF power, homogeneity, and signal-to-noise comparison in head images. Magn Reson Med. 46(1): 24-30 (2001).
- Xue H, Greiser A, Zuehlsdorff S, et al. Phase-sensitive inversion recovery for myocardial T1 mapping with motion correction and parametric fitting. Magn Reson Med. 69(5): 1408-20 (2013).
- Giri S, Chung Y, Merchant A, et al. T2 quantification for improved detection of myocardial edema. J Cardiovasc Magn Reson. 11(1): 56 (2009).
- Giri S, Shah S, Xue H, et al. Myocardial T₂ mapping with respiratory navigator and automatic nonrigid motion correction. Magn Reson Med. 68(5): 1570-8 (2012).
- Mangia S, Carpenter AF, Tyan AE, et al. Magnetization transfer and adiabatic T1ρ MRI reveal abnormalities in normal-appearing white matter of subjects with multiple sclerosis. Mult Scler. 20(8): 1066-73 (2014).
- Duan C, Zhu Y, Jang J, et al. Non-contrast myocardial infarct scar assessment using a hybrid native T1 and magnetization transfer imaging sequence at 1.5T. Magn Reson Med. 81(5): 3192-201 (2019).
- Ciccone MM, Aquilino A, Cortese F, et al. Feasibility and effectiveness of a disease and care management model in the primary health care system for patients with heart failure and diabetes (Project Leonardo). Vasc Health Risk Manag. 6: 297-305 (2010).
