Research Article - Clinical Investigation (2018) Volume 8, Issue 4
Predictive value of q waves in inferior leads for the diagnosis of old inferior wall myocardial infarction
- Corresponding Author:
- Zainul Abedin
Department of Internal Medicine, Texas Tech University Health Sciences Center El Paso TX, USA
E-mail: zabedin.us@gmail.com
Submitted Date: 05 September 2018; Accepted Date: 26 September 2018; Published Date: 28 September 2018
Abstract
Background: A diagnosis of an old Inferior Wall Myocardial Infarction (IMI), on a routinely performed Electrocardiogram (ECG) often leads to further consultations and imaging studies. The aim of this study was to assess the predictive value of Q waves in inferior leads, alone or in combination with repolarization abnormalities, for the diagnosis of inferior wall myocardial infarction confirmed by imaging studies.
Methods: Fifty-six patients, in whom computerized interpretation of the electrocardiogram resulted in the diagnosis of inferior wall myocardial infarction, and in whom imaging studies were also available, were included in this study. Electrocardiograms were performed using the GE MACHD 5500. Electrocardiograms were interpreted using the MUSE GE system. Echocardiograms and nuclear medicine cardiac imaging were performed and interpreted using standard equipment and techniques. S AS 9.3 software (SAS Institute, Inc., Cary, North Carolina) was used to calculate 95% exact binomial confidence intervals (CI) for the population PPVs.
Results: Computerized interpretation of the ECGs leading to the diagnosis of old inferior wall myocardial infarction when compared with inferior wall myocardial infarction confirmed by imaging studies, had a positive predictive value of 52.78%. Adding the criteria of Q waves wider than 0.04 ms, using manual interpretation of ECG, increased the positive predictive value of the test to 80%. However, the presence of ST changes and/or negative or isoelectric T waves, in the presence of diagnostic Q waves in the inferior leads, increased the positive predictive value to 92%.
Conclusion: These results suggest that the computerized interpretation of ECG results in a high rate of false positive readings of old inferior myocardial infarction. This may result in overutilization of imaging modalities. Presence of diagnostic Q waves in inferior leads, if accompanied by repolarization abnormalities, improves the accuracy of the electrocardiogram for the diagnosis of inferior wall myocardial infarction..
Keywords
Myocardial infarction, Q waves, Electrocardiogram
Introduction
Often, in the routinely performed 12-lead Electrocardiogram (ECG), the presence of Q waves in inferior leads (LII, LIII, aVF), results in computerized interpretation of Inferior Wall Myocardial Infarction (IMI) [1]. This leads to further imaging studies, additional costs and psychological stress for patients.
According to “The Third Global MI Task Force” any one of the following findings can be used for the diagnosis of prior MI: 1. Pathological Q waves with or without symptoms in the absence of non- ischemic causes; 2. Imaging evidence of a region of loss viable myocardium that is thinned and fails to contract, in the absence of a non-ischemic cause [2,3]; 3. Pathological findings of a prior MI. Diagnosis, classification, and treatment of acute myocardial infarction is based on electrocardiographic and biomarker findings [4].
Typically the width (duration) and depth (amplitude) of the Q wave is used for the diagnosis of new or previous MI [5]. Q waves are considered pathological when wider than 40 ms. in duration and have an amplitude greater than -0.2 mV. Despite general reliance on these ECG findings, there have been no recent studies to assess the predictive value of the Q waves in inferior leads for the diagnosis of inferior wall myocardial infarction.
The aim of this study was to assess the predictive value of abnormal Q-waves, and the role of concurrent repolarization abnormalities manifested by ST changes and/or negative or isoelectric T waves in inferior leads in improving accuracy of the electrocardiogram for the diagnosis of inferior myocardial infarction. To achieve this aim, ECG findings were correlated with myocardial scintigraphy, echocardiograms and/or coronary-left ventricular angiograms.
Materials and Methods
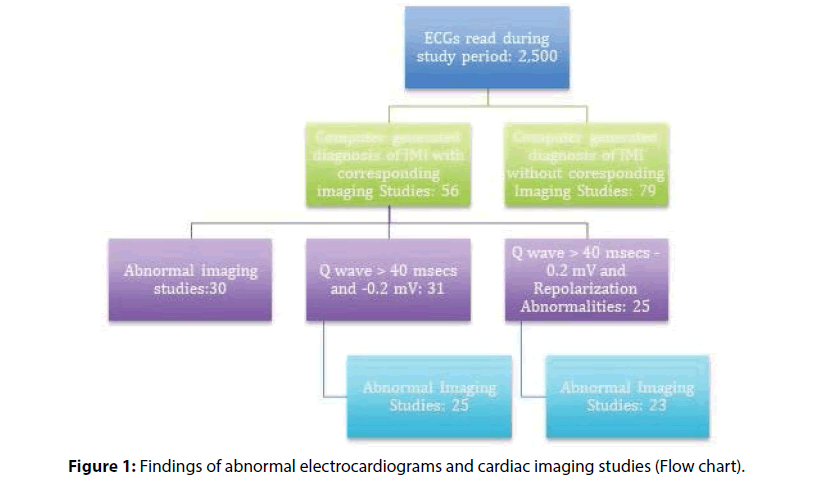
Two thousand five hundred, routinely performed, electrocardiograms were read during the study period. Out of these 135 electrocardiograms with a computer-generated diagnosis of inferior wall myocardial infarction were identified (Figure 1 and Table 1).
| ECG | Echocardiogram or Nuclear Med Study | |||
| Positive | Negative | Total | ||
| Positive | 19 | 17 | 36 | |
| Negative | 11 | 9 | 20 | |
| Total | 30 | 26 | 56 | |
Table 1: Distribution of the patients with computer-generated diagnosis of inferior wall myocardial infarction and imaging studies.
Inclusion criteria were diagnosis of inferior wall myocardial infarction on computerized analysis of a 12 lead electrocardiogram and a recently performed, echocardiogram, coronary angiograms or nuclear perfusion scan. Electrocardiograms were recorded using normal standardization by the GE MAC-HD 5500 machine. Computerized interpretations of the electrocardiograms were performed using the MUSE GE system. If a patient had multiple tracings, the most recent one was included in the analysis. Manual measurements of the width and the depth of Q waves in inferior leads (leads II, III, or aVF) were performed. A Q wave duration of >40 ms. and a depth of the Q wave of >-0.2 mV were considered suggestive of inferior wall myocardial infarction. In addition, the deviation of the ST segment from the baseline by more than 1 mm and polarity of the T wave were also analyzed.
Echocardiograms, cardiac catheterization and coronary angiography and cardiac nuclear medicine imaging were performed and interpreted using standard equipment and techniques. The most recently performed imaging studies were included. Echocardiograms were analyzed for the presence or absence of inferior wall motion abnormalities and wall thickness. Cardiac scintigraphic images were analyzed for inferior wall fixed perfusion defects and coronary angiograms were analyzed for occlusion of the right coronary artery accompanied by angiographic evidence of left ventricular inferior wall motion abnormalities.
Echocardiographic, nuclear medicine and angiographic findings were grouped as imaging studies, as number of patients in each group was small.
Fifty-six patients, who had computer-generated electrocardiographic diagnosis of inferior wall myocardial infarction and who also had imaging studies performed within one year from the index electrocardiogram, were included.
Data analysis
Demographic data were summarized and estimates of Positive Predictive Value (PPV) were calculated. SAS 9.3 software (SAS Institute, Inc., Cary, North Carolina) was used to calculate 95% exact binomial confidence intervals (CI) for the population PPVs.
Results
Electrocardiograms with computer-generated diagnosis of inferior wall myocardial infarction were identified in 135 patients (Flowchart). Diagnostic imaging studies were available in 56 patients, 30 of these patients had abnormal studies, yielding a PPV of 53.57% (95% exact CI: 39.74%-67.01%). Among the 56 patients included in this study, the average age was 63 years, and 38 (67.8%) were male.
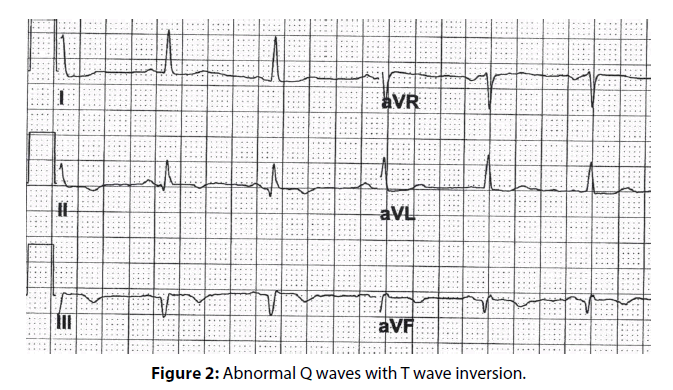
In patients, whose electrocardiograms carried a computer-generated diagnosis of inferior wall myocardial infarction, manual measurement of the width and depth of the Q wave was performed. Thirtyone electrocardiograms were identified fulfilling the abnormal Q wave criteria by the manual method. Some patients had abnormal Q waves without repolarization abnormalities (Figure 2). The diagnosis of inferior wall myocardial infarction was confirmed by positive imaging studies in 25 patients, yielding a PPV of 80.65% (95% exact CI: 62.53%- 92.55%).
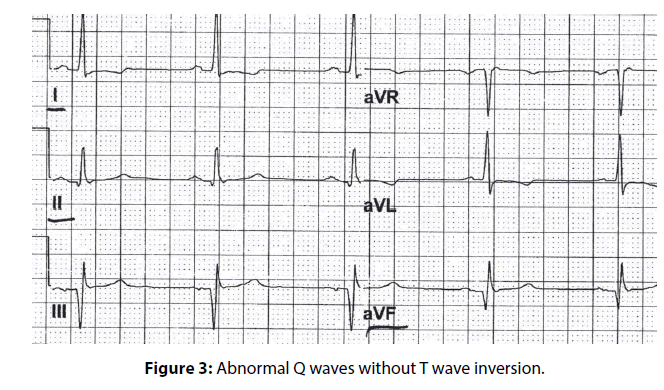
In 25 patients, repolarization abnormalities, characterized by ST segment changes or T-wave inversions accompanying the abnormal Q waves in inferior leads were noted (Figure 3). Abnormal imaging studies confirming the diagnosis of inferior wall myocardial infarction were identified in 23 patients, yielding a PPV of 92.00% (95% exact CI: 73.97- 99.02%).
Discussion
Computerized interpretation of electrocardiogram, if accompanied by the diagnosis of inferior wall myocardial infarction, may lead to further evaluation and imaging studies. Historically, there has been a poor correlation between the computer-generated electrocardiographic diagnosis of an inferior wall myocardial infarction and the confirmed diagnosis of an inferior wall myocardial infarction by imaging studies [6].
Delayed Enhancement Cardiac Magnetic Resonance (DE-CMR) is well-validated as a noninvasive reference standard for LV infarct quantification [7,8]. However, the population-based use of DE-CMR as a primary means of identifying and stratifying infarct burden would entail substantial costs and will not be feasible in many patients. In contrast, ECG is an inexpensive and readily available tool.
There appears to be a temporal reduction in the size of the Q waves after myocardial infarction [9]. A comparison between early (4 ± 0.4 days after AMI) and later follow-up (29 ± 6 days), ECG demonstrated temporal reductions in Q-wave amplitude. A 14 to 37% reduction in hyper-enhancement size has been reported between early and follow-up DE-CMR. Pathologic Q waves are related to the size of myocardial infarction. Large myocardial infarctions, involving more than 10% of the left ventricular myocardium, are often accompanied by Q waves, while small infarcts can occur without pathologic Q waves on electrocardiogram. This may explain the absence of electrocardiographic diagnosis of myocardial infarction in patients who have a history of previous myocardial infarction [7].
Stratification based on Q wave area has been shown to predict the size of myocardial infarction [10]. However, methods for calculating the area of the Q wave, such as the Universal Diagnosis of Myocardial Infarction (UDMI) criteria, appear to be rather cumbersome and therefore are limited in their usefulness [3].
Availability of information regarding a patient’s clinical history and risk factors for myocardial infarction could enhance the interpretation of the electrocardiogram; however these variables are often not available to the clinician reading the electrocardiograms.
Q waves in a 12 lead electrocardiograms have been noted in athletes, in conditions other than myocardial infarction such as hypertrophic cardiomyopathy, pulmonary disease, preexcitation utilizing posteroseptal accessory pathway, and in the second and third trimester of pregnancy [11-13].
In left ventricular hypertrophy, hypertrophic cardiomyopathy Q waves are generally present in lateral leads. Q waves of ≥40 ms. duration or >3 mm depth in the inferior and lateral leads have been considered an abnormal finding requiring evaluation to rule out hypertrophic cardiomyopathy prior to participation in competitive sports. Q waves, particularly in limb lead I, have discriminatory characteristics to distinguish Q waves in healthy athletes from patients with hypertrophic cardiomyopathy [14].
It has been speculated that the presence of Q waves, implying presence of a scar, carries an adverse prognosis, yet the positive predictive value of the presence of Q wave for myocardial infarction appears to be low, thus casting doubt on the validity of the assumption that the presence of Q waves alone carries poor prognostic implications [15,16].
Our observations suggest that there was no disproportionate increase of false positive in female patients. Although it is known that nonspecific T wave inversion in the anterior leads is common in young females ( Juvenile pattern) and there may be nonspecific T wave inversion in LIII, however presence of repolarization abnormality in the presence of significant Q waves in LII, LIII and aVF have been found to be pathological. Adding repolarization abnormalities to abnormal Q waves for the electrocardiographic diagnosis of inferior MI does not increase the false positive rate in female patients.
In the studies comparing the presence of Q wave with percent scar tissue on contrast-enhanced MR images, there was satisfactory correlation. If the infarction involved more than 17% of the left ventricular myocardium, the likelihood increases that the Q waves would be detected on the electrocardiogram [9]. However, the authors did not specifically look for the correlation between the presence of Q waves in inferior leads and the presence of scar in inferior wall.
Asch et al. noted that, even for large infarcts in the related myocardial territory, 40% of such scars were not recognized on electrocardiogram [9].
Presence or absence of Q wave cannot help in determining if the MI is transmural or nontransmural. Presence of Q wave may, however be associated with extent rather than the transmural nature of the scar [17].
In the presence of a scar from previous myocardial infarction, the Q waves may reflect the electrical neutrality of the tissue. However, in other situations the Q waves may be a reflection of orientation of electrical vector for a given lead [1].
If Q waves in a given electrocardiographic leads, are due to orientation and direction of the electrical vector, one can speculate that there may not be concomitant repolarization abnormalities in those leads. Such Q waves may be more representative of normal anatomic variation than actual pathology. While pathologic Q waves may be accompanied by repolarization abnormalities. Our results are consistent with this hypothesis. Our finding indicate that the patients with abnormal Q waves and concomitant repolarization abnormalities in the same electrocardiographic leads, tend to have abnormal imaging studies (Positive predictive value of 92%).
Conclusion
In conclusion, our findings support the hypothesis that computer interpretation of ECGs can often result in a high rate of false positive readings for inferior wall MI. We noted that the presence of abnormal Q waves, if accompanied by repolarization abnormalities in the same leads enhances the diagnostic accuracy of the electrocardiogram. Judicious use of imaging studies in this group of patients, if necessary, could eliminate, in a substantial number of patients, the false positive diagnosis of inferior wall myocardial infarction and may help reduce the economic and social costs.
References
- Moon JC, De Arenaza DP, Elkington AG, et al. The pathologic basis of q-wave and non-q-wave myocardial infarction. J Am Coll Cardiol 44: 554-560 (2004).
- Thygesen K, Alpert JS, Jaffe AS, et al. Third universal definition of myocardial infarction. Circulation 126: 2020-2035 (2012).
- Jneid H, Alam M, Virani SS, et al. Redefining myocardial infarction: what is new in the ESC/ACCF/AHA/WHF third universal definition of myocardial infarction? Methodist Debakey Cardiovasc J 9: 169-172 (2013).
- Anderson JL, Morrow DA. Acute Myocardial Infarction. N Engl J Med 376: 2053-2064 (2017).
- Marriott HJL. Practical electrocardiography. (Williams and Wilkins, 1988).
- Ramos R, Albert X, Sala J, et al. Prevalence and incidence of Q-wave unrecognized myocardial infarction in general population: Diagnostic value of the electrocardiogram. The REGICOR study. Int J Cardiol 225: 300-305 (2016).
- Florian A, Slavich M, Masci PG, et al. Electrocardiographic Q-wave ‘remodeling’ in reperfused ST-segment elevation myocardial infarction: validation study with CMR. JACC Cardiovasc Imaging 5: 1003-1013 (2012).
- Kaandorp TA, Bax JJ, Lamb HJ, et al. Which parameters on magnetic resonance imaging determine Q waves on the electrocardiogram? Am J Cardiol 95: 925-929 (2005).
- Asch FM, Shah S, Rattin C, et al. Lack of sensitivity of the electrocardiogram for detection of old myocardial infarction: A cardiac magnetic resonance imaging study. Am Heart J 152: 742-748 (2006).
- Kochav JD, Okin PM, Wilson S, et al. Usefulness of Q-wave area for threshold-based stratification of global left ventricular myocardial infarct size. Am J Cardiol 112: 174-180 (2013).
- Bent RE, Wheeler MT, Hadley D, et al. Computerized Q wave dimensions in athletes and hypertrophic cardiomyopathy patients. J Electrocardiol 48: 362-367 (2015).
- Bogossian H, Ninios I, Frommeyer G, et al. Q Wave in the Inferior Leads: There Is More Than Scar. Ann Noninvasive Electrocardiol 20: 609-611 (2015).
- Safi M, Khaheshi I, Memaryan M, et al. Q wave and ST segment elevation in inferior leads: What is the diagnosis? J Arrhythmia 31: 333-335 (2015).
- Wu E, Judd RM, Vargas JD, et al. Visualisation of presence, location, and transmural extent of healed Q-wave and non-Q-wave myocardial infarction. The Lancet 357: 21-28 (2001).
- Perino AC, Soofi M, Singh N, et al. The long-term prognostic value of the Q wave criteria for prior myocardial infarction recommended in the universal definition of myocardial infarction. J Electrocardiol 48: 798-802 (2015).
- Pourafkari L, Nader ND, Heydari N, et al. The prognostic value of a prominent Q wave in lead-avr in acute anterior wall myocardial infarction. Turk Kardiyol Dern Ars 43: 520-528 (2015).
- Taneja AK, Hayat S, Swinburn J, et al. Usefulness of Q waves on ECG for the prediction of contractile reserve after acute myocardial infarction. Int J Cardiol 145: 265-266 (2010).


