Research Article - Imaging in Medicine (2019) Volume 11, Issue 2
Intra-rater and Inter-rater Reliability of Quantitative Thigh Muscle Magnetic Resonance Imaging
- Corresponding Author:
- Dushad Ram
Department of Radiology , Division of Radiological Physics
University of Basel Hospital, Basel, Switzerland
E-mail: Jonas.schroeder@unibas.ch
Abstract
Introduction: Quantitative magnetic resonance imaging (MRI) methods to quantify muscle tissue fat content are increasingly used in the evaluation of patients with inherited neuromuscular disorders. Recently, these techniques gained importance to detect disease progression and possible treatment responses. In this study, two widely used fat quantification MRI sequences (two- and three- point Dixon) were applied to assess the reproducibility and reliability of the techniques.
Methods: For this clinical trial six healthy volunteers were scanned at a 3T clinical MRI scanner a total of six times on two different days (three times each) using two different fat quantification techniques: a 2-point Dixon (2-PD) and a 3-point Dixon (3-PD) technique. Each time axial sequences of both thighs were acquired. For all repeated scans and subjects a total of 660 muscles of the thighs were segmented with regions of interest (ROI) by two different raters. An interclass correlation coefficient (ICC) was used to compare inter-rater and intra-rater agreement of the different acquisition methods, regarding other potential biases such as repetition and day of the scans. Furthermore, the general accuracy of the different methods was obtained by calculating the fat fraction.
Results: For quantitative MRI accessing the fat fraction in the thigh muscles, Dixon sequences have been shown to be very stable in reproducibility with ICCs of >0.9 of both inter-rater and intra-rater agreement, as well as low variability. There was no significant difference between the two sequences regarding reproducibility, although 2-PD Dixon showed a little advantage when measuring small muscles.
Conclusion: In conclusion both sequences are useful for assessing fatty muscle degeneration showing a high reproducibility and reliability, with low inter- and intra-rater differences. 2-PD showed a small advantage when measuring small muscles.
Keywords
2-point dixon ■ 3-point dixon ■ muscle ■ fat fraction ■ quantitative MRI ■ muscular magnetic resonance imaging ■ 3T
Introduction
Magnetic resonance imaging (MRI) is increasingly being used in the evaluation of patients with suspected or proven inherited neuromuscular disorders. MRI provides a high soft tissue contrast allowing for excellent assessment of striated muscles concerning shape, volume (hypotrophy, hypertrophy) and tissue architecture [1,2]. Because of the lack of ionising radiation, MRI has become a valuable imaging method especially in children. Quantitative magnetic resonance imaging (qMRI) methods are nowadays widely used to quantify fatty degeneration of tissue in neuromuscular disorders [3-10]. These techniques gained importance in recent times not only to differentiate disease patterns [11,12] but also to detect individual disease progression and possible treatment responses [13,14].
In studies involving neuromuscular disorders, MR-imaging based fat fractions are used to monitor changes of fatty muscle degeneration over time, for which stable and reproducible MR-sequences are an essential requirement. Several water-fat separation techniques have been developed based on spin echo and gradient echo sequences and have been successfully applied to various organs [15,16]. In this study two frequently used sequences were applied: a 2-point Dixon (2-PD) method and a 3-point Dixon (3-PD) method to determine the amount of fat infiltration in different muscles of the thigh in healthy volunteers. The aim of this analysis was, to assess the reproducibility and reliability of the techniques regarding different potential biases, such as patient repositioning in the scanner, repetition of the examination at another timepoint, and drawing the selected regions of interest (ROI) by different examiners.
Methods
■Subjects
A total of six healthy volunteers were enrolled into the study (age range 23-28 years, mean 24.8 years; three males, three females). Inclusion criteria were suitability to perform an MRI scan and absence of a neuromuscular disease. Written informed consent was obtained from all patients. The study procedures conformed to the Declaration of Helsinki and the study protocols were approved by the local ethics committee.
Examinations were repeated three times on the same day, with short breaks in-between while subjects were standing up between scans. Volunteers were examined a second time after 26 (three subjects), 37 (one subject) and 114 (one subject) days. There was one dropout for the second examination day.
■MR imaging
Examinations were performed on a 3 Tesla (T) scanner (Magnetom Verio, Siemens Healthcare, Erlangen, Germany) with a 16-element phased array and a spine coil. Localization comprised a series of scout images in three orthogonal directions as well as scout images through the knee joint space. After localization of the knee joint (central layer, medial compartment, right knee), axial slices were centered at 20 cm distance cranial of the knee joint space. A field of view of 228 × 384 mm and a 228 × 384 matrix was used yielding a 1 mm in plane resolution with 3 mm slice thickness. For both sequences water-only (w) and fat-only (f ) images were calculated.
■2-point dixon acquisition
A gradient echo sequence with two different echo times for in-phase and opposed-phase imaging was acquired (three-dimensional (3D)), 30 slices, repetition time (TR)=20ms, echo time (TE)1=2.45ms, TE2=3.675ms, flip angle=15°, band width of 407Hz/voxel. Two saturation bands were placed above the acquired volume to avoid inflow artifacts from arterial blood.
■3-point dixon acquisition
Afterwards a turbo spin echo (TSE) sequence with three different echo times was acquired (2D), 30 slices, TR=5000ms, TE1=15ms, TE2=17.4ms, TE3=19.8ms, flip angle=150°, band width of 296Hz/voxel.
■Data analysis
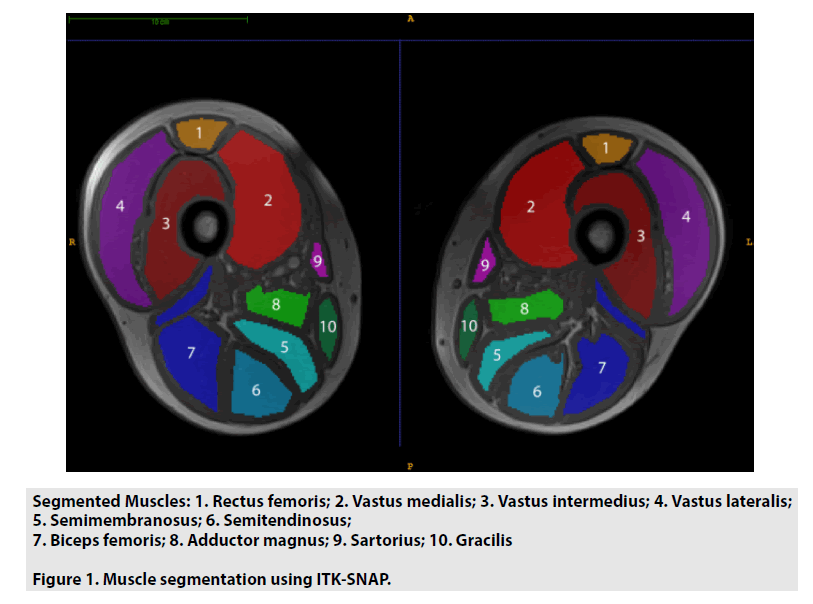
After image acquisition regions of interest (ROI) were drawn by two medical students, without prior experience in radiology or the segmentation software that was used (ITKSNAP version 2.4 and higher [17]). For each repetition cycle and for all subjects, an in-phase sequence of the 2-point Dixon sequence, with high resolution and contrast, was used to draw ROIs over the different muscles of the left and right thigh (rectus femoris, vastus medialis, vastus lateralis, vastus intermedius, biceps femoris, semitendinosus, semimembranosus, adductor magnus, sartorius, and gracilis). For each muscle ROIs were drawn on 3 slices (slice 7,15 and 23), as shown in FIGURE 1. Instructions for the image segmentation most importantly included to hold adequate distance to the muscle fascias avoiding chemical shift artifacts of the fascia itself as well as intermuscular soft tissue and subcutaneous fat. Segmentations were supervised by a user experienced in selecting ROIs of the thigh muscles with this segmentation software [18,19].
Since each subject was scanned six times (except one volunteer who was only scanned three times), involving both thighs, a total of 660 muscles were selected. For each voxel, which was within the selected ROIs, the fat fraction was calculated as: f/(f+w), with a protocol written in Matlab by MathWorks [20]. Statistical analysis was performed by the statistics department of the University of Basel, using R [21]. The mean fat fractions for each muscle, as well as for muscles’ groups and all muscles together, were calculated with the corresponding standard deviation of each muscle. An interclass correlation coefficient was calculated to compare inter-rater agreement, intra-rater agreement, and reproducibility of the different acquisition methods, as well as accuracy of the different methods for the fat fractions. The ICC is presented together with its 95% basic bootstrap confidence interval (CI) estimated using 99 bootstrap replicates. The ICC was calculated based on analysis of variance. Therefore, a mixed model was fitted to the data with rater, subject ID, day and repetition (nested inside day) as random factors and a fixed intercept was fitted using. The ICC was estimated by dividing the variation which was due to the rater-to-rater difference through the total variance seen in the data. The values range from 0 to 1 and can be interpreted as the proportion of the variation of the data. For the inter-rater agreement it can be attributed to rater-to-rater variability rather than to different ratings at different repetitions or raters. An ICC of 1 indicates that all differences in the ratings are due to differences in the volunteers and that the method is completely reproducible. For the intra-rater agreement the proportion of the total variability in the measurements that cannot be attributed to the subject (rater) was assessed. Therefore, it can be interpreted as how much the ratings vary due to other biases, such as different repetitions and different acquisition days. To assess the relevance of the extent of the ROIs between the two raters, for each muscle the association between the ICC and mean number of voxels (over all subjects, all repetitions and both raters) was assessed using Spearman correlation.
Results
■Fat fraction
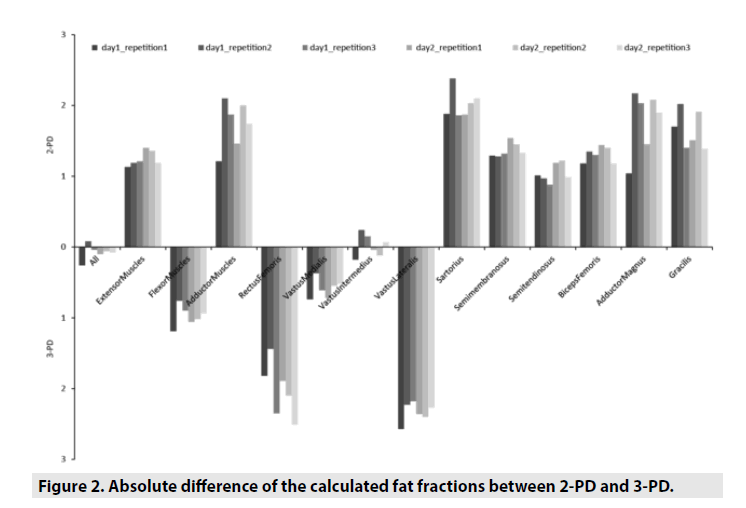
Healthy volunteers showed relatively low calculated fat fractions in all muscles with a mean of 6.49% for both sequences, while the sartorius muscle showed the highest fat fraction of 9.94%, or 10.18% in the 2-PD Dixon sequence respectively. Between different repetitions of the examinations and between the results of the two different raters, there was a low variation for most individuals (<2 SD (standard deviation); except for the adductor magnus, semimembranosus, and sartorius muscles (<3 SD)). In TABLE 1 the calculated measurements of the fat fraction are presented for each muscle, each rater, and each sequence. The presented results are averaged for all examinations and all volunteers. In TABLE 2 the calculated measurements of the fat fractions are presented for each repetition during the two different acquisitions days. For most of the muscles the calculated fat fraction was higher in 2-PD, except for the flexor muscles, e.g. vastus medialis, vastus lateralis and rectus femoris, the fat fractions were higher in 3-PD, as shown in FIGURE 2, where the absolute difference of the fat fractions between 2-PD and 3-PD is demonstrated.
| Rater | |||||||||||||||
|---|---|---|---|---|---|---|---|---|---|---|---|---|---|---|---|
| Rater1 | Rater2 | Rater1 + Rater2 | |||||||||||||
| Sequence | Sequence | Sequence | |||||||||||||
| 2-PD | 3-PD | 2-PD | 3-PD | 2-PD | 3-PD | ||||||||||
| Muscle | mean | sd | mean | sd | mean | sd | mean | s | mean | sd | mean | sd | |||
| All | 6.56 | 1.21 | 6.65 | 1.16 | 6.41 | 1.19 | 6.48 | 1.15 | 6.49 | 1.19 | 6.56 | 1.15 | |||
| FlexorMuscles | 5.62 | 0.91 | 6.63 | 0.99 | 5.53 | 0.85 | 6.47 | 1.00 | 5.58 | 0.87 | 6.55 | 0.99 | |||
| ExtensorMuscles | 8.08 | 1.83 | 6.79 | 1.49 | 7.79 | 1.75 | 6.60 | 1.43 | 7.93 | 1.78 | 6.69 | 1.45 | |||
| AdductorMuscles | 8.25 | 2.01 | 6.41 | 1.85 | 7.81 | 1.61 | 6.19 | 1.71 | 8.03 | 1.82 | 6.30 | 1.77 | |||
| VastusMedialis | 5.54 | 0.91 | 6.11 | 1.18 | 5.39 | 0.80 | 5.99 | 1.13 | 5.47 | 0.85 | 6.05 | 1.15 | |||
| VastusLateralis | 5.18 | 0.85 | 7.57 | 1.04 | 5.06 | 0.80 | 7.34 | 1.11 | 5.12 | 0.82 | 7.46 | 1.07 | |||
| VastusIntermedius | 5.96 | 0.85 | 5.96 | 1.16 | 5.91 | 0.85 | 5.86 | 1.17 | 5.93 | 0.84 | 5.91 | 1.16 | |||
| BicepsFemoris | 8.29 | 1.70 | 6.95 | 1.52 | 8.03 | 1.66 | 6.75 | 1.51 | 8.16 | 1.67 | 6.85 | 1.51 | |||
| AdductorMagnus | 8.78 | 2.63 | 6.81 | 2.33 | 8.32 | 2.28 | 6.75 | 2.36 | 8.55 | 2.45 | 6.78 | 2.33 | |||
| Semimembranosus | 8.46 | 2.24 | 7.04 | 1.67 | 8.13 | 2.15 | 6.83 | 1.70 | 8.30 | 2.19 | 6.94 | 1.67 | |||
| Semitendinosus | 7.22 | 1.68 | 6.15 | 1.18 | 6.91 | 1.53 | 5.92 | 1.00 | 7.07 | 1.60 | 6.03 | 1.09 | |||
| Rectus Femoris | 4.56 | 1.35 | 6.66 | 1.68 | 4.60 | 1.27 | 6.51 | 1.67 | 4.58 | 1.30 | 6.58 | 1.66 | |||
| Sartorius | 10.18 | 2.77 | 8.34 | 2.22 | 9.69 | 2.22 | 7.49 | 1.63 | 9.94 | 2.50 | 7.92 | 1.98 | |||
| Gracilis | 6.73 | 1.05 | 5.29 | 0.99 | 6.70 | 0.99 | 4.82 | 0.79 | 6.72 | 1.01 | 5.06 | 0.92 | |||
Table 1. Summary statistics of fat fraction for each muscle by rater.
| Repetitions | |||||||||||||
|---|---|---|---|---|---|---|---|---|---|---|---|---|---|
| Repetition 1 | Repetition 2 | Repetition 3 | |||||||||||
| Sequence | Sequence | Sequence | |||||||||||
| 2-PD | 3-PD | 2-PD | 3- PD | 2- PD | 3- PD | ||||||||
| Day | Muscle | mean | Sd | Mean | sd | mean | Sd | Mean | sd | mean | Sd | Mean | sd |
| Day1 | All | 6.46 | 1.02 | 6.72 | 1.01 | 6.61 | 1.09 | 6.53 | 1.21 | 6.69 | 1.10 | 6.73 | 0.99 |
| FlexorMuscles | 5.56 | 0.73 | 6.75 | 0.83 | 5.73 | 0.75 | 6.49 | 1.09 | 5.75 | 0.79 | 6.65 | 0.86 | |
| ExtensorMuscles | 7.89 | 1.55 | 6.76 | 1.23 | 7.96 | 1.74 | 6.77 | 1.43 | 8.22 | 1.68 | 7.01 | 1.26 | |
| AdductorMuscles | 7.84 | 1.60 | 6.63 | 2.12 | 8.30 | 1.81 | 6.20 | 1.48 | 8.34 | 1.69 | 6.47 | 1.42 | |
| VastusMedialis | 5.41 | 0.73 | 6.15 | 1.08 | 5.63 | 0.81 | 6.00 | 1.20 | 5.63 | 0.77 | 6.24 | 1.14 | |
| VastusLateralis | 5.16 | 0.78 | 7.73 | 0.82 | 5.22 | 0.63 | 7.45 | 1.23 | 5.28 | 0.66 | 7.46 | 0.90 | |
| VastusIntermedius | 5.93 | 0.70 | 6.11 | 0.94 | 6.10 | 0.74 | 5.86 | 1.30 | 6.12 | 0.81 | 5.97 | 1.04 | |
| BicepsFemoris | 8.16 | 1.52 | 6.98 | 1.17 | 8.19 | 1.60 | 6.84 | 1.59 | 8.46 | 1.51 | 7.16 | 1.40 | |
| AdductorMagnus | 8.15 | 2.05 | 7.11 | 2.77 | 8.86 | 2.50 | 6.69 | 2.04 | 8.98 | 2.32 | 6.95 | 1.89 | |
| Semimembranosus | 8.17 | 1.70 | 6.88 | 1.51 | 8.35 | 2.12 | 7.07 | 1.65 | 8.60 | 2.04 | 7.28 | 1.48 | |
| Semitendinosus | 7.17 | 1.66 | 6.16 | 0.95 | 7.10 | 1.52 | 6.13 | 0.92 | 7.06 | 1.58 | 6.18 | 0.79 | |
| RectusFemoris | 4.47 | 0.93 | 6.29 | 1.74 | 4.92 | 1.34 | 6.36 | 1.86 | 4.51 | 1.22 | 6.86 | 1.87 | |
| Sartorius | 9.98 | 2.56 | 8.10 | 1.93 | 10.20 | 2.17 | 7.82 | 1.83 | 9.97 | 2.54 | 8.11 | 1.79 | |
| Gracilis | 6.86 | 1.03 | 5.16 | 0.87 | 6.89 | 1.02 | 4.87 | 0.79 | 6.63 | 0.96 | 5.23 | 0.76 | |
| Day2 | All | 6.26 | 1.51 | 6.36 | 1.29 | 6.39 | 1.34 | 6.45 | 1.41 | 6.45 | 1.36 | 6.53 | 1.20 |
| FlexorMuscles | 5.36 | 1.12 | 6.42 | 1.08 | 5.48 | 0.99 | 6.50 | 1.25 | 5.51 | 1.01 | 6.45 | 1.05 | |
| ExtensorMuscles | 7.68 | 2.19 | 6.28 | 1.70 | 7.86 | 1.98 | 6.50 | 1.81 | 7.94 | 1.98 | 6.75 | 1.56 | |
| AdductorMuscles | 7.69 | 2.20 | 6.23 | 2.42 | 7.86 | 2.04 | 5.86 | 1.72 | 8.09 | 1.99 | 6.35 | 1.65 | |
| VastusMedialis | 5.26 | 1.05 | 5.98 | 1.26 | 5.38 | 0.97 | 5.93 | 1.23 | 5.43 | 0.94 | 5.95 | 1.22 | |
| VastusLateralis | 4.91 | 1.05 | 7.27 | 1.07 | 5.05 | 0.88 | 7.45 | 1.50 | 5.05 | 1.06 | 7.32 | 1.06 | |
| VastusIntermedius | 5.68 | 1.03 | 5.72 | 1.24 | 5.81 | 0.97 | 5.93 | 1.46 | 5.90 | 0.95 | 5.83 | 1.18 | |
| BicepsFemoris | 7.91 | 2.07 | 6.47 | 1.71 | 8.11 | 1.84 | 6.71 | 1.88 | 8.06 | 1.88 | 6.88 | 1.58 | |
| AdductorMagnus | 8.18 | 2.86 | 6.73 | 3.17 | 8.39 | 2.78 | 6.31 | 2.31 | 8.70 | 2.71 | 6.80 | 2.11 | |
| Semimembranosus | 8.06 | 2.68 | 6.52 | 1.89 | 8.19 | 2.55 | 6.74 | 2.07 | 8.37 | 2.55 | 7.04 | 1.78 | |
| Semitendinosus | 6.83 | 1.84 | 5.64 | 1.33 | 7.03 | 1.67 | 5.81 | 1.22 | 7.19 | 1.74 | 6.20 | 1.45 | |
| RectusFemoris | 4.44 | 1.57 | 6.33 | 1.52 | 4.67 | 1.62 | 6.77 | 1.36 | 4.42 | 1.35 | 6.93 | 1.77 | |
| Sartorius | 9.77 | 2.89 | 7.90 | 2.35 | 9.72 | 2.74 | 7.69 | 2.22 | 9.92 | 2.75 | 7.82 | 2.27 | |
| Gracilis | 6.51 | 1.19 | 5.00 | 1.18 | 6.74 | 1.06 | 4.83 | 0.97 | 6.62 | 1.00 | 5.23 | 1.11 | |
Table 2. Summary statistics of fat fraction for each muscle by repetition.
■Inter-rater agreement
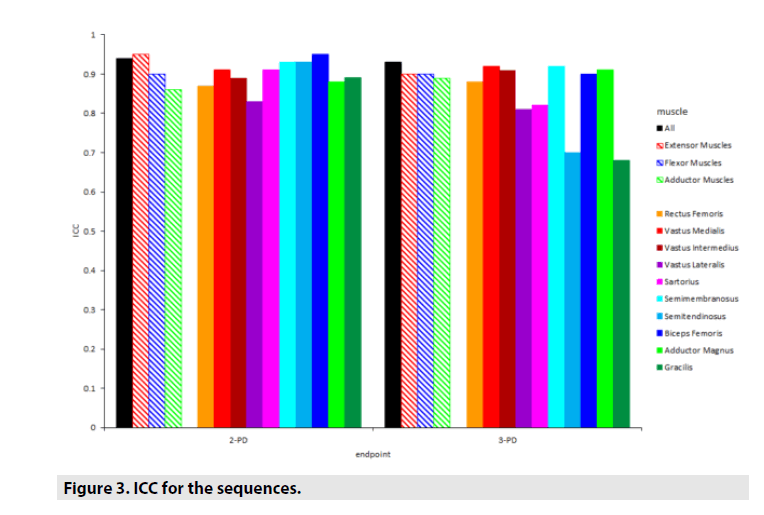
In general, the ICC was high for both sequences. For all different muscles ICC were between 0.89-0.95 (all muscles: 0.94 [0.91;0.97]) for 2-PD and 0.68-0.93 (all muscles: 0.93 [0.89;0.96]) for 3-PD. However, in muscles with a small cross sectional area (e.g. sartorius or gracilis) 2-PD showed a better ICC compared to 3-PD. When comparing ICCs of single muscles with a Wilcoxon signed rank test, the difference between the two sequences was not significant (p=0.28).
In TABLE 3 the inter-rater agreement for each muscle and sequence (quantified as interclasscorrelation, ICC) is presented, while FIGURE 3 shows the results graphically.
| PD2 | PD3 | |
|---|---|---|
| All | 0.94 [0.91; 0.97] | 0.93 [0.89; 0.96] |
| Flexor Muscles | 0.90 [0.86; 0.95] | 0.90 [0.86; 0.94] |
| Extensor Muscles | 0.95 [0.92; 0.99] | 0.90 [0.87; 0.94] |
| Adductor Muscles | 0.86 [0.80; 1.00] | 0.89 [0.85; 0.93] |
| Vastus Medialis | 0.91 [0.85;0.97] | 0.92 [0.89; 0.95] |
| Vastus Lateralis | 0.83 [0.75; 0.90] | 0.81 [0.74; 0.89] |
| Vastus Intermedius | 0.89 [0.85; 0.93] | 0.91 [0.88; 0.95] |
| Biceps Femoris | 0.95 [0.93; 0.97] | 0.90 [0.87;0.93] |
| Adductor Magnus | 0.88 [0.80; 1.01] | 0.91 [0.87; 0.95] |
| Semimembranosus | 0.93 [0.89; 1.01] | 0.92 [0.90; 0.96] |
| Semitendinosus | 0.93 [0.91;0.96] | 0.70 [0.59; 0.81] |
| Rectus Femoris | 0.87 [0.78; 1.04] | 0.88 [0.83; 0.94] |
| Sartorius | 0.91 [0.87; 0.95] | 0.82 [0.76; 0.89] |
| Gracilis | 0.89 [0.86; 0.94] | 0.68 [0.57; 0.80] |
Table 3. Inter-rater agreement.
■Intra-rater agreement
In general, the intra-rater agreement was similar to the inter-rater agreement, with very good ICC values for all different muscles being between 0.83-0.96 (all muscles: 0.94 [0.92;0.98]) for 2-PD and 0.72-0.92 (all muscles: 0.93 [0.91;0.95]) for 3-PD. There were no outliers in variation for the 2-PD sequence, while there were little lower ICCs in the semitendinosus and gracilis muscles for the 3-PD sequence. Again, there was no significant difference between the two sequences when comparing the ICCs of all single muscles (excluding muscle groups) with a Wilcoxon signed rank test (p=0.23). In TABLE 4 the intra-rater agreement (quantified as intraclass-correlation, ICC) is presented.
| PD2 | PD3 | |
|---|---|---|
| All | 0.94 [0.92; 0.98] | 0.93 [0.91; 0.95] |
| Flexor Muscles | 0.90 [0.86; 0.96] | 0.91 [0.87; 0.95] |
| Extensor Muscles | 0.96 [0.94; 0.98] | 0.91 [0.87; 0.94] |
| Adductor Muscles | 0.89 [0.83; 0.97] | 0.89 [0.84; 0.92] |
| Vastus Medialis | 0.92 [0.87;0.97] | 0.92 [0.89; 0.96] |
| sVastus Lateralis | 0.83 [0.75; 0.90] | 0.83 [0.76; 0.87] |
| Vastus Intermedius | 0.89 [0.84; 0.92] | 0.91 [0.87; 0.96] |
| Biceps Femoris | 0.96 [0.94; 0.97] | 0.91 [0.86;0.94] |
| Adductor Magnus | 0.89 [0.82; 1.00] | 0.91 [0.88; 0.93] |
| Semimembranosus | 0.94 [0.90; 0.99] | 0.93 [0.89; 0.94] |
| Semitendinosus | 0.95 [0.93;0.97] | 0.72 [0.57; 0.85] |
| Rectus Femoris | 0.87 [0.78; 1.03] | 0.88 [0.83; 0.93] |
| Sartorius | 0.93 [0.90; 0.95] | 0.90 [0.86; 0.93] |
| Gracilis | 0.89 [0.85; 0.93] | 0.79 [0.70; 0.86] |
Table 4. Inter-rater agreement.
■Predictors of low Inter-rater agreement in standard deviation – number of voxels
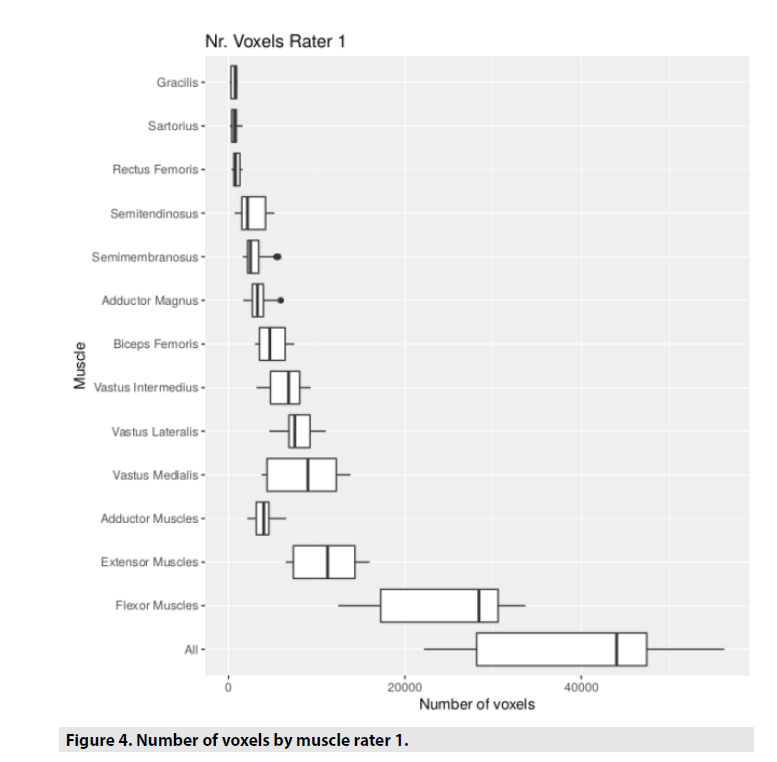
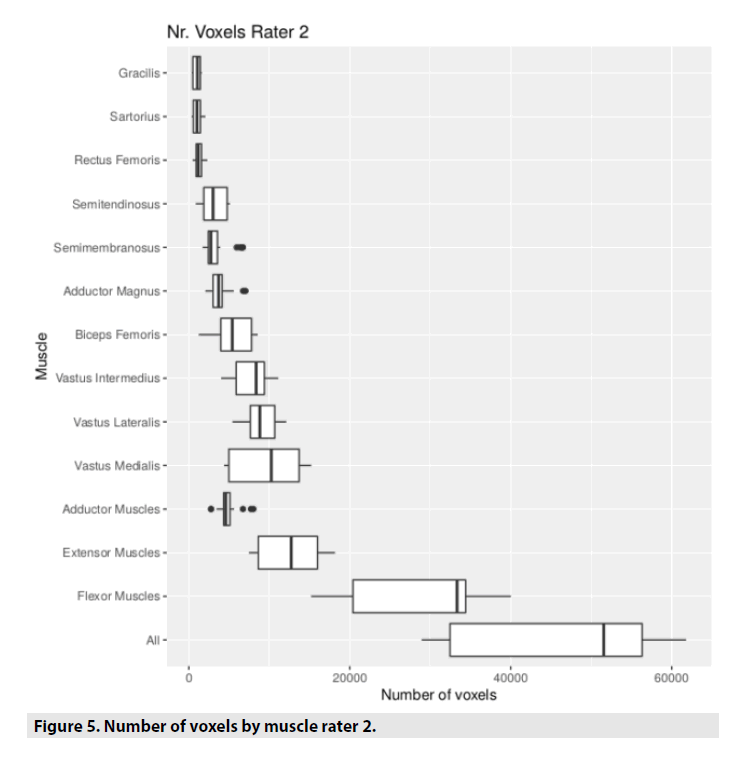
In addition to the fat fraction the Matlab output includes standard deviation of the fat fraction and number of voxels. Therefore, it was assessed how similar the number of voxels were and if it was associated with the reproducibility of the fat fraction estimates. The association between number of voxels and ICC using spearman correlation was low for both sequences (0.23 for 2-PD and 0.60 for 3-PD), meaning no relevant influence on the inter-rater agreement or on the reproducibility of the method. The number of voxels were comparable for both raters, being a little bit lower for rater 1 (38833.7 [34949.6;42717.7]) than for rater 2 (45179.7 [40894.4;49464.9]). In TABLE 5, the mean and the 95% confidence interval (CI) of the voxel numbers is presented for both raters. In FIGURES 4 and 5 the same result is presented graphically.
| Muscle | Rater1 | Rater2 |
|---|---|---|
| All | 38833.7 CI=[34949.6; 42717.7] | 45179.7 CI=[40894.4; 49464.9] |
| Extensor Muscles | 10642.1CI=[9417.0;11867.2] | 12289.3 CI=[10913.8; 13664.9] |
| Flexor Muscles | 24148.9 CI=[21531.3; 26766.5] | 28125.9 CI=[25148.7; 31103.1] |
| Adductor Muscles | 4042.7 CI=[3639.9; 4445.5] | 4764.5 CI=[4378.2; 5150.7] |
| Vastus Medialis | 8435.0 CI=[7104.2; 9765.7] | 9374.7 CI=[7927.2; 10822.1] |
| Vastus Lateralis | 7687.7 CI=[7031.1; 8344.3] | 8778.4 CI=[8062.6; 9494.1] |
| Vastus Intermedius | 6350.8CI=[5669.1;7032.5] | 7648.3 CI=[6888.7; 8407.9] |
| Rectus Femoris | 950.3 CI=[815.0; 1085.6] | 1282.4 CI=[1108.0; 1456.7] |
| Sartorius | 725.1 CI=[566.1; 884.2] | 1042.2 CI=[848.9; 1235.6] |
| Gracilis | 634.2 CI=[520.5; 747.9] | 988.1 CI=[827.0; 1149.2] |
| Adductor Magnus | 3408.5CI=[3029.8;3787.2] | 3776.4 CI=[3390.4; 4162.4] |
| Semimembranosus | 2998.1 CI=[2561.6; 3434.5] | 3486.5 CI=[2909.3; 4063.7] |
| Semitendinosus | 2711.0 CI=[2209.5; 3212.5] | 3120.7 CI=[2615.5; 3626.0] |
| Biceps Femoris | 4933.0 CI=[4402.7; 5463.4] | 5682.1 CI=[5010.9; 6353.3] |
Table 5. Number of voxels for each muscle presented for both raters.
Discussion
We examined two different common MRI Dixon techniques for quantification of the thigh muscle fat fraction and could show that both perform reliably. Both sequences were very stable in reproducibility including the potential bias of hand selected ROIs over the muscles. Both showed very high ICCs in inter- and intra-rater agreement as well as low variation in the calculated fat fractions. Regarding the reproducibility there was no significant difference between the two sequences, although the 2-PD Dixon sequence showed a small advantage when measuring small muscles, having higher ICCs of inter-rater agreement.
Overall the calculated fat fractions of all muscles were relatively low with a mean of 6.49%, although being a little above the average of previously published values, for example being between 2.3%-5.5% [5]. This is most likely due to the parameters used during the acquisition and probably varies between different scanners and protocols. In general Dixon sequences tend to produce higher values in muscles with very low fat content. In this study the 2-PD Dixon sequence showed higher values in comparison to the 3-PD Dixon sequence. Only for the flexor muscles the 3-PD sequence showed higher values. This is most likely due to an anteriorly located artifact during the acquisition, that was constantly reproduced in all repetitions. As shown in TABLE 2, there was only little variation between different repetitions for both sequences. In both sequences in mostly smaller muscles there was a wider spread of the fat fraction values between the two raters. In case of the gracilis this might be the case, because it has a small diameter and therefore inhomogenities of fat and muscle cells result in a greater difference when including or excluding some voxels. In the semitendinosus and vastus lateralis there was a rather poorer inter-rater agreement too. This could be the result of inhomogenities of fat and muscle cells in the junction zone to the semimembranosus or vastus intermedius respectively. In the semitendinosus there was also a rather higher spread of the number of voxels being included, for a relatively small muscle, as shown in FIGURES 4 and 5. In all scans, 3-point Dixon sequences were performed after the 2-point Dixon sequence. This could introduce a bias towards better repeatability of the latter, especially for small muscles due to patient movement. As we did not see any movement artifacts in the sequences themselves, we deem this to be highly improbable.
In this study the fat fraction was rated by two raters, showing a very high inter-rater agreement. As these readers had no initial experience with the ROI selecting software, meaning no high skill or experience level is required to assess the fat fractions. In previous trials, muscle segmentation was performed by radiologists experienced in neuromuscular imaging [9,10,11,15,16]. We did, however, notice, that trained non-specialists could also perform those tasks at a similar level, freeing the experienced readers.
There was some variation regarding the calculated fat fractions between the two raters and between the two repetition days. Since the ICCs for the inter- and intra-rater agreement showed very good results, we don’t assume this being a clinically significant confounder.
In conclusion both sequences are useful for assessing fatty muscle degeneration showing a high reproducibility and reliability, as well as low inter- and intra-rater differences. 2-PD showed a small advantage when evaluating small muscles.
References
- Mercuri E, Jungbluth H, Muntoni F et al. Muscle imaging in clinical practice: diagnostic value of muscle magnetic resonance imaging in inherited neuromuscular disorders. Curr. Opin. Neurol. 18: 526-537, (2017).
- Mercuri E, Pichiecchio A, Allsop J et al. Muscle MRI in inherited neuromuscular disorders: past, present, and future. J. Magn. Reson. Imaging. 25: 433-440, (2007).
- Burakiewicz J, Sinclair CDJ, Fischer D et al. Quantifying fat replacement of muscle by quantitative MRI in muscular dystrophy. J. Neurol. 264: 2053–2067, (2017).
- Willis T, Hollingsworth K, Coombs A et al. Quantitative Muscle MRI as an Assessment Tool for Monitoring Disease Progression in LGMD2I: A Multicentre Longitudinal Study. PLoS. ONE. 8: 1-7, (2013).
- Willis T, Hollingsworth K, Coombs A et al. Quantitative Magnetic Resonance Imaging in Limb-Girdle Muscular Dystrophy 2I: A Multinational Cross-Sectional Study. PloS. ONE. 9: 1-9, (2014).
- Gaeta M, Scribano E, Mileto A et al. Muscle fat fraction in neuromuscular disorders: dual-echo dual-flip-angle spoiled gradient-recalled MR imaging technique for quantification – a feasibility study. Radiology. 259: 487-494, (2011).
- Mercuri E, Pichiecchio A, Allsop J et al. Muscle MRI in inherited neuromuscular disorders: past, present, and future. J. Magn. Reson. Imaging. 25: 433-440, (2007).
- Glover GH, Schneider E. Three-point Dixon technique for true water/fat decomposition with B0 inhomogeneity correction. Magn. Reson. Med. 18: 371-383, (1991).
- Fischmann A, Hafner P, Fasler S et al. Quantitative MRI can detect subclinical disease progression in muscular dystrophy. J. Neurol .259: 1648-1654, (2012).
- Dixon WT. Simple proton spectroscopic imaging. Radiology. 153: 189-194, (1984).
- Fischer D, Walter MC, Kesper K et al. Diagnostic value of muscle MRI in differentiating LGMD2I from other LGMDs. J. Neurol. 252: 538-547, (2005).
- Wattjes MP, Kley RA, Fischer D. Neuromuscular imaging in inherited muscle diseases. Eur. Radiol. 20: 2447-2460, (2010).
- Fischmann A, Hafner P, Fasler S et al. Qantitative MRI can detect subclinical disease progression in muscular dystrophy. J. Neurol. 259: 1648-1654, (2012).
- Bonati U, Schmid M, Hafner P et al. Longitudinal 2-point Dixon muscle MRI in Becker muscular dystrophy. Muscle. Nerve. 51: 918-921, (2015).
- Rybicki FJ, Chung T, Reid J et al. Fast three-point dixon MR imaging using low-resolution images for phase correction: a comparison with chemical shift selective fat suppression for pediatric musculoskeletal imaging. Am. J. Roentgenol. 177: 1019-1023, (2001).
- Kellman P, Hernando D, Shah S et al. Multiecho dixon fat and water separaion method for detecting fibrofatty infiltration in the myocardium. Magnetic resonance in medicine: official journal of the Society of Magnetic Resonance in Medicine/Society of Magnetic Resonance in Medicine. 61: 215-221, (2009).
- Yushkevich. Core Team. 2018: ITK-SNAP version 2.4 and higher: Paul A. University of Pennsylvania, USA.
- Bonati U, Hafner P, Schädelin S et al. Quantitative muscle MRI: A powerful surrogate outcome measure in Duchenne muscular dystrophy. Neuromuscul. Disord. 679-685, (2015).
- Schmidt S, Hafner P, Klein A et al. Timed function tests, motor function measure, and quantitative thigh muscle MRI in ambulant children with Duchenne muscular dystrophy: A cross-sectional analysis. Neuromuscul. Disord. 28: 16-23, (2018).
- MatLab by MathWorks, 3 Apple Hill Drive, Natick, Massachusetts 01760 USA.
- Core Team. 2018: R: A Language and Environment for Statistical Computing. R Foundation for Statistical Computing, Vienna, Austria.
