Short Communication - Diabetes Management (2021)
Identification of diabetic retinopathy using deep learning algorithm and blood vessel extraction
- Corresponding Author:
- Ananthi
Department of Electronics and Communication Engineering, Thiagarajar College of Engineering, Madurai, India
E-mail: gananthi@tce.edu
Abstract
Retinal blood vessel and retinal vessel tree segmentation are significant components in disease identification systems. Diabetic retinopathy is found using identifying hemorrhages in blood vessels. The debauched vessel segmentation helps in an image segmentation process to improve the accuracy of the system. This paper uses Edge Enhancement and Edge Detection method for blood vessel extraction. It covers drusen, exudates, vessel contrasts and artifacts. After extracting the blood vessel, the dataset is fed into CNN network called EyeNet for identifying DR infected images. It is observed that EyeNet leads to Sensitivity of about 90.02%, Specificity of about 98.77% and Accuracy of about 96.08%.
Keywords
■ retinal blood vessel ■ detection ■ retinal components
Introduction
Diabetic Retinopathy is a diabetic complication that affect eye. The automated system was developed for suitable detection of the disease using fundus image and segmentation [1]. The location of anomalies in fovea is being identified and helpful for diagnosis. The detection of retinal parts was carried out as part of the overall device growth, and the results have been published.
The method of removing the usual retinal components: blood vessels, fovea, and optic disc, allows for the identification of lesions. There are different techniques explained in for blood vessel extraction namely Edge Enhancement and Edge Detection, Modified Matched Filtering, Continuation Algorithm and Image Line Cross Section. Diabetic retinopathy is a serious eye disorder that can lead to blindness in people of working age [2,3]. A multilayer neural network with three primary color components of the image, namely red, green, and blue as inputs, is used to identify and segment retinal blood vessels. The back propagation algorithm is used, which provides a reliable method for changing the weights in a feed-forward network. Deep convolutional neural networks have recently demonstrated superior image classification efficiency as compared to the feature-extracted image classification methods [4].
Authors proposed morphological processing, thresholding, edge detection, and adaptive histogram equalization to segment and extract blood vessels from retinal images [5].
Methodology
■ Blood vessel extraction
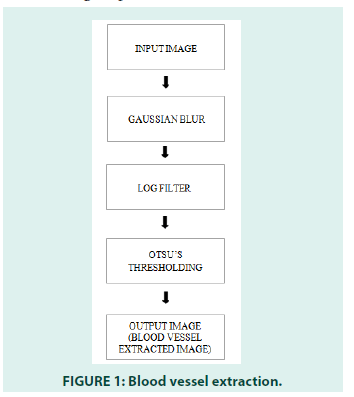
The Blood vessel extraction stage uses the Edge Enhancement and Edge Detection (EEED) technique to remove the blood vessels from the fundus image explained in FIGURE 1.
■Convolution Neural Network(CNN)
Convolution Neural Network consists of convolution layers, classification network, sub sampling layer, nonlinear layer and fully connected neural network. Many features in each pixel of the image are extracted from the network and is used to build the features that will map the image input applied. The use of fully connected layer is in the output layer is to find the decision.
■ Eyenet model
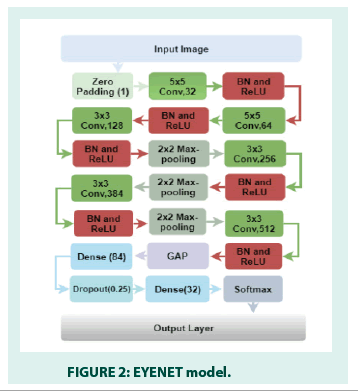
FIGURE 2 represents the EYENET Model. It consists of zero padding layer, convolutional layer, activation function, and batch normalization, drop out layers, max pooling layers, global averaging pooling layer, fully connected layer and output layer. In order to remove the boundary issues in an input image, the rows and columns of zeros are added in the input image for convolution operation. The convolution operation has been performed using number of kernels with different step sizes to maximize the accuracy. Rectified linear unit is considered as a nonlinear activation function to make the negative element becomes positive. Batch Normalization uses activation function to reduce the sensitivity for every input data variations. Drop out layer is responsible for preventing over fitting problem and also used to enhance the activation performance. The purpose of max pooling layer down samples the input images using filter sizes. The Global average pooling layer calculates the feature map average output. In fully connected layer, each neuron is connected to the other neuron that will be connected to the next layer. The purpose of output layer provides the probability occurrence of each class for the input image given.
■ Dataset
1. Original fundus images consisting of 516 images is divided into train set (413 images) and test set (103 images).
2. Ground truth Labels for Diabetic Retinopathy is divided into train and test set.
We used python code to remove the blood vessels from the fundus image and to train them using eyenet CNN (FIGURE 3).
Figure 3: Indian diabetic retinopathy image dataset.
Results and Discussion
We calculated the following parameters from the results
➢ Specificity
➢ Sensitivity
➢ Accuracy
■ Sensitivity
• It is also called as true positive rate (Tp), the recall, or probability of detection.
• The percentage of abnormal cells that are correctly identified as having the condition.
Sensitivity=Tp/Tp+Fn (1)
■ Specificity
• It is also called true negative rate (Tn).
• The actual negatives that are accurately identified as such.
• The percentage of normal cells that are correctly identified as having the condition.
Specificity=Tn/Fp+Tn (2)
■ Accuracy
• The accuracy is defined as the percentage of correctly classified instances
Accuracy=(Tp+Tn)/(Tp+Tn+Fp+Fn) (3)
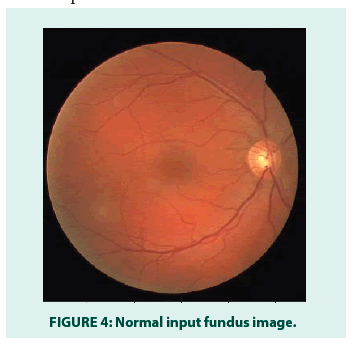
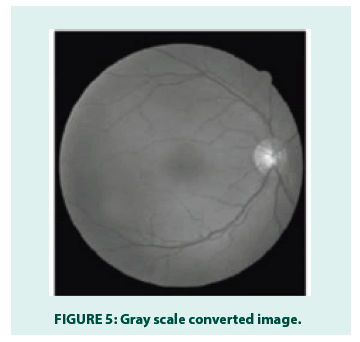
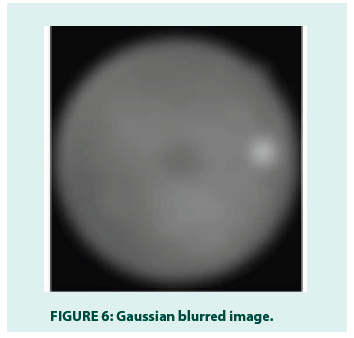
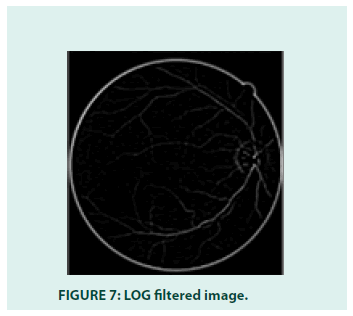
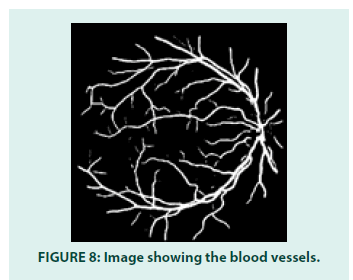
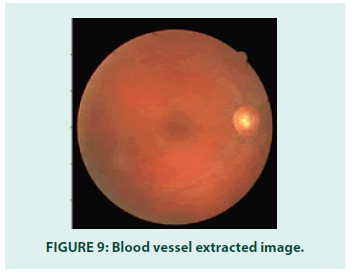
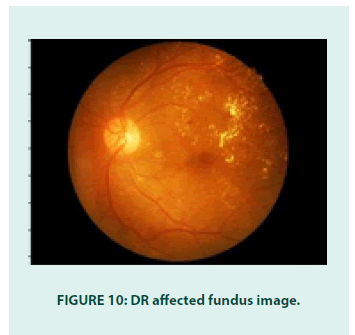
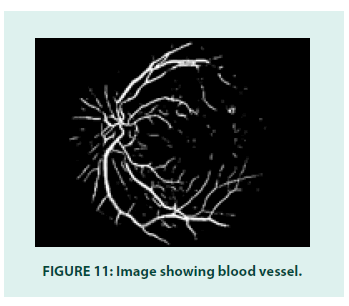
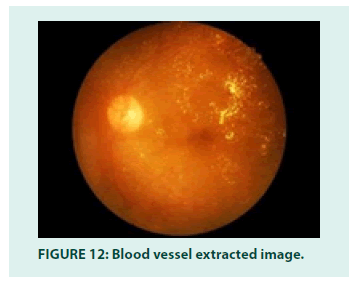
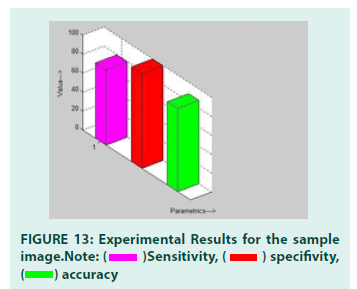
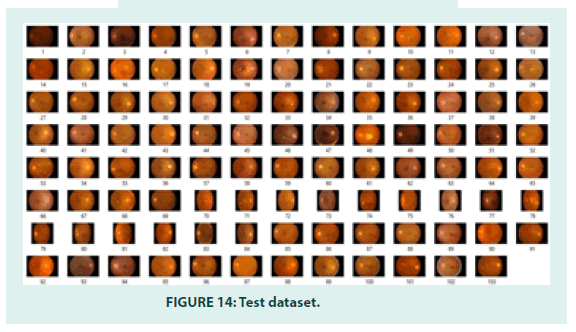
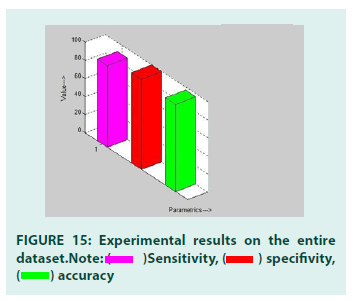
FIGURES 4-12 explains the concepts of extracted blood vessels images. Sensitivity:79.99%, Specificity: 97.99%, Accuracy: 88.03%. FIGURES 13 and 14 show the experimental results for the sample image, When the dataset of blood vessel extracted images are fed into the network architecture we obtained the following results. FIGURE 15 experimental results on the entire dataset. Our Eyenet algorithm was able to produce a sensitivity of about 90.02%, a specificity of about 98.77% and accuracy of about 96.08%.
Conclusion
Our findings have shown that an automatic diagnosis of DR can be made by segmenting blood vessels and categorizing them using CNN. The advantage of having a professional CNN is that, it can have a faster diagnosis and report than an expert can. Classifying the regular and extreme photos is straightforward, but classifying the DR as mild or moderate at an early stage is problematic. The importance of this research is that it identifies the disease at an earlier point, saving time and money. The suggested CNN has proven to be effective in correctly recognizing the DR early enough to avoid vision loss. It has 96.08 percent accuracy, a sensitivity of 90.02%, and a specificity of 98.77%.
References
- Katia Estabridis, Rui JP de Figueiredo. Automatic Detection and Diagnosis of Diabetic Retinopathy. IEEE. 9(1): 181-189 (2007).
- Asloob Ahmad Mudassar, Saira Butt. Extraction of Blood Vessels in Retinal Images Using Four Different Techniques. J Med Eng. 2013(2): 1-21(2013).
- Wilfred Franklin S, Edward Rajan S. Computerized Screening of Diabetic Retinopathy Employing Blood Vessel Segmentation in Retinal Images. Biocybern Biomed Eng. 34(2): 117-124 (2014).
- Kele Xu , Dawei Feng and Haibo Mi. Deep Convolutional Neural Network-Based Early Automated Detection of Diabetic Retinopathy Using Fundus Image. Molecules. 22(12): 2054 (2017).
- SN Sangeethaa, P Uma Maheswari. An Intelligent Model for Blood Vessel Segmentation in Diagnosing DR Using CNN. J Med Syst. 42(175): 9-13 (2018).
