Research Article - International Journal of Clinical Rheumatology (2018) Volume 13, Issue 5
High-field MRI exploration of the structural effects of cellular matrix™ on articular cartilage in knee osteoarthritis: A pilot study in 6 patients
- *Corresponding Author:
- Jean-François Marc
Rheumatologist
Health Consulting Agency AGCOSS 12 rue Pierre Dépierre 42300 Roanne, France
E-mail: contact.agcoss@gmail.com
Abstract
Objective: To analyze the potential modulatory effect of Cellular Matrix, a new medical device designed for the one-step preparation of platelet-rich plasma in presence of hyaluronic acid, on the structure of articular cartilage in patients suffering from knee osteoarthritis using high-field Magnetic Resonance Imaging measurements of longitudinal relaxation time after gadolinium injection.
Methods: The treatment consisted of a series of 3 intra-articular injections scheduled at D0, D60 and D180 into the affected knee of six patients with Kellgren-Lawrence grades of 1.5 to 3. Magnetic Resonance Imaging acquisitions were performed before the first injection at D0 (baseline), at D180 (just after the third injection) and at D270 (3 months after the third injection). The efficacy criterion was the variation of T1 relaxation time in different selected cartilage regions.
Results: Our study reveals a positive" time-dependent" structural effect of the combination of PRP and HA obtained with Cellular Matrix on the proteoglycan content of the knee joint cartilage. At D180, the weight-bearing areas were involved in two patients with Kellgren-Lawrence grades equal to or greater than 2. At D270, 5 patients showed an initial improvement in the weight-bearing area; only one patient with early external femoropatellar osteoarthritis (with a Kellgren-Lawrence grade of 1.5) had no improvement.
Conclusion: This pilot study demonstrates for the first time the modulatory effect on the structure of the knee joint cartilage of a combination of platelet-rich plasma and hyaluronic acid prepared with a specially dedicated medical device (Cellular Matrix) during the course treatment. Cellular Matrix could therefore be considered a Disease Modifying Osteoarthritis Device.
Keywords
cellular matrix, osteoarthritis, pilot
Introduction
While osteoarthritis (OA) is the most common cause of pain and disability among people over 50 years of age [1], knee OA is becoming a real public health issue as populations age. Knee OA is an underestimated condition. Its increasing prevalence [2-4] has been causally linked with obesity [5]. In the United States, surgeons performed 686,000 knee replacements in 2009, and projections predict the implantation of 1,520,000 prostheses in 2020 and 3,480,000 in 2030. Prosthetic revision rate (unicompartmental or total) continues to progress. A 600% increase is expected by 2030 [6].
Intra-articular injection of Hyaluronic Acid (HA), referred to as viscosupplementation, represents a recognized treatment for knee OA. Many clinical trials testing different HA preparations have been performed in humans, some of which report results versus saline placebo. Most of these studies conclude that HA is superior to a saline placebo, whatever its molecular weight [7-13].
More recently, Platelet-Rich Plasma (PRP) injections have proven to be an interesting treatment option [14-23]. The potential efficacy of PRP in the treatment of cartilage lesions has already been evaluated in vitro; particularly, PRP has been shown to increase the synthesis of proteoglycans and collagen in the extracellular matrix of cultured intervertebral disc cells [24]. However, very few studies have documented a possible modulatory effect of PRP on cartilage structure in Humans to date.
In recent years, it has become more and more obvious that the association of PRP with HA could provide added benefit for the treatment of joint degenerative diseases, due to their different mechanisms of actions to modulate the disease process [25-32].
Joint cartilage is made of water (60%- 80%) and chondrocytes surrounded by an extracellular matrix [33]. This matrix is composed of type II collagen (5%-10%) and proteoglycans (10%-20%) (PG) [34]. Cartilage damage in osteoarthritis is accompanied by biochemical changes in the collagen network and proteoglycans. The loss of proteoglycans has been associated with the early phases of osteoarthritis based on studies conducted in animal models [35,36] and anatomical parts [37,38]. These biochemical alterations, which escape conventional radiology techniques, can be detected by Magnetic Resonance Imaging (MRI), which represents therefore a tool of choice as a non-invasive approach to osteoarthritis.
Different functional approaches by MRI based essentially on relaxation time measurements coupled or not with the injection of a contrast agent have been developed. The T1 relaxation time measurement after injection of a gadolinium (Gd)-based contrast agent is the most commonly used technique [39] with measurements made about 90 minutes after the injection phase. Delayed gadolinium-enhanced MRI of cartilage (dGEMRIC) is based on the demonstration that Gd distributes in inverse relationship to cartilage PG content, leading to a reduction of T1 relaxation time.
Van Tiel described and used a promising reproducible methodology based on this technique to explore the potentially structural effect of HA in early stage knee OA, unsuccessfully [40].
Our study aimed at demonstrating with the same validated methodology that PRP combined with HA can be structurally effective on articular cartilage in knee OA. Using an innovative medical device allowing the preparation of autologous PRP in presence of HA in a one-step procedure and in close circuit (Cellular Matrix™), this collaborative work between rheumatologists and the Centre National de Recherche Scientifique (CNRS) has made it possible to study the effect of a combination of PRP and HA on the cartilage of the knee using high-field 3 Tesla (3T) MRI measurements. The safety and efficacy of Cellular Matrix has already been assessed in several clinical studies, including a recent one still showing a clinical benefit on pain and function 4 years after a 3-injection course treatment [41].
Objectives of the study
To analyze the potential modulatory effect of the combination of PRP and HA prepared with Cellular Matrix (CM-PRP-HA) on the structure of the articular cartilage in patients suffering from knee OA using high-field MRI measurements of longitudinal relaxation time after gadolinium injection (dGEMRIC), a scientifically recognized indirect index of proteoglycan (PG) content.
Patients and methods
Patients
Six patients were included after they provided their written informed consent. Inclusion criteria were as follows: participants older than 18 years, knee pain duration longer than 3 months and radiographic knee OA with Kellgren-Lawrence (KL) grades of 1 to 3 [24,42]. Exclusion criteria were: contraindications to MRI, renal insufficiency (glomerular filtration rate<60 ml/min), knee surgery within the last year, recent viscosupplementation or glucocorticoid injection. The study protocol was authorized by the French National Authority for Health (ANSM) and approved by local Ethics Committee (CPP Sud-Est I). The study was conducted according to Good Clinical Practice and guidelines of the Declaration of Helsinki.
Treatment
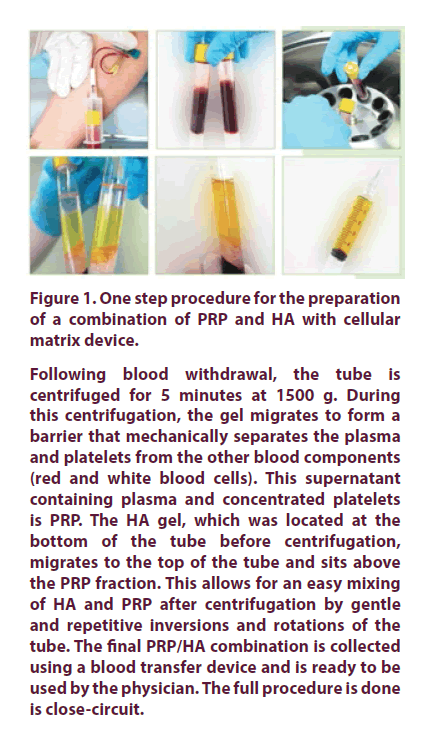
The combination of PRP and HA was obtained using the Cellular Matrix device, as per instructions for use supplied with the kit. Cellular Matrix, manufactured by Regen Lab SA, Le Mont-sur-Lausanne, Switzerland, is a class III medical device. It allows for the extemporaneous preparation of a combination of autologous PRP and non-crosslinked HA gel 2% (CM-PRP-HA) intended to be used for intra-articular injection (Figure 1). The HA used (2 ml) has a molecular weight of 1550 kDa. Each patient received a series of three intra-articular injections of CM-PRP- HA at D0 (baseline), D60 and D180, as described by Renevier et al. [41].
Following blood withdrawal, the tube is centrifuged for 5 minutes at 1500 g. During this centrifugation, the gel migrates to form a barrier that mechanically separates the plasma and platelets from the other blood components (red and white blood cells). This supernatant containing plasma and concentrated platelets is PRP. The HA gel, which was located at the bottom of the tube before centrifugation, migrates to the top of the tube and sits above the PRP fraction. This allows for an easy mixing of HA and PRP after centrifugation by gentle and repetitive inversions and rotations of the tube. The final PRP/HA combination is collected using a blood transfer device and is ready to be used by the physician. The full procedure is done is close-circuit.
Figure 1. One step procedure for the preparation of a combination of PRP and HA with cellular matrix device.
MRI acquisition
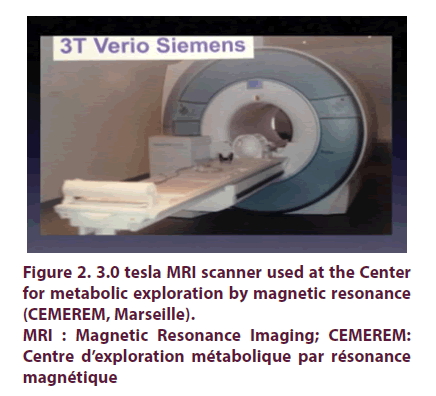
MRI acquisitions were performed before the injection of CM-PRP-HA at D0 (baseline), D180 (just after the third injection) and D270 (3 months after the third injection). Before each MRI session, a double dose (0.2 mmol/kg) of gadoteric acid (Dotarem®, Guerbet, France) was injected intravenously approximately 95 min before the MRI session. Patients were then asked to exercise for 15 minutes on a cyclo-ergometer at a comfortable rate and pedaling frequency in order to promote the contrast agent distribution within the knee articular cartilage as previously described [39,40]. MRI measurements were started after an additional 80 min resting period. MR imaging was performed on a 3.0 Tesla MRI scanner (Verio, Siemens Germany) using a set of phase array surface coils positioned above and below the knee (Figure 2). After a localization procedure using scout images, quantitative sagittal T1 mapping was performed using a dual-flip angle 3D GRE sequence with the following parameters as previously described [39,40,43] flip angles: 6 and 33°, TR: 15 ms, TE: 2.58 ms, Field-of-view (FOV): 144 mm; slice thickness: 3 mm, slice oversampling: 28.6%, matrix size: 384 * 384, bandwidth: 380 Hz/pixel, in plane resolution 0.4 * 0.4 mm. The resulting scan time was 4.5 min for a slab with 28 slices. In addition to the quantitative map, morphological evaluation was performed using a sagittal T1-W turbo spin echo sequence (TR-TE: 700-18 ms, voxel size: 0.5 * 0.4 mm), and both sagittal and coronal proton-density turbo spin echo sequences including a fat saturation scheme (TR-TE: 4000-37 ms, voxel size 0.5 * 0.4 mm and TR-TE: 3800-37 ms, voxel size: 0.4 * 0.4 mm). The FOV was 130 mm. the total scan time for the morphological evaluation was 7.1 min.
MRI : Magnetic Resonance Imaging; CEMEREM: Centre d’exploration métabolique par résonance magnétique
Figure 2. 3.0 tesla MRI scanner used at the Center for metabolic exploration by magnetic resonance (CEMEREM, Marseille).
Data analysis
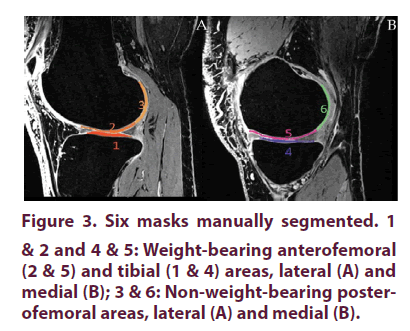
From the T1W-MRI baseline dataset, a central slice was selected in the external and internal tibiofemoral areas. For each area, three cartilage regions of interest (masks) were manually drawn by an expert surgeon using FSL View, the 3D viewer included in the FSL toolbox [39,40]. These 3 regions consisted of the weight-bearing cartilage of the femoral condyles (Areas #2 and #5), the posterior non-weight-bearing cartilage of the femoral condyles (Areas #3 and #6) and the weight-bearing cartilage of the tibial plateaus (Areas #1 and #4) (Figure 3). Using a non-linear registration method, these manual masks were propagated to the superior and inferior slices and then to the MRI datasets recorded at D180 and D270. For this purpose, T1W-MRI obtained at D180 and D270 have been registered into the baseline T1W-MRI dataset. The corresponding T1 maps have also been resampled using the baseline T1W-MRI dataset as a target.
All registration and resampling have been performed using the ANTS library (http://stnava.github.io/ANTs/) tools [44]. This registration process eliminated subjective visual slice matching and additional manual segmentations. As previously reported, cartilage regions with long T1 relaxation time have relatively high glycosaminoglycan (GAG) content compared to cartilage regions with short T1 relaxation time which indicates reduced GAG content (refs). In order to avoid all possible partial volume effects from the cortical bone, a very conservative segmentation procedure was used so that cartilage pixels in the close vicinity of bone pixels were systematically excluded. It has been previously suggested that a 95 ms difference in T1 relaxation time corresponding to a 19% change could be considered as clinically relevant and indicative of an improved cartilage GAG content as measured by 3D dGEMRIC at 3.0 Tesla [39]. We used a similar approach in order to compare the post-contrast T1 values at different times.
Results
Radiological and WORMS score
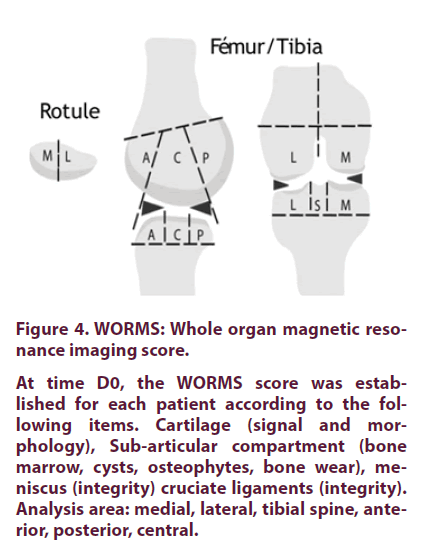
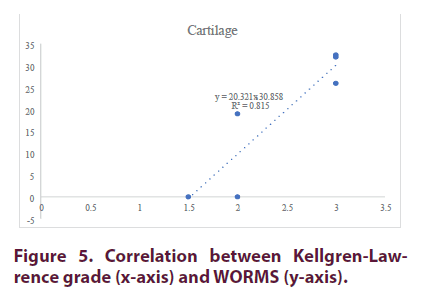
The radiological scores determined by two clinicians in charge of recruiting patients on the Kellgren-Lawrence (KL) scale (42) was between 1.5 and 3 (Table 1). The WORMS score (Figure 4) for cartilage ranged from 0 (patient, P1) to 32.5 for the patient 6 (P6) (Table 2) [45]. As shown in Figure 5, both scores were highly correlated (R2=0.8).
| KL score | Type of osteoarthritis | |
|---|---|---|
| P1 | 1.5 | Early external femoropatellar |
| P2 | 3 | Global with effusion |
| P3 | 2 | Internal femorotibial |
| P4 | 2 | External femorotibial and patellofemoral |
| P5 | 3 | Internal femorotibial |
| P6 | 3 | Internal femorotibial |
Table 1. Radiological scores of the patients included in the study, according to the Kellgren- Lawrence grading system.
At time D0, the WORMS score was established for each patient according to the following items. Cartilage (signal and morphology), Sub-articular compartment (bone marrow, cysts, osteophytes, bone wear), meniscus (integrity) cruciate ligaments (integrity). Analysis area: medial, lateral, tibial spine, anterior, posterior, central.
Figure 4. WORMS: Whole organ magnetic resonance imaging score.
| Score WORMS Cartilage | Score | rank | ||
|---|---|---|---|---|
| WORMS Total | rank | |||
| P1 | 0 | 1 | 6 | 6 |
| P2 | 32.5 | 209 | 1 | 1 |
| P3 | 21 | 62 | 5 | 5 |
| P4 | 19 | 75 | 4 | 3 |
| P5 | 26 | 85 | 3 | 2 |
| P6 | 32 | 64 | 2 | 4 |
Table 2. WORMS scores of the patients included in the study.
Quantitative MRI analyses
Analysis #1: D0 vs D180
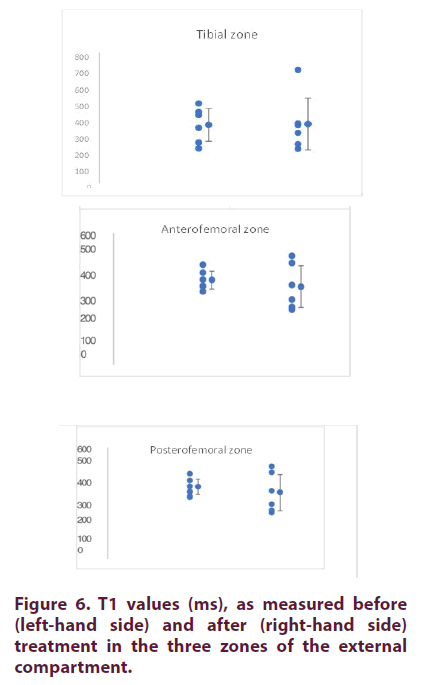
External compartment: At D0, the mean T1 values (± SD) were 358 ± 109, 373± 82 et 415 ± 123 for the tibial, anterofemoral and posterofemoral zones, respectively (Table 3 and Figure 6). The coefficients of variation (CV) were comparable between zones (22 to 31%). As shown in Table 3, the T1 values measured at D180 were not different from those measured at D0.
| Compartiment externe | ||||||
|---|---|---|---|---|---|---|
| Tibia | Fem ANT | Fem POST | ||||
| J0 | J180 | J0 | J180 | J0 | J180 | |
| P1 | 340 | 309 | 362 | 332 | 344 | 327 |
| P2 | 214 | 211 | 262 | 240 | 339 | 220 |
| P3 | 489 | 695 | 487 | 717 | 588 | 682 |
| P4 | 436 | 356 | 422 | 263 | 549 | 324 |
| P5 | 250 | 239 | 304 | 253 | 291 | 197 |
| P6 | 418 | 366 | 403 | 472 | 379 | 479 |
| moyenne | 358 | 363 | 373 | 379 | 415 | 371 |
| SD | 100 | 159 | 75 | 170 | 112 | 166 |
| CV (%) | 28 | 44 | 20 | 45 | 27 | 45 |
SD: Standard deviation; CV: Variation coefficient
Table 3. External compartment: T1 values measured at D0 and D180.
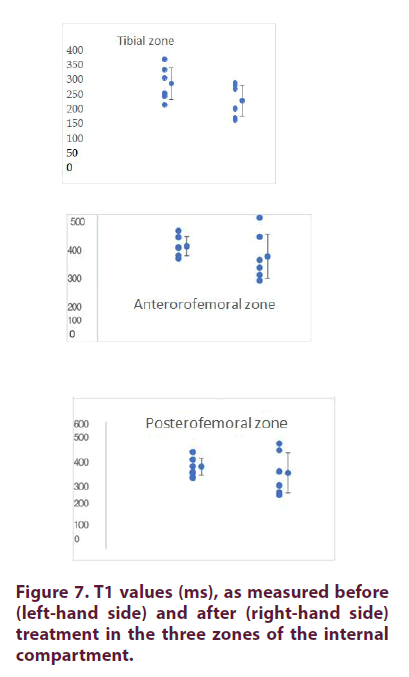
Internal compartment: At D0, the mean T1 values (± SD) were 284 ± 63, 293± 41 et 387 ± 45 respectively for the tibial, anterofemoral and posterofemoral zones, respectively (Table 4 and Figure 7). The coefficients of variation (CV) were comparable between zones (12 to 22%). As shown in Table 4, the T1 values measured at D180 were not different from those measured at D0. For comparative purposes, we calculated the ratio of T1 values between the external and internal compartments. For the tibial and anterofemoral compartments, the values were generally higher for the external compartment. This difference was not found for the posterofemoral compartment (Table 5).
| Compartiment interne | ||||||
|---|---|---|---|---|---|---|
| Tibia | Fem ANT | Fem POST | ||||
| J0 | J180 | J0 | J180 | J0 | J180 | |
| P1 | 335 | 194 | 353 | 209 | 421 | 264 |
| P2 | 208 | 160 | 289 | 240 | 358 | 365 |
| P3 | 305 | 286 | 327 | 329 | 389 | 497 |
| P4 | 239 | 154 | 257 | 182 | 361 | 253 |
| P5 | 248 | 278 | 246 | 159 | 335 | 297 |
| P6 | 371 | 265 | 286 | 405 | 458 | 465 |
| moyenne | 284 | 223 | 293 | 254 | 387 | 357 |
| SD | 57 | 55 | 38 | 86 | 41 | 95 |
| CV (%) | 20 | 25 | 13 | 34 | 11 | 27 |
SD: Standard deviation; CV: Variation coefficient
Table 4. Internal compartment: T1 values measured at D0 and D18.
| C Ext / C int | ||||||
|---|---|---|---|---|---|---|
| Tibial | Anterofemoral | Posterofemoral | ||||
| D0 | D180 | D0 | D180 | D0 | D180 | |
| P1 | 1.02 | 1.6 | 1.02 | 1.59 | 0.82 | 1.24 |
| P2 | 1.03 | 1.32 | 0.91 | 1 | 0.94 | 0.6 |
| P3 | 1.6 | 2.43 | 1.49 | 2.18 | 1.51 | 1.37 |
| P4 | 1.83 | 2.31 | 1.64 | 1.45 | 1.52 | 1.28 |
| P5 | 1.01 | 0.86 | 1.24 | 1.59 | 0.87 | 0.66 |
| P6 | 1.13 | 1.38 | 1.41 | 1.17 | 0.83 | 1.03 |
| Mean value | 1.27 | 1.65 | 1.28 | 1.49 | 1.08 | 1.03 |
| SD | 0 | 1 | 0 | 0 | 0 | 0 |
| CV (%) | 28 | 37 | 22 | 27 | 31 | 32 |
C Ext: External compartment; C int: Internal compartment; SD: Standard deviation; CV: Coefficient of variation
Table 5. Ratio of T1 values between external and internal compartments.
Zone score D180: Four patients had no improvement in the T1 values, while two patients had localized improvements. More specifically, P3 showed improvements in the tibial and anterofemoral zones of the external compartment and in the posterior femoral zones of the inner compartment. For P6, the increases were localized at the level of the posterofemoral zone (external compartment) and the anterofemoral zone of the internal compartment (Table 6).
| External compartment | Internal compartment | |||||
|---|---|---|---|---|---|---|
| Tibial | Antero-femoral | Postero-fermoral | Tibial | Antero- femoral | Postero-femoral | |
| P1 | 0 | 0 | 0 | 0 | 0 | 0 |
| P2 | 0 | 0 | 0 | 0 | 0 | 0 |
| P3 | 1 | 1 | 0 | 0 | 0 | 1 |
| P4 | 0 | 0 | 0 | 0 | 0 | 0 |
| P5 | 0 | 0 | 0 | 0 | 0 | 0 |
| P6 | 0 | 0 | 1 | 0 | 1 | 0 |
Table 6. Zone score at D180.
Total score at D180: Table 7 summarizes all this data and presents the total score calculated on this basis. In this context, Patient P3 had the best outcomes with improvements on both the weight-bearing and non-weight-bearing zones. Patient P6 also showed signs of improvement in both areas.
| Cpt EXT | Cpt INT | Total | Rank | Weight-bearing areas | Rank | Non-weight bearing areas | Rank | |
|---|---|---|---|---|---|---|---|---|
| P1 | 0 | 0 | 0 | 3 | 0 | 3 | 0 | 3 |
| P2 | 0 | 0 | 0 | 3 | 0 | 3 | 0 | 3 |
| P3 | 2 | 1 | 3 | 1 | 2 | 1 | 1 | 1 |
| P4 | 0 | 0 | 0 | 3 | 0 | 3 | 0 | 3 |
| P5 | 0 | 0 | 0 | 3 | 0 | 3 | 0 | 3 |
| P6 | 1 | 1 | 2 | 2 | 1 | 2 | 1 | 1 |
Cpt ext: External compartment; Cpt int: Internal compartment
Table 7. Total score at D180.
Analysis #2: D0 vs D270
External compartment: At D0, the mean T1 values (± SD) were 358 ± 109, 373 ± 82 et 415 ± 123, respectively for the tibial, anterofemoral and posterofemoral zones, respectively (Table 8). The coefficients of variation (CV) were comparable between zones (22 to 31%). As shown in Table 8, the T1 values measured at D270 were not different from those measured at D0.
| External compartment | ||||||
|---|---|---|---|---|---|---|
| Tibial | Anterofemoral | Posterofemoral | ||||
| J0 | J270 | J0 | J270 | J0 | J270 | |
| P1 | 340 | 346 | 362 | 388 | 344 | 408 |
| P2 | 214 | 288 | 262 | 324 | 339 | 313 |
| P3 | 489 | 637 | 487 | 693 | 588 | 739 |
| P4 | 436 | 295 | 422 | 310 | 549 | 259 |
| P5 | 250 | 440 | 304 | 348 | 291 | 284 |
| P6 | 418 | 441 | 403 | 349 | 379 | 445 |
| Mean values | 358 | 408 | 373 | 402 | 415 | 408 |
| SD | 100 | 120 | 75 | 133 | 112 | 162 |
| CV (%) | 28 | 29 | 20 | 33 | 27 | 40 |
SD: Standard deviation; CV: Variation coefficient
Table 8. External compartment: T1 values measured at D0 and D270.
Internal compartment: At D0, the mean T1 values (± SD) were 284 ± 63, 293± 41 et 387 ± 45, respectively for the tibial, anterofemoral and posterofemoral zones, respectively (Table 9). The coefficients of variation (CV) were comparable between zones (12 to 22%). As shown in Table 9, the T1 values measured at D270 were not different from those measured at D0. For comparative purposes, we calculated the ratio of T1 values between the external and internal compartments (Table 10). For the tibial and anterofemoral compartments, the values were generally higher for the external compartment. This difference was not found for the posterofemoral compartment.
| Internal compartment | ||||||
|---|---|---|---|---|---|---|
| Tibial | Anterofemoral | Posterofemoral | ||||
| J0 | J270 | J0 | J270 | J0 | J270 | |
| P1 | 335 | 261 | 353 | 302 | 421 | 339 |
| P2 | 208 | 147 | 289 | 217 | 358 | 357 |
| P3 | 305 | 409 | 327 | 450 | 389 | 616 |
| P4 | 239 | 287 | 257 | 287 | 361 | 330 |
| P5 | 248 | 238 | 246 | 299 | 335 | 369 |
| P6 | 371 | 776 | 286 | 247 | 458 | 408 |
| Mean values | 284 | 353 | 293 | 300 | 387 | 403 |
| SD | 57 | 204 | 38 | 73 | 41 | 98 |
| CV (%) | 20 | 58 | 13 | 24 | 11 | 24 |
SD: Standard deviation; CV: Variation coefficient
Table 9: Internal compartment: T1 values measured at D0 and D270
| C Ext / C int | ||||||
|---|---|---|---|---|---|---|
| Tibial | Anterofemoral | Posterofemoral | ||||
| J0 | J270 | J0 | J270 | J0 | J270 | |
| P1 | 1.02 | 1.33 | 1.02 | 1.28 | 0.82 | 1.2 |
| P2 | 1.03 | 1.96 | 0.91 | 1.49 | 0.94 | 0.88 |
| P3 | 1.6 | 1.56 | 1.49 | 1.54 | 1.51 | 1.2 |
| P4 | 1.83 | 1.03 | 1.64 | 1.08 | 1.52 | 0.79 |
| P5 | 1.01 | 1.85 | 1.24 | 1.16 | 0.87 | 0.77 |
| P6 | 1.13 | 0.57 | 1.41 | 1.41 | 0.83 | 1.09 |
| Mean values | 1.27 | 1.38 | 1.28 | 1.33 | 1.08 | 0.99 |
| SD | 0 | 1 | 0 | 0 | 0 | 0 |
| CV (%) | 28 | 38 | 22 | 14 | 31 | 20 |
SD: Standard deviation; CV: Variation coefficient
Table 10. Ratio of T1 values between external and internal compartments.
Zone score at D270: At this stage and given the small number of values, we opted for an individual analysis strategy by adapting the results of a previous study [40]. We chose 19% as a significant threshold of increase. This threshold was calculated on the basis of the T1 (500 ms) values reported by van Tiel et al and the 95 ms value reported as significant [39,40]. In other words, a 19% increase in the T1 value was considered as a sign of improvement (score = 1) while an increase of less than 19% was assigned a score of 0. Five patients had localized T1 values improvements. More specifically, P3 showed improvements in all areas (external and internal compartments). For P6, an increase was localized in the tibial zone of the internal compartment. The other three patients P2, P4 and P5 have each shown an initial improvement each time at the weight-bearing areas. On the other hand, patient P1, who only suffered from an early stage of knee osteoarthritis, showed no change. Table 11 summarizes these zone scores.
| External compartment | Internal compartment | |||||
|---|---|---|---|---|---|---|
| Tibial | Antero-femoral | Postero-fermoral | Tibial | Antero- femoral | Postero-femoral | |
| P1 | 0 | 0 | 0 | 0 | 0 | 0 |
| P2 | 1 | 1 | 0 | 0 | 0 | 0 |
| P3 | 1 | 1 | 1 | 1 | 1 | 1 |
| P4 | 0 | 0 | 0 | 1 | 0 | 0 |
| P5 | 1 | 0 | 0 | 0 | 1 | 0 |
| P6 | 0 | 0 | 0 | 1 | 0 | 0 |
SD: Standard deviation; CV: Variation coefficient
Table 11. Zone score at D270.
Total score at D270: Table 12 summarizes all this data and presents the total score calculated on this basis. In this context, patient P3 had the best outcomes with improvements on both the weight-bearing and non-weight-bearing zones. Patient P6 showed signs of improvement only in the weight-bearing area.
| Cpt EXT | Cpt INT | Total | Weight-bearing areas | Non-weight- bearing areas | |
|---|---|---|---|---|---|
| P1 | 0 | 0 | 0 | 0 | 0 |
| P2 | 2 | 0 | 2 | 2 | 0 |
| P3 | 3 | 3 | 6 | 4 | 2 |
| P4 | 0 | 1 | 1 | 1 | 0 |
| P5 | 1 | 1 | 2 | 2 | 0 |
| P6 | 1 | 0 | 1 | 1 | 0 |
Table 12. Total score at D270.
Discussion
Our study is based on the well documented inverse relationship between Gadolinium penetration into the cartilage and T1 relaxation time, and the relationship between T1 relaxation time and the proteoglycan content in cartilage [39,40]. In general, the T1 values reported in this study are lower than the values reported in the literature for healthy subjects but also for subjects with osteoarthritis [39,40]. In accordance with the results reported in the literature [43,46- 49], this decrease clearly indicates a significant loss of proteoglycans. This loss seems to be less pronounced in the external compartment than in the internal compartment, in line with previous work [39,40].
In addition, T1 values were correlated with WORMS radiological score values, strengthening the adequacy of T1 measurements as a quantitative tool for cartilage monitoring. Such a conclusion has also been proposed on the basis of a comparative analysis between T1 measurements and T1rho measurements [50].
It should be noted that the measurement method we chose for the T1 relaxation time was different from the one used in the work of Van Tiel et al. [39,40]. This could explain the differences in values between the two studies without impacting our comparative analysis. On the basis of this difference, we chose to adapt our analysis method to the 95 ms threshold previously reported [39] for T1 values close to 500 ms. Consequently, we considered a 19% increase in the T1 value as an indication of improvement in the proteoglycan content.
Statistically, (at mean values, Mann Whitney paired series tests were performed with a statistical threshold p<0.05), there was no difference between the measurements at D0 and D180, nor between D0 and D270, which probably reflects the small number of subjects. However, based on an individualized analysis and a 19% threshold increase in the T1 value, five patients showed localized improvements.
At D180, these improvements were localized in the tibial and anterofemoral areas of the outer compartment and in the posterofemoral area of the inner compartment for Patient P3. For patient P6, these improvements were localized in the posterofemoral area (outer compartment) and the anterofemoral area of the inner compartment. In both cases, the weight-bearing areas were involved in these two patients who had a Kellgren-Lawrence score equal to or greater than 2.
At D270, we observed a consolidation for Patient P3 with a score that tripled. In this case, all cartilage areas showed improvement. For Patient P6, the score was reduced from 2 to 1 with an improvement in the tibial area of the internal compartment. While Patients P2, P4 and P5 showed an initial improvement in the weight-bearing area, only Patient P1 had no improvement.
Our study therefore reveals a positive" time-dependent" structural effect of the combination of PRP and HA obtained with Cellular Matrix on the proteoglycan content of the knee joint cartilage. Patients responded relatively quickly given the avascular and paucicellular nature of the cartilage tissue which is characterized by a very slow turn-over in physiological situations and even more so in the hostile inflammatory context of knee osteoarthritis.
Beside growth and regeneration factors, the platelet secretome contains anti-inflammatory cytokines; PRP probably acts through this dual effect [51]. Hyaluronic acid, on the other hand, is expected to act as a support potentiating PRP activity [32] and have a facilitating role that may potentiate or maximize tissue response to growth factors [52].
Clinically, all treated patients experienced improvement in pain and stiffness in accordance with the study of Renevier et al. [41]. This confirms the clinical relevance of the variations in T1 values defined by Van Tiel et al. [39,40] (95 ms for values close to 500 ms or a 19% difference).
Conclusion
This is a pilot, proof of concept study, aiming at demonstrating for the first time the modulatory effect on the structure of knee joint cartilage of a combination of PRP and HA prepared with a specially dedicated medical device (Cellular Matrix).
The small number of patients did not allow for a relevant statistical study; however, the individual analysis strategy adapted from Van Tiel et al. [39,40] was appropriate. Thus, the individual comparative analysis considering a 19% increase in the T1 value as significant clearly indicated that 2 out of 6 patients had positive outcomes at D180, while 5 out of 6 patients had improvements at D270. One patient aggregated positive outcomes over the 6 zones studied. Only Patient 1 did not show any improvement.
A modulatory time-dependent effect on cartilage structure is thus demonstrated. The clinical confrontation is unequivocal with improvement of all treated patients for both pain and stiffness scores, in line with the Renevier’s study [41]. In the end, this research work demonstrates that the combination of PRP and HA (Cellular Matrix) is structurally effective at D270. Cellular Matrix can therefore be considered as a true anti-osteoarthritis treatment with a proven structural effect on knee joint cartilage in Humans. A large-scale multicenter European study with the same methodology and with the same parameters but with a long-term MRI analysis scheduled at D360 is therefore required in order to confirm our positive preliminary data.
Acknowledgment
The authors would like to acknowledge David Bendahan, Research Director, CNRS, Hôpital de la Timone and Professor Maxime Guye, Director of CEMEREM, 13000 Marseille, for their contribution to this work.
References
- Zhang Y, Jordan JM. Epidemiology of osteoarthritis. Clin. Geriatr. Med. 26(3), 355–369 (2010).
- Altman RD. Overview of osteoarthritis. Am. J. Med. 83(4), 65–69 (1987).
- Bijlsma JW, Berenbaum F, Lafeber FP. Osteoarthritis: An update with relevance for clinical practice. Lancet. 377(9783), 2115–26 (2011).
- Blagojevic M, Jinks C, Jeffery A et al. Risk factors for onset of osteoarthritis of the knee in older adults: A systematic review and meta-analysis. Osteoarthritis. Cartilage. 18(1), 24–33 (2010).
- Niu J, Zhang YQ, Torner J et al. Is obesity a risk factor for progressive radiographic knee osteoarthritis? Arthritis. Rheum. 61(3), 329–335 (2009).
- Kurtz S, Ong K, Lau E et al. Projections of primary and revision hip and knee arthroplasty in the United States from 2005 to 2030. J. Bone. Joint. Surg. Am. 89(4), 780–785 (2007).
- Petrella RJ, Cogliano A, Decaria J. Combining two hyaluronic acids in osteoarthritis of the of the knee: A randomized, double knee: placebo-controlled trial. Clin. Rheum. 27(8), 975–981 (2008).
- Petrella RJ, Petrella M. A prospective, randomized, double-blind, placebo-controlled study to evaluate the efficacy of intraarticular hyaluronic acid for osteoarthritis of the knee. J. Rheumatol. 33(5), 951–956 (2006).
- Brandt KD, Block JA, Michalski JP et al. Efficacy and safety of intraarticular sodium hyaluronate in knee osteoarthritis. ORTHOVISC Study Group.
- Wobig M, Dickhut A, Maier R et al. Viscosupplementation with hylanG-F 20: A 26-week controlled tria of efficacy and safety in the osteoarthritic knee. Clin. Ther. 20(3), 410–423 (1998).
- Altman RD, Rosen JE, Bloch DA et al. Double-blinded, randomized, saline controlled study of the efficacy and safety of EUFLEXXA for treatment of painful osteo-arthritis of the knee, with an open-label safety extension (the FLEXX trial). Semin. Arthritis. Rheum. 39(1), 1–9 (2009).
- Day R, Brooks P, Conaghan PG et al. Multicenter trial Group: A double blind, ran-domized, multicenter, parallel group study of the effectiveness and tolerance of intraarticu-lar hyluronan in osteoarthritis of the knee. J. Rheumatol. 31(4), 775–782 (2004).
- Cubukçu D, Ardic F, Karabulut N et al. HylanG-F 20 efficacy on articular cartilage quality in patients with knee osteoarthritis: clinical and MRI assessment.
- Laudy AB, Bakker EW, Rekers M et al. Efficacy of platelet-rich plasma injections in osteoarthritis of the knee: A systematic review and meta-analysis. Br. J. Sports. Med. (2014).
- Laver L, Marom N, Dnyanesh L et al. PRP for de-generative cartilage disease: A systematic review of clinical studies. Cartilage. (2016).
- Dai WL, Zhou AG, Zhang H et al. Efficacy of platelet-rich plasma in the treatment of knee osteoarthritis: A meta-analysis of randomized controlled trials. Arthroscopy. 33(3), 659–670 (2017).
- Meheux CJ, McCulloch PC, Lintner DM et al. Efficacy of intra-articular platelet-rich plasma injections in knee osteoarthritis: A systematic review. Arthroscopy. 32(3), 495–505 (2016).
- Lai LP, Stitik TP, Foye PM et al. Use of platelet rich plasma in intra-articular knee injections for osteoarthritis: A systematic review. PMR. (2015).
- Khoshbin A, Leroux T, Wasserstein D, et al. The efficacy of platelet-rich plasma in the treatment of symptomatic knee osteoarthritis: A systematic review with quantitative synthesis. Arthroscopy. 29(12), 2037–2048 (2013).
- Chang KV, Hung CY, Aliwarga F et al. Comparative effectiveness of platelet-rich plasma injections for treating knee joint cartilage degenerative pathology: A systematic review and meta-analysis. Arch Phys Med Rehabil. 95(3), 562–575 (2014).
- Campbell KA, Saltzman BM, Mascarenhas R et al. Does intra-articular platelet-rich plasma injection provide clinically superior outcomes compared with other therapies in the treatment of knee osteoarthritis? A systematic re-view of overlapping meta-analyses. Arthroscopy. 31(11), 2213–2221 (2015).
- Tietze DC, Geissler K, Borchers J. The effects of platelet-rich plasma in the treatment of large-joint osteoarthritis: A systematic review. Phys. Sportsmed. 42(2), 27–37 (2014).
- Riboh JC, Saltzman BM, Yanke AB et al. Effect of leukocyte concentration on the efficacy of platelet-rich plasma in the treatment of knee osteoarthritis. Am. J. Sports. Med. 44(3), 792–800 (2016).
- Akeda K, Pichika R, Attawia M et al. Platelet-rich plasma (PRP) stimulates the extracellular matrix metabolism of porcine nucleus pulpo-sus and anulus fibrosus cells cultures in alginate beads. Spine. 31(9), 959–966 (2006).
- Andia I, Abate M. Knee osteoarthritis: hyaluronic acid, platelet-rich plasma or both in association? Expert. Opin. Biol. Ther. (2014).
- Sundman EA, Cole BJ, Karas V et al. The anti-inflammatory and matrix restorative mechanisms of platelet-rich plasma in osteoarthri-tis. Am. J. Sports. Med. 42(1), 35–41 (2014).
- Chen WH, Lo WC, Hsu WC et al. Synergistic anabolic actions of hyaluronic acid and platelet-rich plasma on cartilage regeneration in osteoarthritis therapy. Biomaterials. 35(36), 9599–9607 (2014).
- Russo F, D'Este M, Vadala G et al. Platelet rich plasma and hyaluronic acid blend for the treatment of osteoarthritis: Rheological and biological evaluation. PLoS. One. 11(6), e0157048 (2016).
- Lana JF, Weglein A, Sampson S et al. Randomized con-trolled trial comparing hyaluronic acid, platelet-rich plasma and the combination of both in the treatment of mild and moderate osteoarthritis of the knee. JSRM. 12(2) (2016).
- Saturveithan C, Premganesh G, Fakhrizzaki S et al. Intra-articular hyaluronic acid (HA) and platelet rich plasma (PRP) injection versus hyaluronic acid (HA) injection in Grade III and IV knee osteoarthritis (OA) patients: A retrospective study on functional outcome. 45th Malaysian orthopaedic association; 2015; Kuala Lumpur.
- Chen SH, Kuan TS, Kao MJ et al. Clinical effectiveness in severe knee osteo-arthritis after intra-articular platelet-rich plasma therapy in association with hyaluronic acid injection: Three case reports. Clin. Interv. Aging. 11, 1213–1219 (2016).
- Abate M, Verna S, Schiavone C et al. Efficacy and safety profile of a compound composed of platelet-rich plasma and hyaluronic acid in the treatment for knee osteoarthritis (preliminary results). Eur. J. Orthop. Surg. Traumatol. 25(8), 1321–1326 (2015).
- Rice MA, Waters KR, Anseth KS. Ultrasound monitoring of cartilaginous matrix evolution in degradable PEG hydrogels. Acta. Biomater. 5(1), 152–161 (2009).
- Ratcliffe A, Seibel MJ. Biochemical markers of osteoarthritis. Curr. Opin. Rheumatol. 2(5), 770–776 (1990).
- Van de Loo AA, Arntz OJ, Otterness IG et al. Proteoglycan loss and sub-sequent replenishment in articular cartilage after a mild arthritic insult by IL-1 in mice: impaired proteoglycan turnover in the recovery phase. Agents. Actions. 41(3-4), 200–208 (1994).
- Bacic G, Liu KJ, Goda F et al. MRI contrast enhanced study of cartilage proteoglycan degradation in the rabbit knee. Magn. Reson. Med. 37(5), 764–768 (1997).
- Insko EK, Kaufman JH, Leigh JS et al. Sodium NMR evaluation of articular carti-lage degradation. Magn. Reson. Med. 41(1), 30–34 (1999).
- Bashir A, Gray ML, Hartke J et al. Nondestructive imaging of human cartilage glycosaminoglycan concentration by MRI. Magn. Reson. Med. 41(5), 857–865 (1999).
- Van Tiel J, Bron EE, Tiderius CJ et al. Reproducibility of 3D delayed gadolinium enhanced MRI of cartilage (dGEMRIC) of the knee at 3.0 T in patients with early stage osteoarthritis. European. Radiol. 23(2), 496–504 (2013).
- Van Tiel J, Reijman M, Bos PK et al. Delayed gadoliniumenhanced MRI of cartilage (dGEMRIC) shows no change in cartilage structural composition after viscosupplementation in patients with early-stage knee osteoarthritis. PloS. one. 8(11), e79785 (2013).
- Renevier JL, Marc JF, Adam Ph et al. “Cellular matrix™ PRP-HA”: A new treatment option with platelet-rich plasma and hyaluronic acid for patients with osteo-arthritis having had an unsatisfactory clinical response to hyaluronic acid alone: Results of a pilot, multicenter French study with long-term follow-up. Int. J. Clin. Rheumatol. 13(4), 226–229 (2018).
- Kellgren JH, Lawrence JS. Radiological assessment of osteo-arthrosis. Ann. Rheum. Dis. 16(4), 494–502 (1957).
- Manuel A, Li W, Jellus V et al. Variable flip angle-based fast threed-imensional T1 mapping for delayed gadolinium-enhanced MRI of cartilage of the knee: Need for B1 correction. Magnetic. Resonance. In. medicine. 65(5), 1377–1383 (2011).
- Avants BB, Tustison NJ, Song G et al. A reproducible evalua-tion of ANTs similarity metric performance in brain image registration. Neu-roimage. 54(3), 2033–2044 (2011).
- Peterfy CG, Guermazi A, Zaim S et al. Whole-organ magnetic resonance imaging score (WORMS) of the knee in osteoarthritis. Osteoarthr. Cartil. 12(3), 177–190 (2004).
- Tiderius CJ, Olsson LE, Leander P et al. Delayed gadolinium-enhanced MRI of cartilage (dGEMRIC) in early knee osteoarthritis. Magnetic. Resonance. In. medicine. 49(3), 488–492 (2003).
- Tiderius CJ, Svensson J, Leander P et al. dGEMRIC (delayed gadolini-umenhanced MRI of cartilage) indicates adaptive capacity of human knee cartilage. Magnetic. Resonance. In. medicine. 51(2), 286–290 (2004).
- McKenzie CA, Williams A, Prasad PV et al. Three-dimensional delayed gadoliniumenhanced MRI of cartilage (dGEMRIC) at 1.5T and 3.0T. Journal of magnetic resonance imaging: JMRI. 24(4), 928–933 (2006).
- Williams A, Sharma L, McKenzie CA et al. Delayed gadolinium-enhanced magnetic resonance imaging of cartilage in knee osteoarthritis: findings at different radiographic stages of disease and relationship to malalignment. Arthritis. Rheumatism. 52(11), 3528–3535 (2005).
- Van Tiel J, Kotek G, Reijman M et al. Is T1rho mapping an alternative to delayed gadolinium-enhanced MR imaging of cartilage in the assessment of sulphated glycosaminoglycan content in human osteoarthritic knees? An in vivo validation study. Radiol. 279(2), 523 (2016).
- Andia I, Maffulli N. Platelet-rich plasma for managing pain and inflammation in osteoar-thritis. Nat. Rev. Rheumatol. 9(12), 721–730 (2013).
- Xie Y, Upton Z, Richards S et al. Hyaluronic acid: Evaluation as a potential delivery vehicle for vitronectin:growth factor complexes in wound healing applications. J. Control. Release. 153(3), 225–232 (2011).
